| Param | Original file | Final file |
|---|---|---|
| Filename | modeM0/AS1A12_004T01_9000005520_40133cztM0_level2.fits | modeM0/AS1A12_004T01_9000005520_40133cztM0_level2_quad_clean.evt |
| Size (bytes) | 631,304,640 | 76,769,280 |
| Size | 602.1 MB | 73.2 MB |
| Events in quadrant A | 2,855,859 | 610,515 |
| Events in quadrant B | 2,745,599 | 627,191 |
| Events in quadrant C | 11,072,211 | 259,059 |
| Events in quadrant D | 6,255,156 | 431,477 |
| Mode M0 | |||
|---|---|---|---|
| Quadrant | BADHDUFLAG | Total packets | Discarded packets |
| A | 0 | 11723 | 2 |
| B | 0 | 12062 | 1 |
| C | 0 | 36822 | 1 |
| D | 0 | 22428 | 1 |
| Mode M9 | |||
|---|---|---|---|
| Quadrant | BADHDUFLAG | Total packets | Discarded packets |
| A | 0 | 13 | 0 |
| B | 0 | 13 | 0 |
| C | 0 | 13 | 0 |
| D | 0 | 13 | 0 |
| Mode SS | |||
|---|---|---|---|
| Quadrant | BADHDUFLAG | Total packets | Discarded packets |
| A | 0 | 114 | 0 |
| B | 0 | 114 | 0 |
| C | 0 | 114 | 0 |
| D | 0 | 114 | 0 |
| Quadrant | Total seconds | Saturated seconds | Saturation percentage |
|---|---|---|---|
| A | 5666 | 6 | 0.105895% |
| B | 5666 | 60 | 1.058948% |
| C | 5666 | 3353 | 59.177550% |
| D | 5666 | 1334 | 23.543946% |
Noise dominated data is calculated using 1-second bins in cleaned event files. If a bin has >2000 counts, and if more than 50% of those come from <1% of pixels, then it is considered to be noise-dominated and hence unusable.
| Quadrant | # 1 sec bins | Bins with >0 counts | Bins with >2000 counts | High rate bins dominated by noise | Noise dominated (total time) | Noise dominated (detector-on time) | Marked lightcurve |
|---|---|---|---|---|---|---|---|
| A | 6949 | 5667 | 2 | 2 | 0.03% | 0.04% | 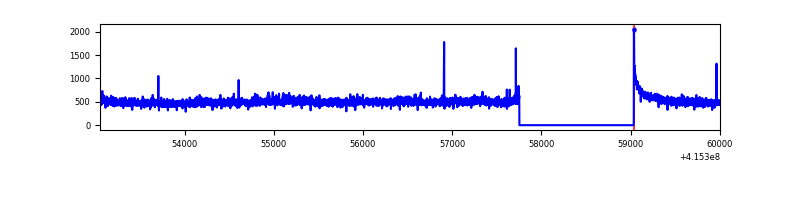 |
| B | 6949 | 5667 | 37 | 37 | 0.53% | 0.65% | 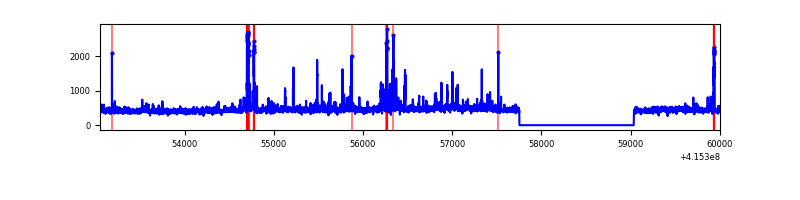 |
| C | 6948 | 5665 | 3374 | 3374 | 48.56% | 59.56% | 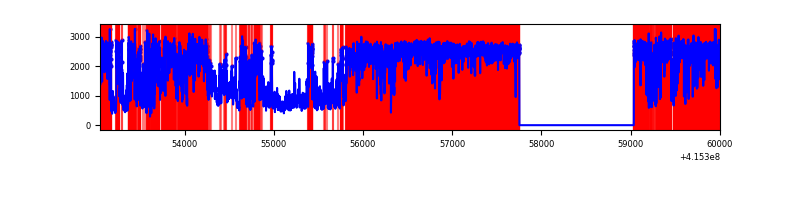 |
| D | 6949 | 5667 | 1343 | 1343 | 19.33% | 23.70% | 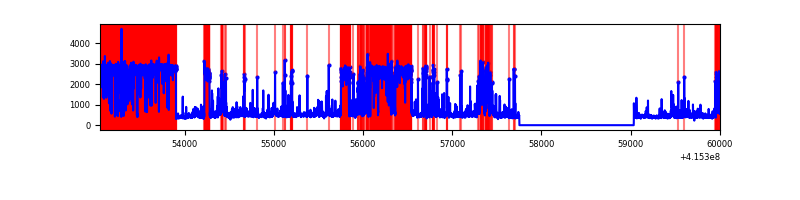 |
Top three noisy pixels from each quadrant. If the there are fewer than three noisy pixels in the level2.evt file, extra rows are filled as -1
| Pixel properties | Quadrant properties | ||||||
|---|---|---|---|---|---|---|---|
| Quadrant | DetID | PixID | Counts | Sigma | Mean | Median | Sigma |
| A | 10 | 83 | 411265 | 3239.88 | 619 | 607 | 126.8 |
| A | 6 | 10 | 47946 | 373.48 | 619 | 607 | 126.8 |
| A | 13 | 254 | 7146 | 51.59 | 619 | 607 | 126.8 |
| B | 5 | 255 | 212230 | 1750.62 | 616 | 597 | 120.9 |
| B | 4 | 171 | 45244 | 369.32 | 616 | 597 | 120.9 |
| B | 0 | 230 | 35813 | 291.3 | 616 | 597 | 120.9 |
| C | 9 | 187 | 9245634 | 96017.02 | 410 | 413 | 96.3 |
| C | 15 | 214 | 163664 | 1695.46 | 410 | 413 | 96.3 |
| C | 14 | 254 | 36612 | 375.95 | 410 | 413 | 96.3 |
| D | 12 | 227 | 3395294 | 26938.9 | 516 | 502 | 126.0 |
| D | 2 | 249 | 434896 | 3447.07 | 516 | 502 | 126.0 |
| D | 13 | 249 | 124452 | 983.59 | 516 | 502 | 126.0 |
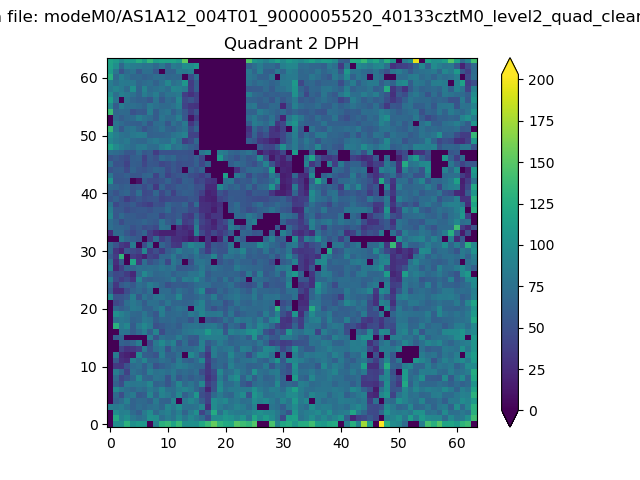
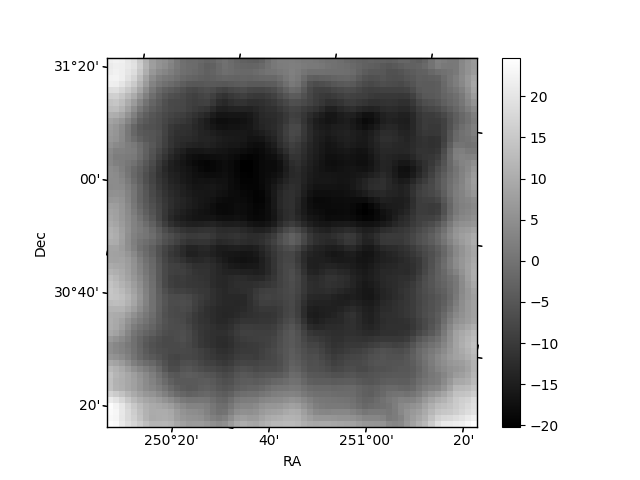
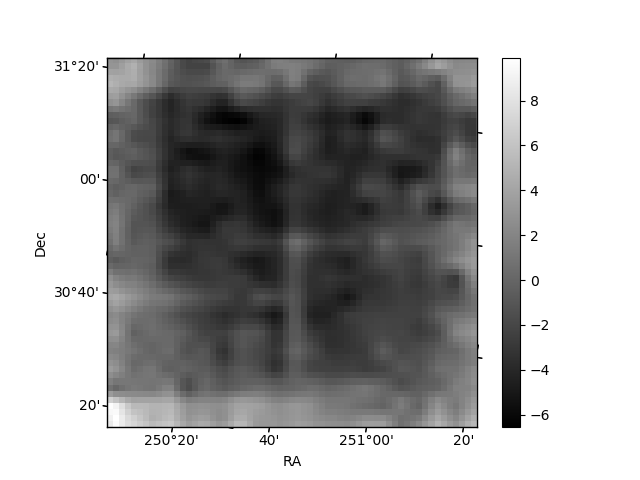
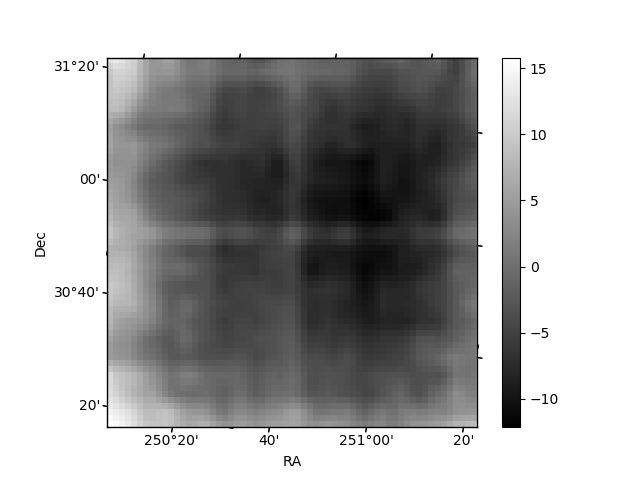
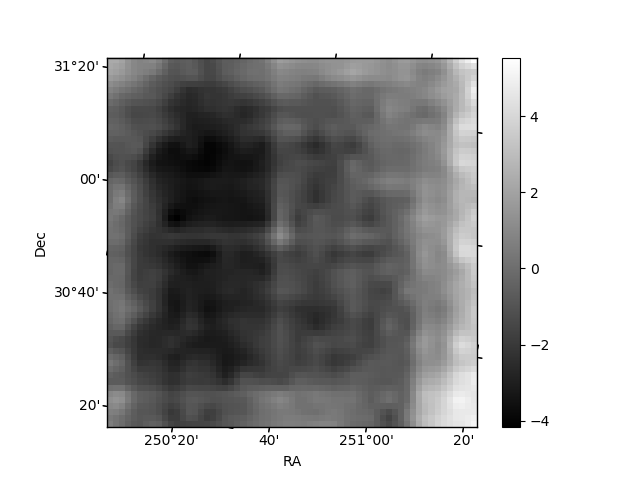
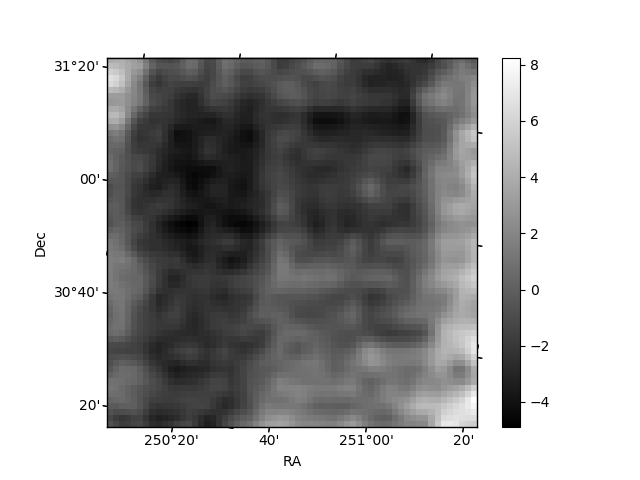
Histogram calculated using DETX and DETY for each event in the final _common_clean file
| Quadrant A | 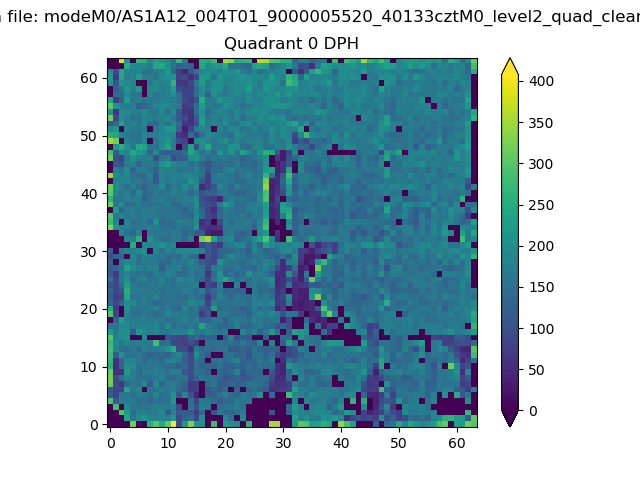 |
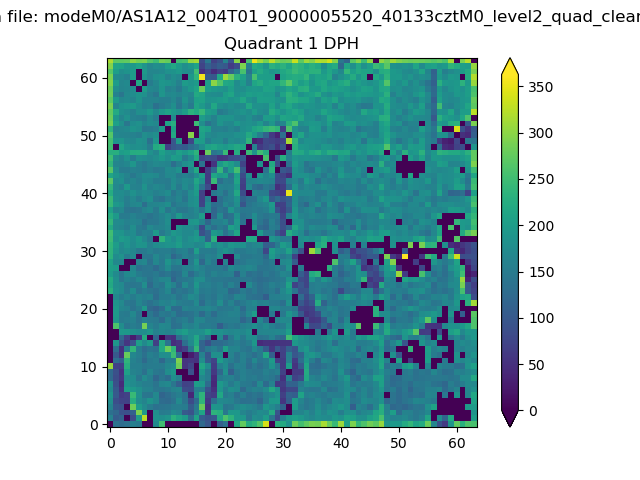 |
Quadrant B |
|---|---|---|---|
| Quadrant D | 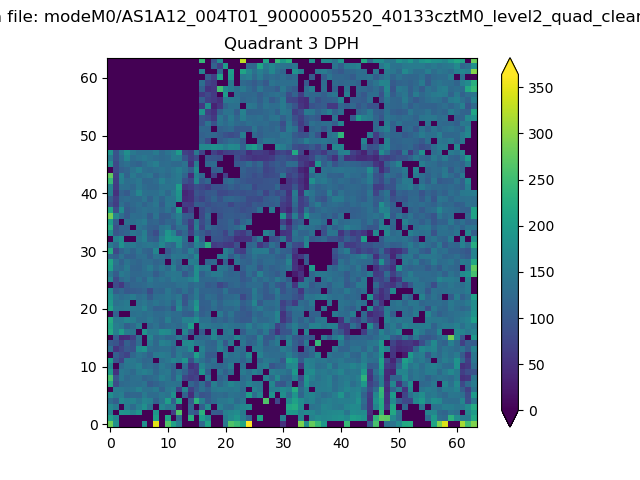 |
 |
Quadrant C |
| Plot type | Count rate plots | Images |
|---|---|---|
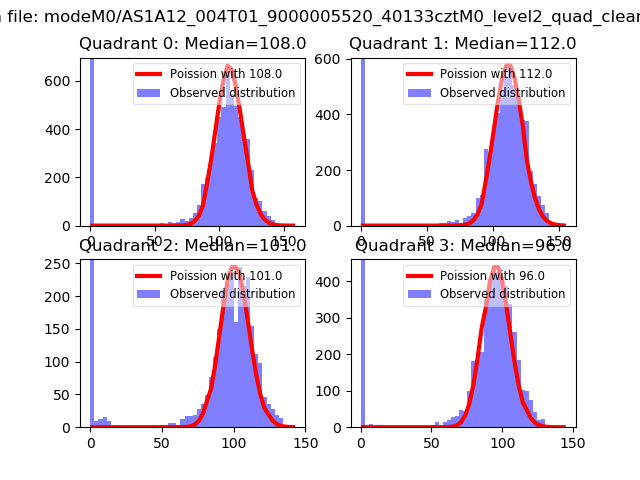
| Comparison with Poisson distribution Blue bars denote a histogram of data divided into 1 sec bins. Red curve is a Poisson curve with rate = median count rate of data. |
 |
 |
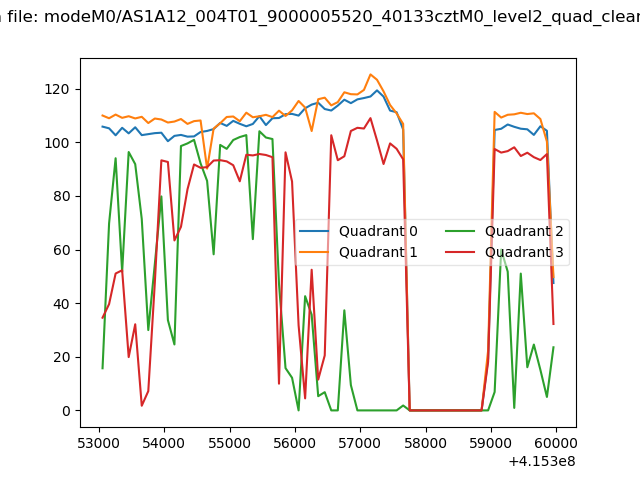
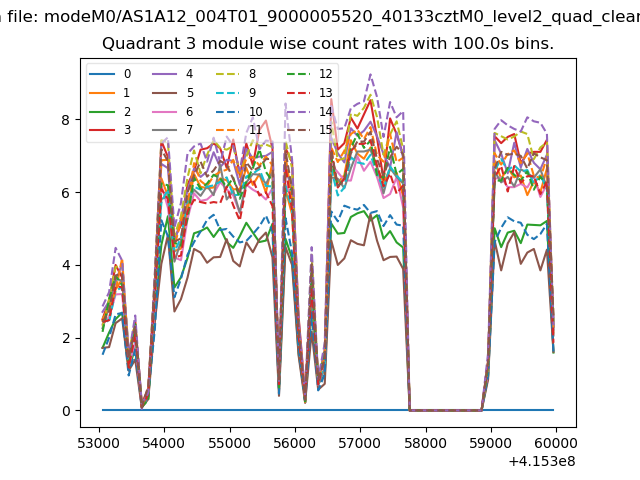
| Quadrant-wise count rates Data is divided into 100 sec bins |
 |
|
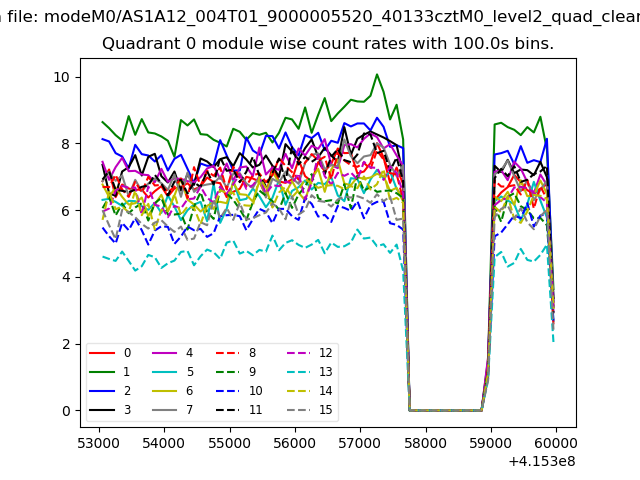
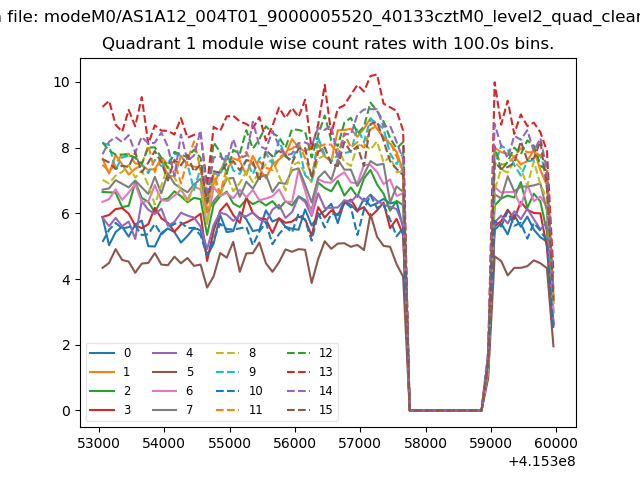
| Module-wise count rates for Quadrant A Data is divided into 100 sec bins |
 |
 |
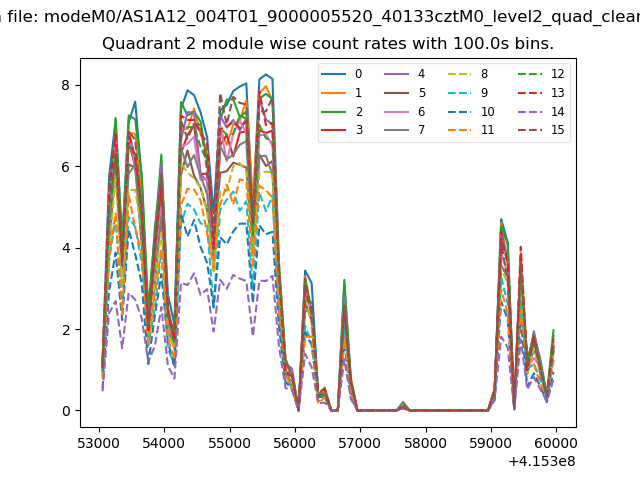
| Module-wise count rates for Quadrant B Data is divided into 100 sec bins |
 |
 |
| Module-wise count rates for Quadrant C Data is divided into 100 sec bins |
 |
 |
| Module-wise count rates for Quadrant D Data is divided into 100 sec bins |
 |
 |
| Parameter | Plot |
|---|---|
| CZT HV Monitor | 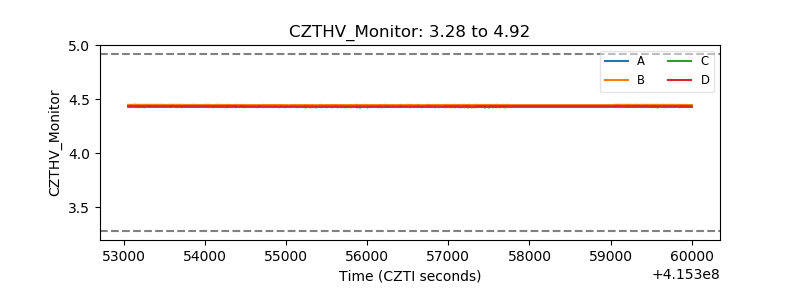 |
| D_VDD | 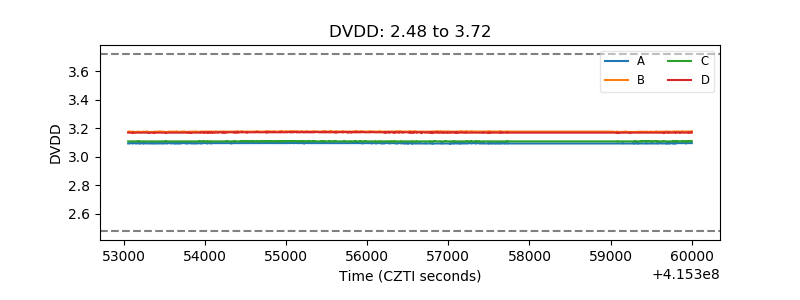 |
| Temperature 1 | 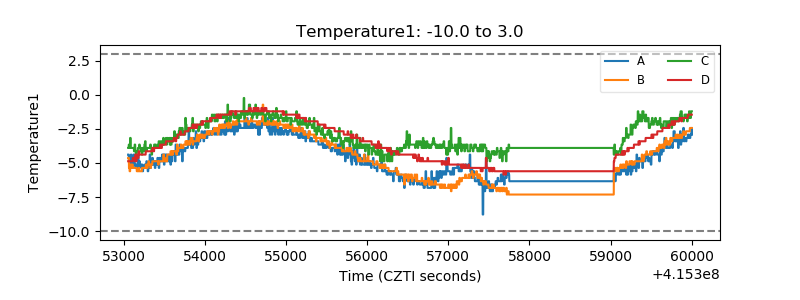 |
| Veto HV Monitor | 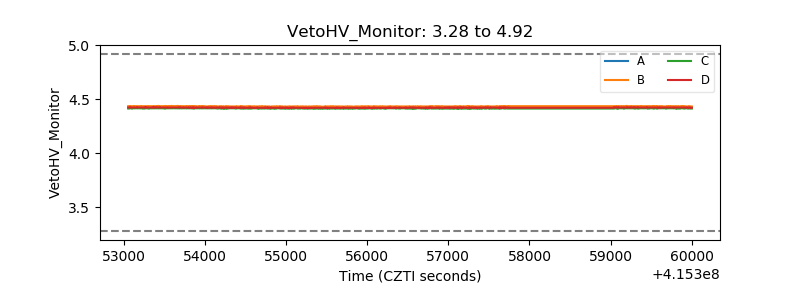 |
| Veto LLD | 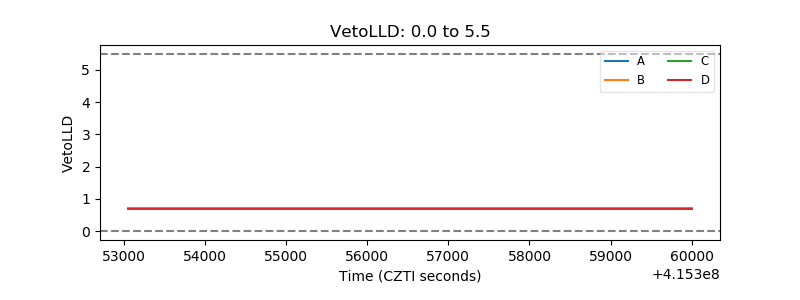 |
| Alpha Counter | 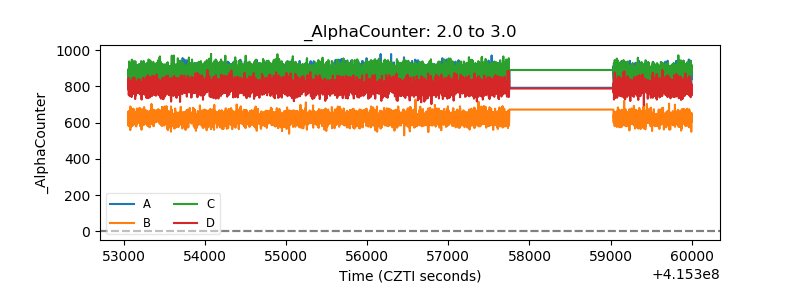 |
| _CPM_Rate | 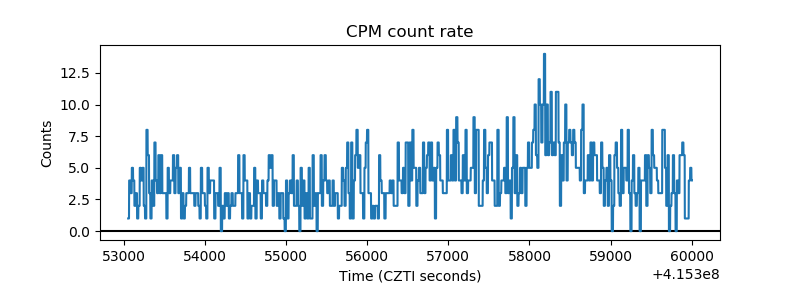 |
| CZT Counter | 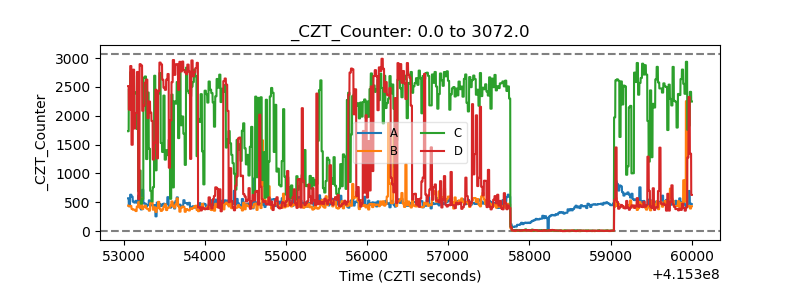 |
| +2.5 Volts monitor |  |
| +5 Volts monitor |  |
| _ROLL_ROT | 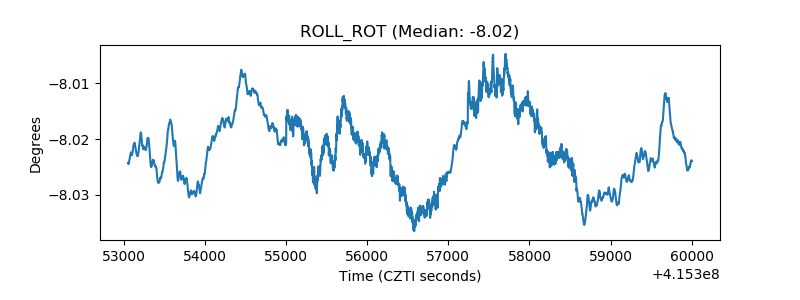 |
| _Roll_DEC | 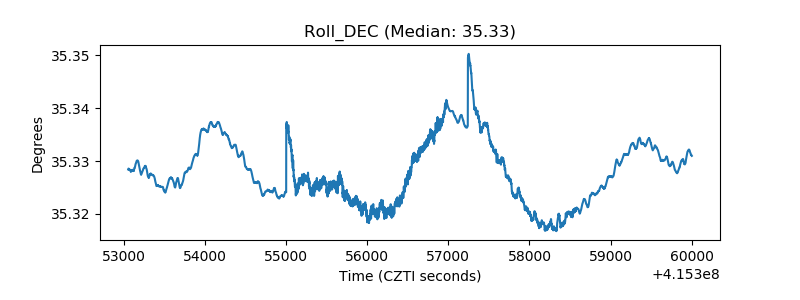 |
| _Roll_RA | 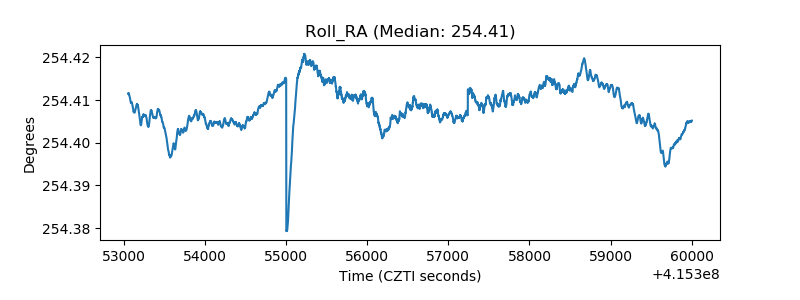 |
| Veto Counter | 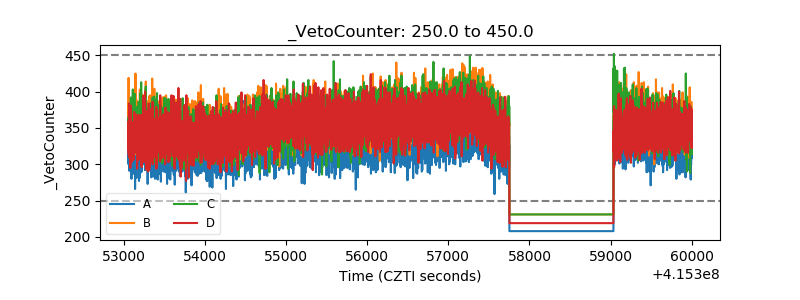 |