| Param | Original file | Final file |
|---|---|---|
| Filename | modeM0/AS1A12_004T01_9000005520_40136cztM0_level2.fits | modeM0/AS1A12_004T01_9000005520_40136cztM0_level2_quad_clean.evt |
| Size (bytes) | 1,689,264,000 | 209,413,440 |
| Size | 1.6 GB | 199.7 MB |
| Events in quadrant A | 8,473,143 | 1,673,233 |
| Events in quadrant B | 8,354,977 | 1,703,988 |
| Events in quadrant C | 35,069,312 | 397,929 |
| Events in quadrant D | 9,425,717 | 1,488,346 |
| Mode M0 | |||
|---|---|---|---|
| Quadrant | BADHDUFLAG | Total packets | Discarded packets |
| A | 0 | 34627 | 4 |
| B | 0 | 35537 | 3 |
| C | 0 | 114917 | 3 |
| D | 0 | 38927 | 3 |
| Mode M9 | |||
|---|---|---|---|
| Quadrant | BADHDUFLAG | Total packets | Discarded packets |
| A | 0 | 42 | 0 |
| B | 0 | 42 | 0 |
| C | 0 | 42 | 0 |
| D | 0 | 42 | 0 |
| Mode SS | |||
|---|---|---|---|
| Quadrant | BADHDUFLAG | Total packets | Discarded packets |
| A | 0 | 318 | 0 |
| B | 0 | 318 | 0 |
| C | 0 | 318 | 0 |
| D | 0 | 318 | 0 |
| Quadrant | Total seconds | Saturated seconds | Saturation percentage |
|---|---|---|---|
| A | 15603 | 125 | 0.801128% |
| B | 15603 | 330 | 2.114978% |
| C | 15603 | 12471 | 79.926937% |
| D | 15603 | 442 | 2.832789% |
Noise dominated data is calculated using 1-second bins in cleaned event files. If a bin has >2000 counts, and if more than 50% of those come from <1% of pixels, then it is considered to be noise-dominated and hence unusable.
| Quadrant | # 1 sec bins | Bins with >0 counts | Bins with >2000 counts | High rate bins dominated by noise | Noise dominated (total time) | Noise dominated (detector-on time) | Marked lightcurve |
|---|---|---|---|---|---|---|---|
| A | 19842 | 15606 | 106 | 106 | 0.53% | 0.68% | 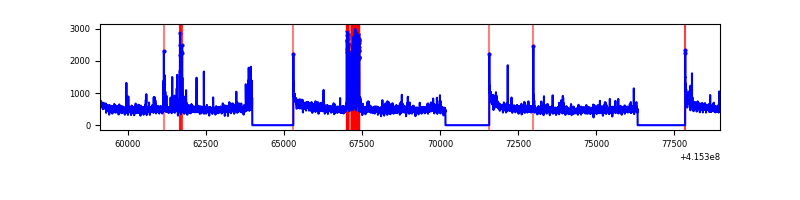 |
| B | 19842 | 15606 | 248 | 248 | 1.25% | 1.59% | 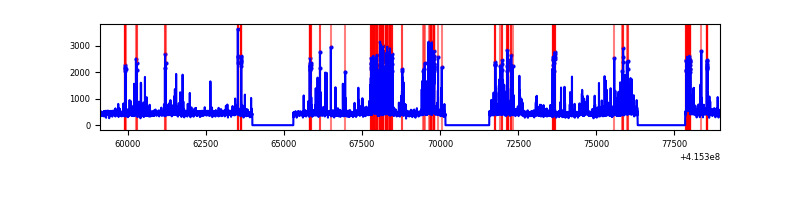 |
| C | 19841 | 15602 | 12072 | 12072 | 60.84% | 77.37% | 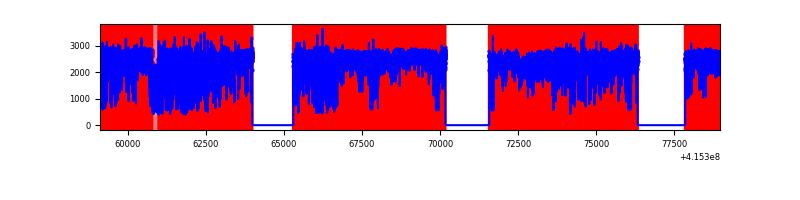 |
| D | 19842 | 15606 | 433 | 433 | 2.18% | 2.77% | 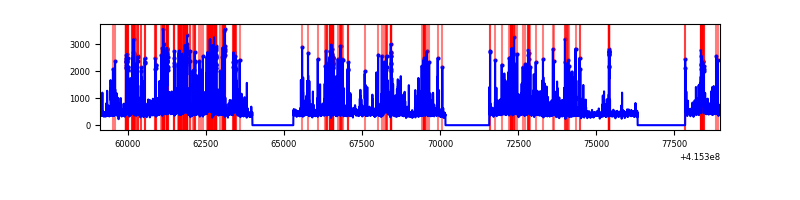 |
Top three noisy pixels from each quadrant. If the there are fewer than three noisy pixels in the level2.evt file, extra rows are filled as -1
| Pixel properties | Quadrant properties | ||||||
|---|---|---|---|---|---|---|---|
| Quadrant | DetID | PixID | Counts | Sigma | Mean | Median | Sigma |
| A | 10 | 83 | 1165043 | 3339.68 | 1708 | 1675 | 348.3 |
| A | 13 | 248 | 399007 | 1140.62 | 1708 | 1675 | 348.3 |
| A | 12 | 189 | 155226 | 440.8 | 1708 | 1675 | 348.3 |
| B | 5 | 255 | 1252309 | 3832.47 | 1695 | 1645 | 326.3 |
| B | 4 | 171 | 277283 | 844.65 | 1695 | 1645 | 326.3 |
| B | 0 | 230 | 59350 | 176.83 | 1695 | 1645 | 326.3 |
| C | 9 | 187 | 30536629 | 133893.73 | 987 | 992 | 228.1 |
| C | 15 | 214 | 392024 | 1714.61 | 987 | 992 | 228.1 |
| C | 14 | 254 | 85513 | 370.61 | 987 | 992 | 228.1 |
| D | 12 | 227 | 1045881 | 2573.53 | 1657 | 1611 | 405.8 |
| D | 13 | 249 | 604071 | 1484.72 | 1657 | 1611 | 405.8 |
| D | 2 | 249 | 478551 | 1175.38 | 1657 | 1611 | 405.8 |
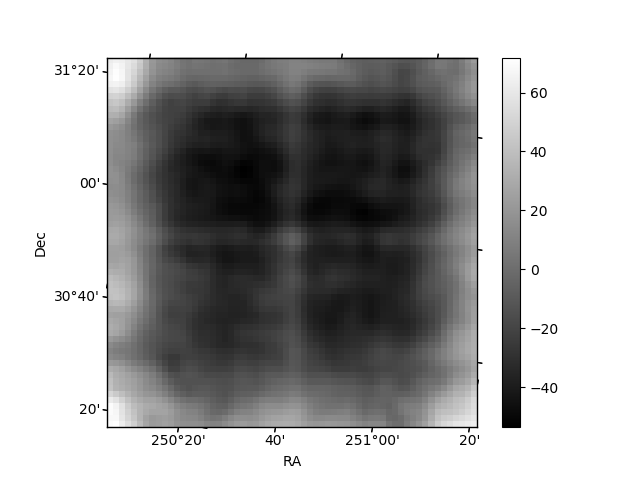
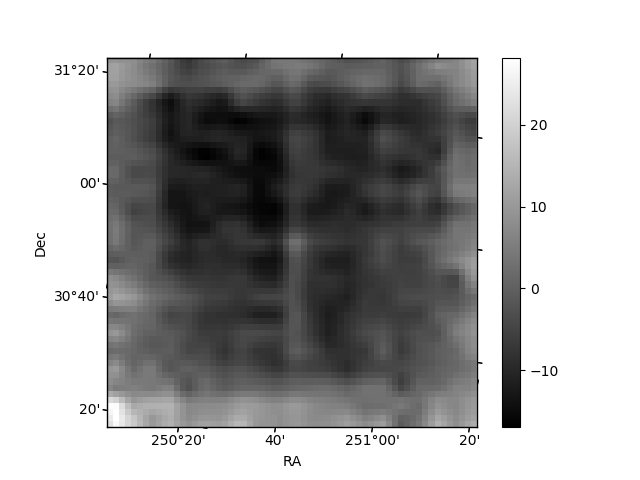
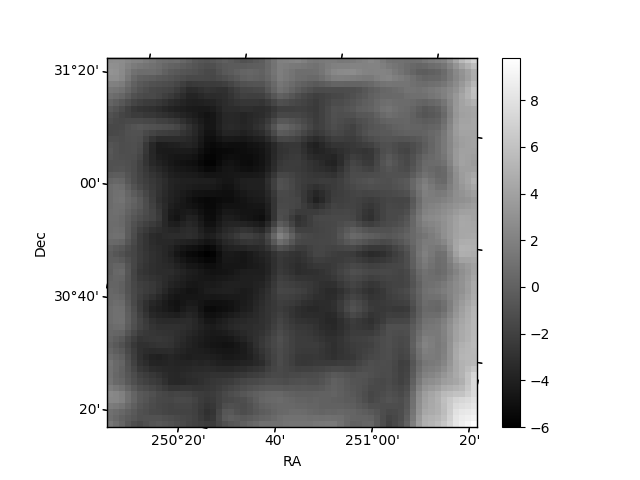
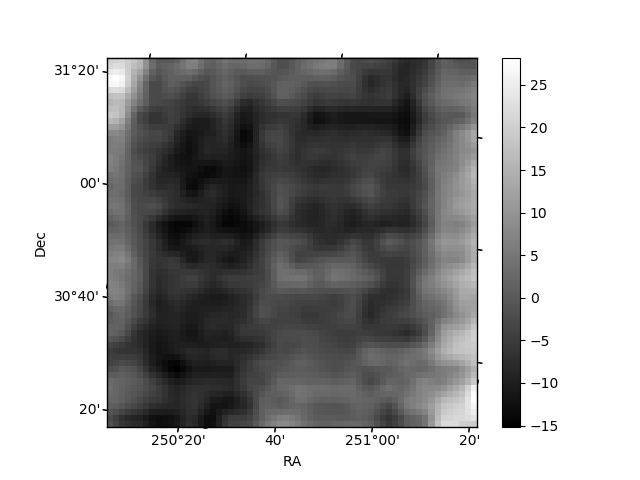
Histogram calculated using DETX and DETY for each event in the final _common_clean file
| Quadrant A | 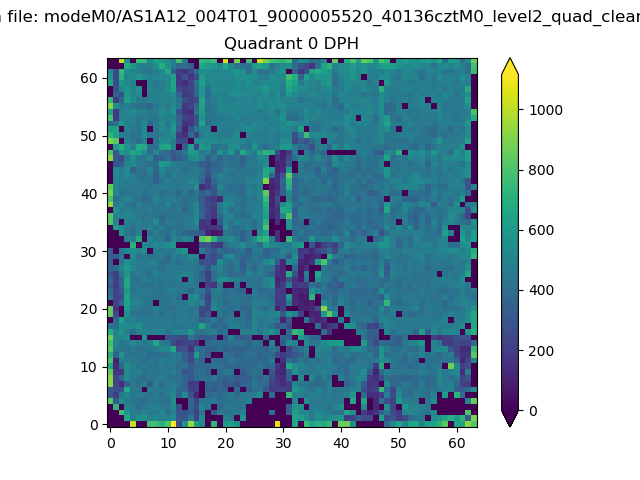 |
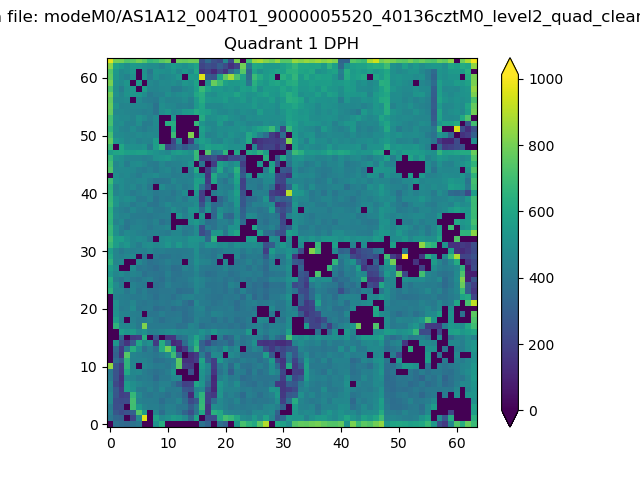 |
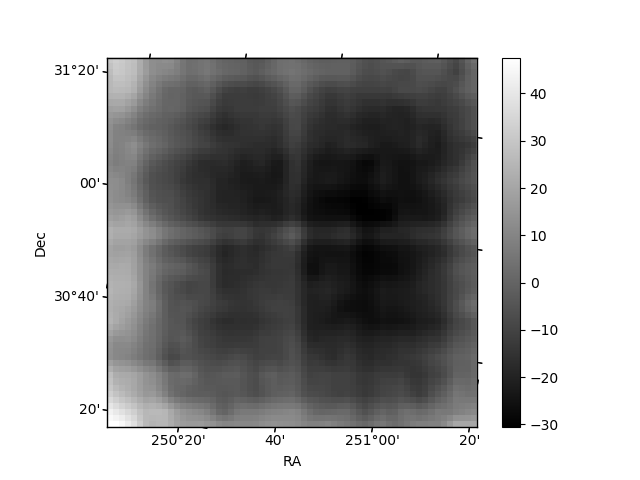
Quadrant B |
|---|---|---|---|
| Quadrant D | 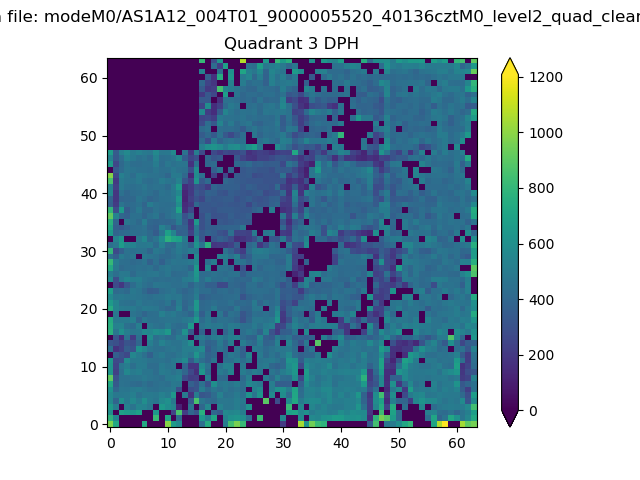 |
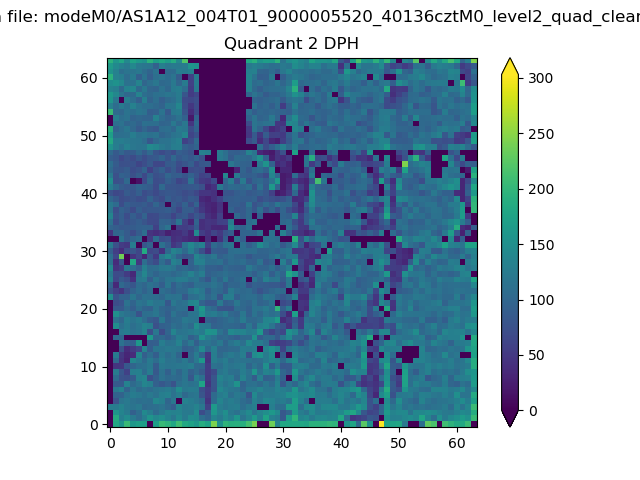 |
Quadrant C |
| Plot type | Count rate plots | Images |
|---|---|---|
| Comparison with Poisson distribution Blue bars denote a histogram of data divided into 1 sec bins. Red curve is a Poisson curve with rate = median count rate of data. |
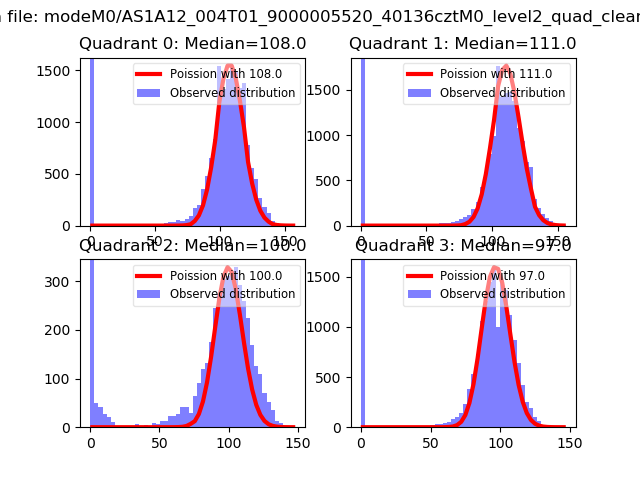 |
 |
| Quadrant-wise count rates Data is divided into 100 sec bins |
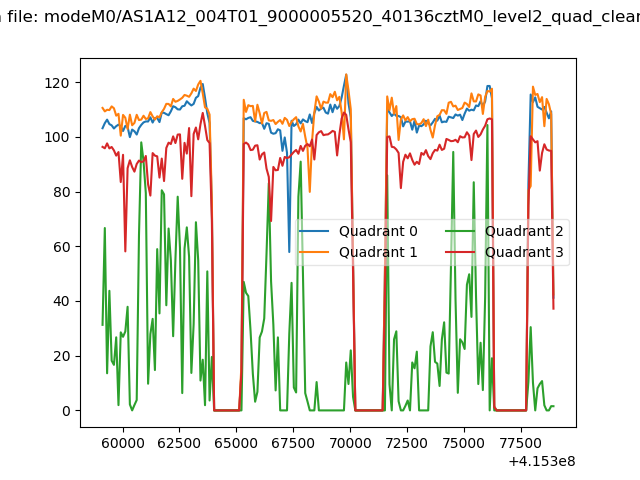 |
|
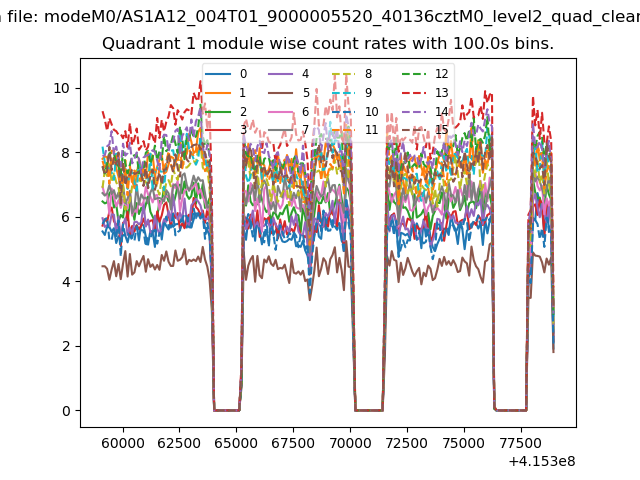
| Module-wise count rates for Quadrant A Data is divided into 100 sec bins |
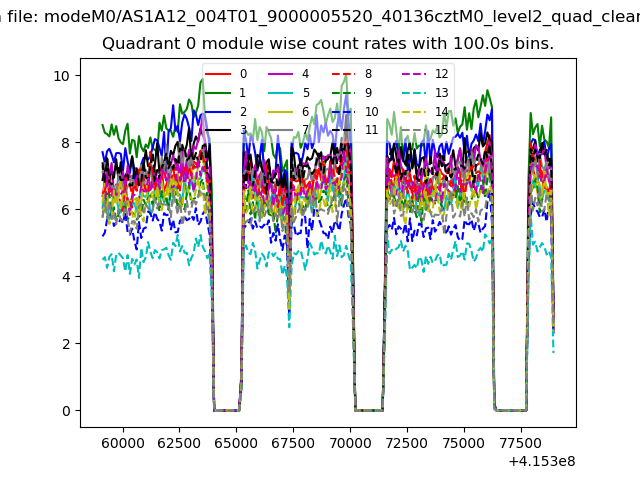 |
 |
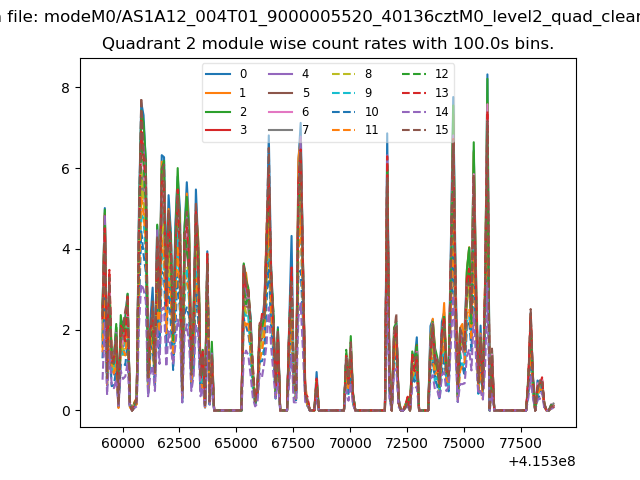
| Module-wise count rates for Quadrant B Data is divided into 100 sec bins |
 |
 |
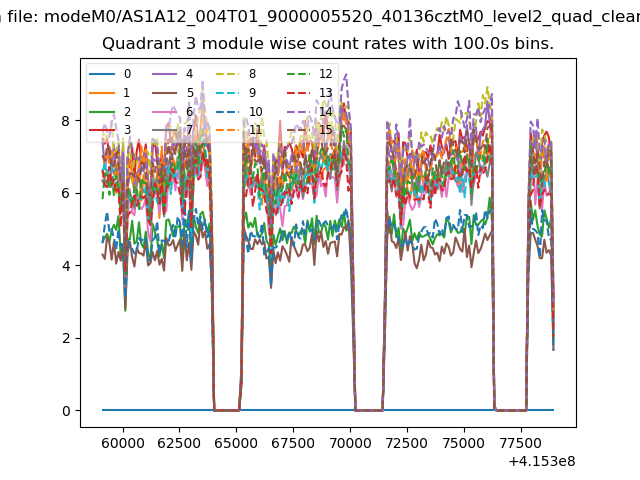
| Module-wise count rates for Quadrant C Data is divided into 100 sec bins |
 |
 |
| Module-wise count rates for Quadrant D Data is divided into 100 sec bins |
 |
 |
| Parameter | Plot |
|---|---|
| CZT HV Monitor | 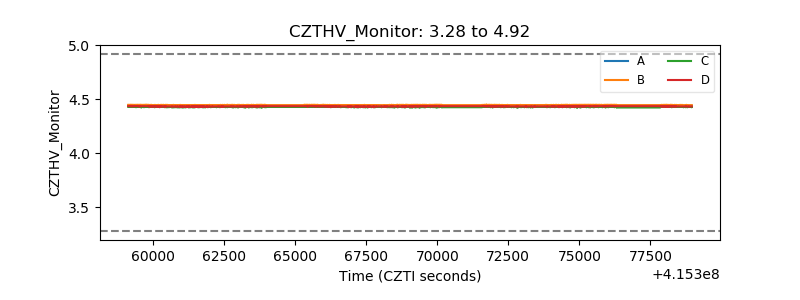 |
| D_VDD | 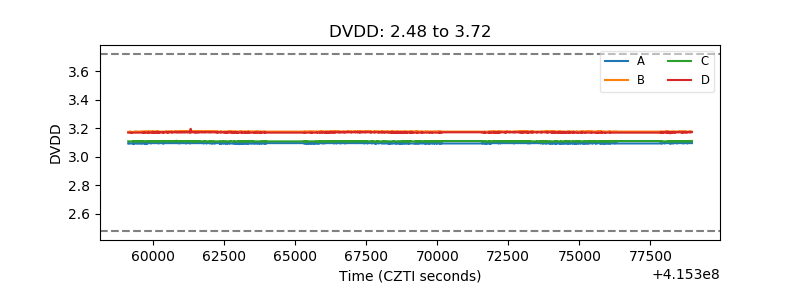 |
| Temperature 1 | 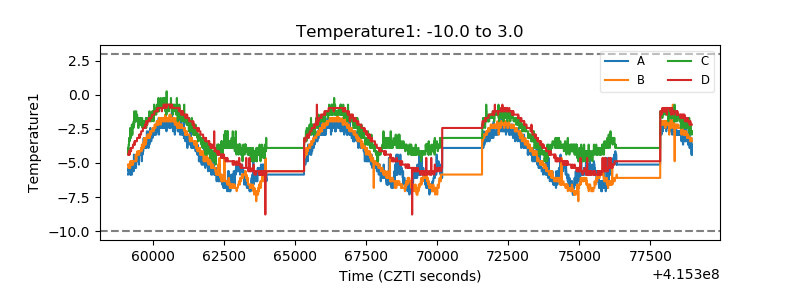 |
| Veto HV Monitor |  |
| Veto LLD | 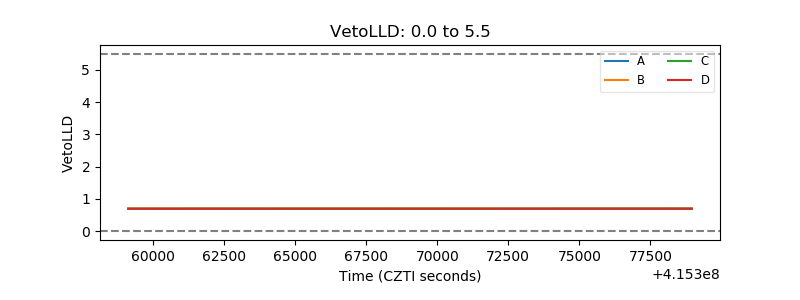 |
| Alpha Counter | 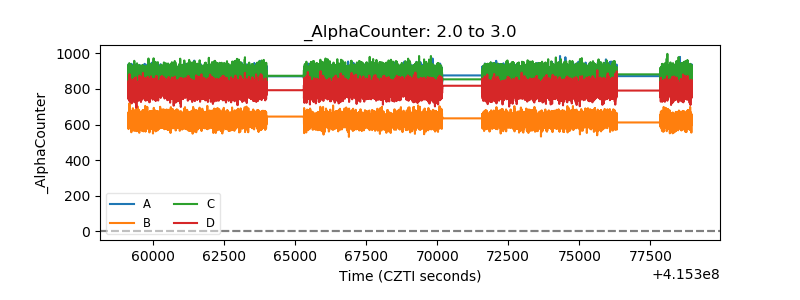 |
| _CPM_Rate | 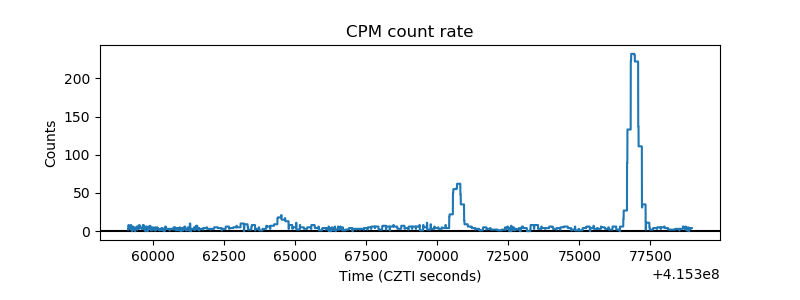 |
| CZT Counter | 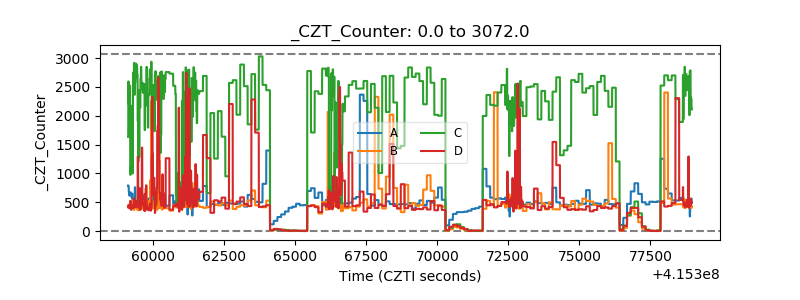 |
| +2.5 Volts monitor | 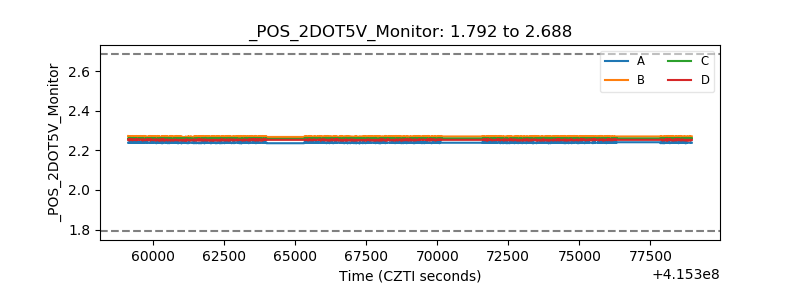 |
| +5 Volts monitor |  |
| _ROLL_ROT | 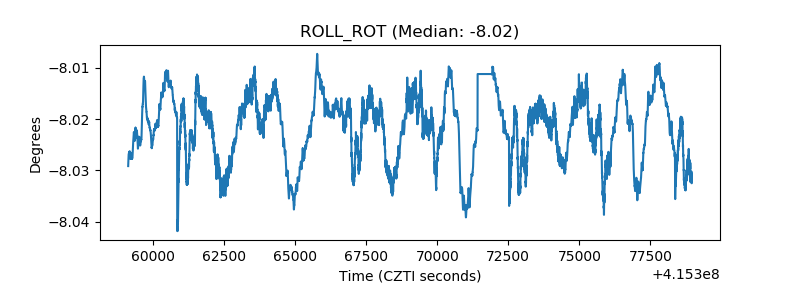 |
| _Roll_DEC | 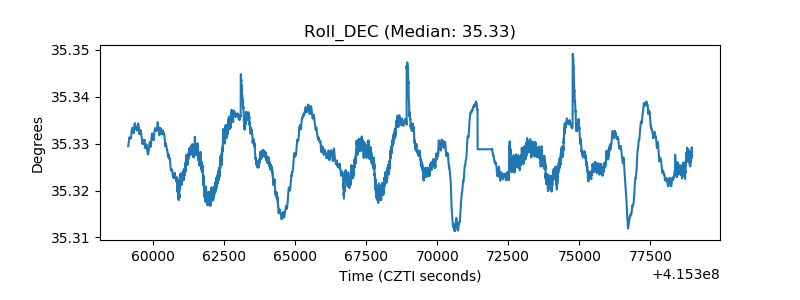 |
| _Roll_RA | 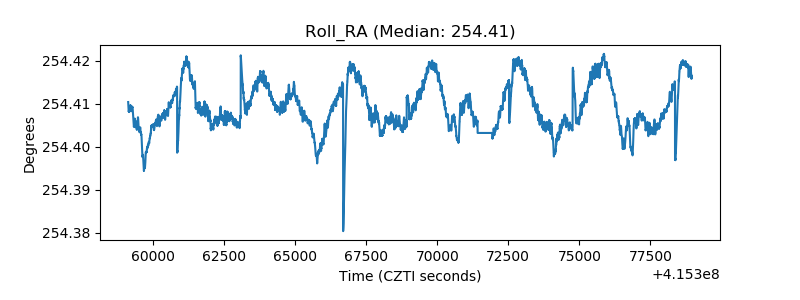 |
| Veto Counter | 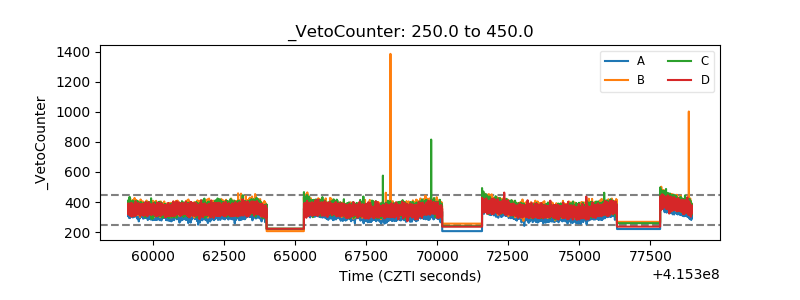 |