| Param | Original file | Final file |
|---|---|---|
| Filename | modeM0/AS1A12_004T01_9000005520_40137cztM0_level2.fits | modeM0/AS1A12_004T01_9000005520_40137cztM0_level2_quad_clean.evt |
| Size (bytes) | 657,501,120 | 73,359,360 |
| Size | 627.0 MB | 70.0 MB |
| Events in quadrant A | 4,018,052 | 565,182 |
| Events in quadrant B | 3,169,982 | 621,099 |
| Events in quadrant C | 13,609,682 | 81,022 |
| Events in quadrant D | 3,103,696 | 560,855 |
| Mode M0 | |||
|---|---|---|---|
| Quadrant | BADHDUFLAG | Total packets | Discarded packets |
| A | 0 | 15467 | 3 |
| B | 0 | 13290 | 2 |
| C | 0 | 44301 | 2 |
| D | 0 | 13153 | 2 |
| Mode M9 | |||
|---|---|---|---|
| Quadrant | BADHDUFLAG | Total packets | Discarded packets |
| A | 0 | 20 | 0 |
| B | 0 | 20 | 0 |
| C | 0 | 20 | 0 |
| D | 0 | 21 | 0 |
| Mode SS | |||
|---|---|---|---|
| Quadrant | BADHDUFLAG | Total packets | Discarded packets |
| A | 0 | 114 | 0 |
| B | 0 | 114 | 0 |
| C | 0 | 114 | 0 |
| D | 0 | 114 | 0 |
| Quadrant | Total seconds | Saturated seconds | Saturation percentage |
|---|---|---|---|
| A | 5616 | 525 | 9.348291% |
| B | 5616 | 202 | 3.596866% |
| C | 5616 | 5035 | 89.654558% |
| D | 5616 | 65 | 1.157407% |
Noise dominated data is calculated using 1-second bins in cleaned event files. If a bin has >2000 counts, and if more than 50% of those come from <1% of pixels, then it is considered to be noise-dominated and hence unusable.
| Quadrant | # 1 sec bins | Bins with >0 counts | Bins with >2000 counts | High rate bins dominated by noise | Noise dominated (total time) | Noise dominated (detector-on time) | Marked lightcurve |
|---|---|---|---|---|---|---|---|
| A | 7289 | 5617 | 449 | 449 | 6.16% | 7.99% | 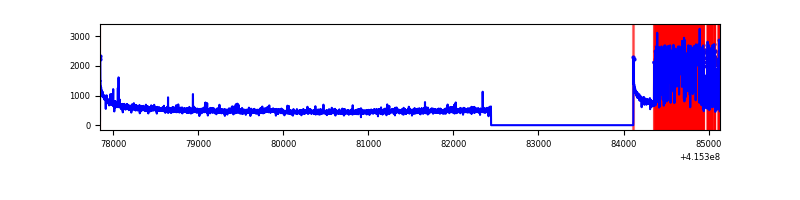 |
| B | 7289 | 5617 | 151 | 151 | 2.07% | 2.69% | 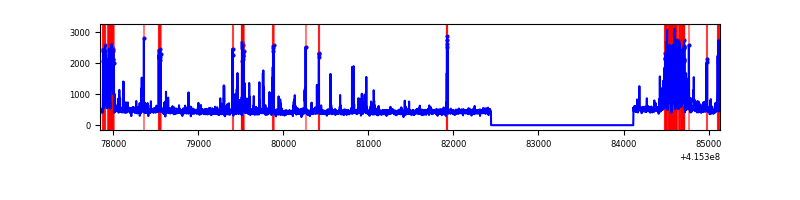 |
| C | 7289 | 5616 | 4934 | 4934 | 67.69% | 87.86% | 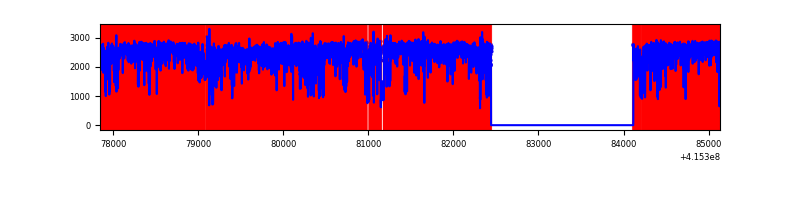 |
| D | 7289 | 5617 | 61 | 61 | 0.84% | 1.09% | 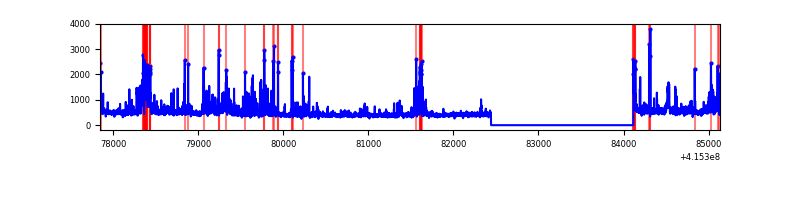 |
Top three noisy pixels from each quadrant. If the there are fewer than three noisy pixels in the level2.evt file, extra rows are filled as -1
| Pixel properties | Quadrant properties | ||||||
|---|---|---|---|---|---|---|---|
| Quadrant | DetID | PixID | Counts | Sigma | Mean | Median | Sigma |
| A | 13 | 248 | 1158636 | 9510.73 | 593 | 581 | 121.8 |
| A | 10 | 83 | 472989 | 3879.73 | 593 | 581 | 121.8 |
| A | 12 | 189 | 49525 | 401.96 | 593 | 581 | 121.8 |
| B | 5 | 255 | 300252 | 2499.81 | 614 | 598 | 119.9 |
| B | 0 | 186 | 274173 | 2282.25 | 614 | 598 | 119.9 |
| B | 4 | 171 | 116145 | 963.93 | 614 | 598 | 119.9 |
| C | 9 | 187 | 12220471 | 170178.96 | 305 | 307 | 71.8 |
| C | 15 | 214 | 123502 | 1715.62 | 305 | 307 | 71.8 |
| C | 0 | 10 | 26919 | 370.6 | 305 | 307 | 71.8 |
| D | 12 | 227 | 190836 | 1284.22 | 608 | 590 | 148.1 |
| D | 13 | 249 | 110130 | 739.43 | 608 | 590 | 148.1 |
| D | 12 | 217 | 101018 | 677.92 | 608 | 590 | 148.1 |
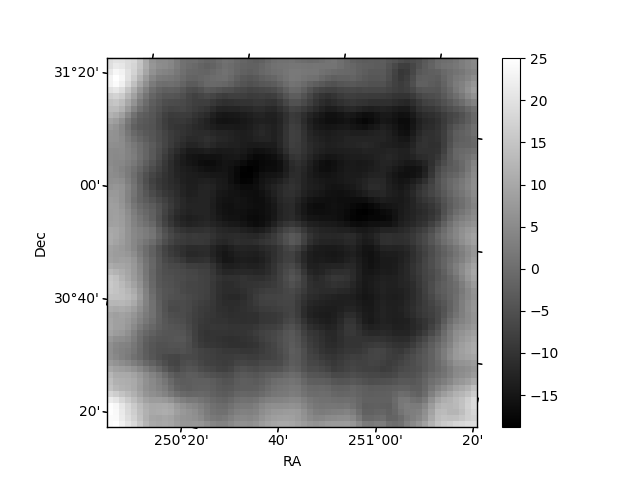
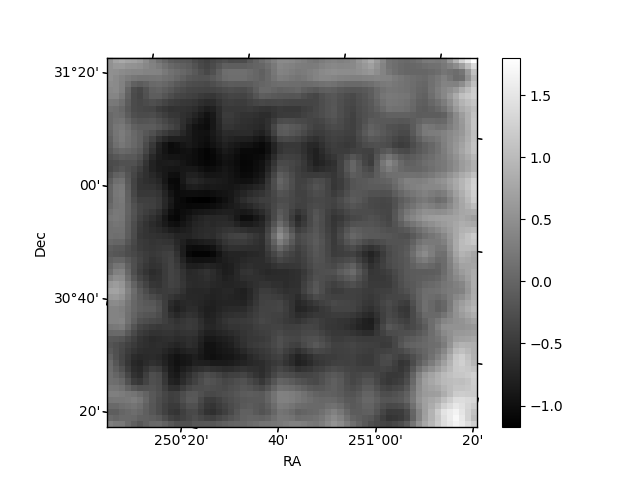
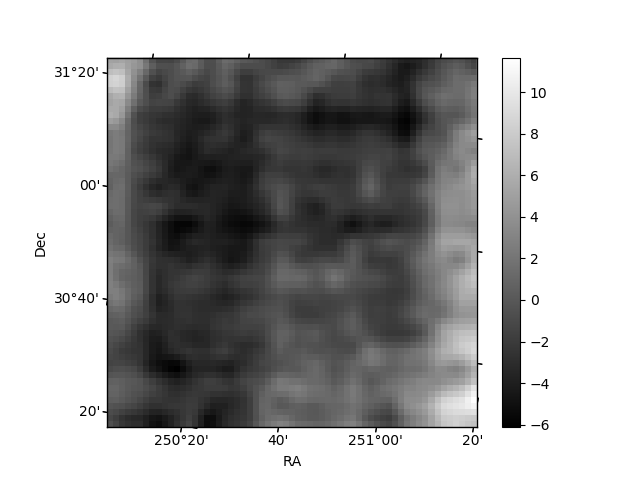
Histogram calculated using DETX and DETY for each event in the final _common_clean file
| Quadrant A | 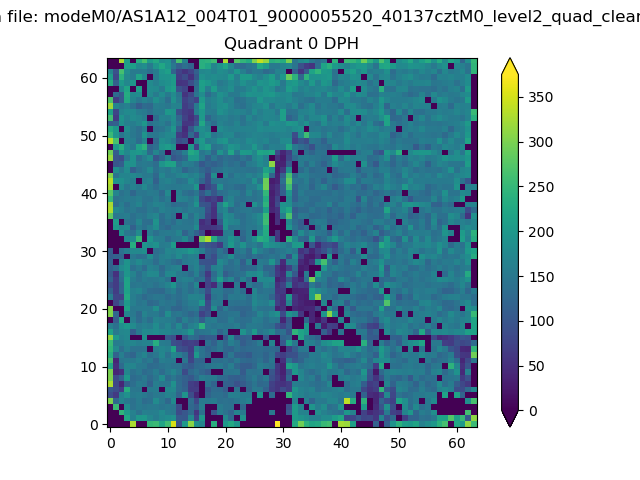 |
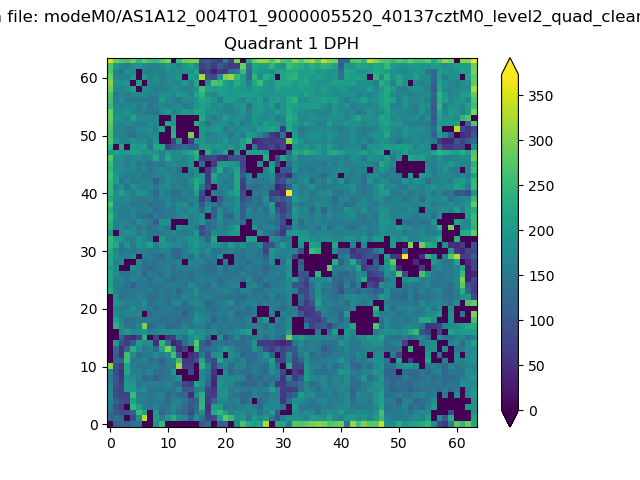 |
Quadrant B |
|---|---|---|---|
| Quadrant D | 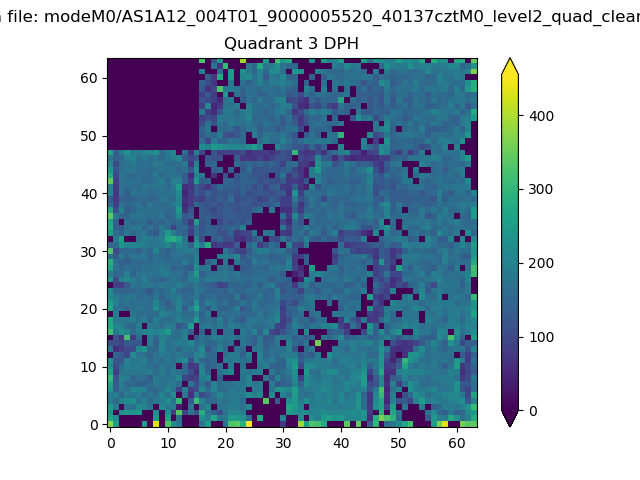 |
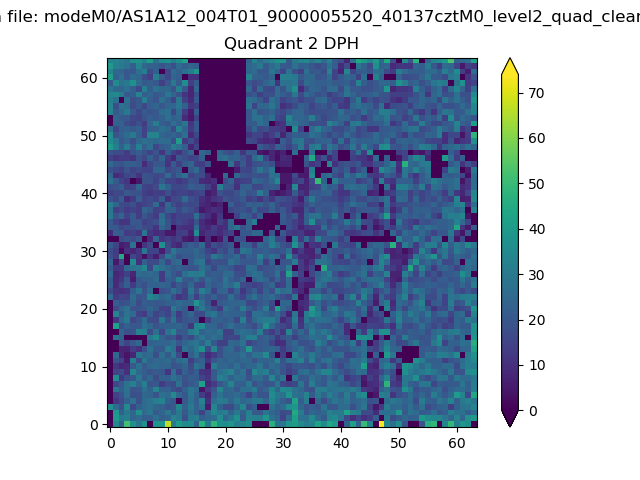 |
Quadrant C |
| Plot type | Count rate plots | Images |
|---|---|---|
| Comparison with Poisson distribution Blue bars denote a histogram of data divided into 1 sec bins. Red curve is a Poisson curve with rate = median count rate of data. |
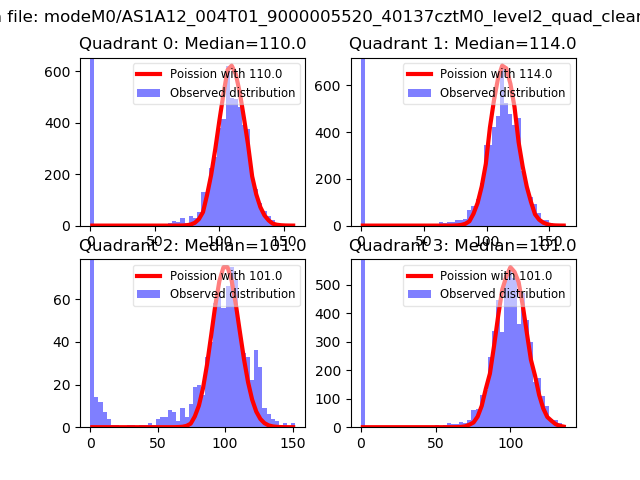 |
 |
| Quadrant-wise count rates Data is divided into 100 sec bins |
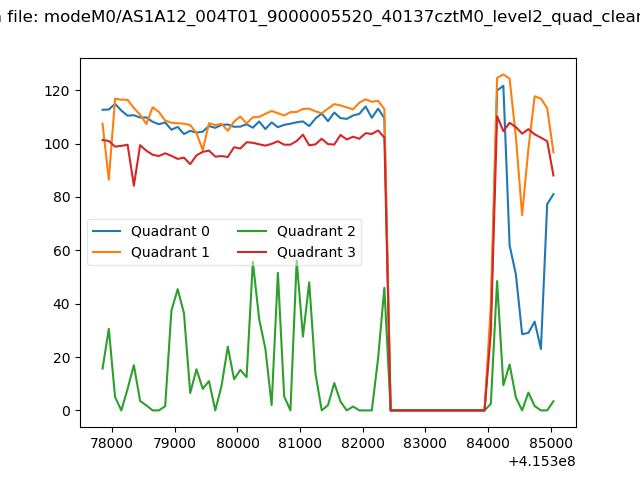 |
|
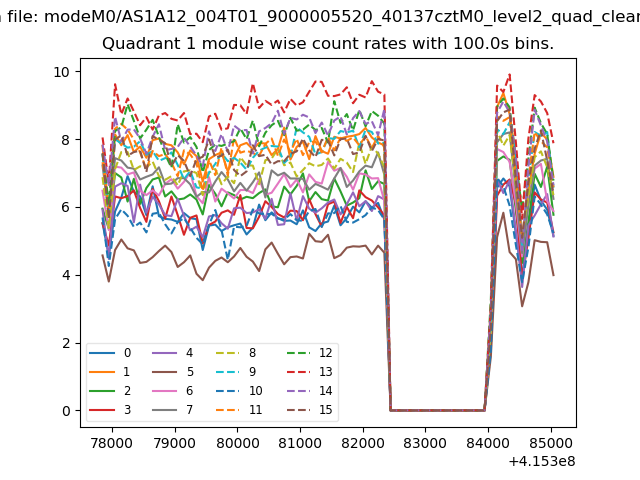
| Module-wise count rates for Quadrant A Data is divided into 100 sec bins |
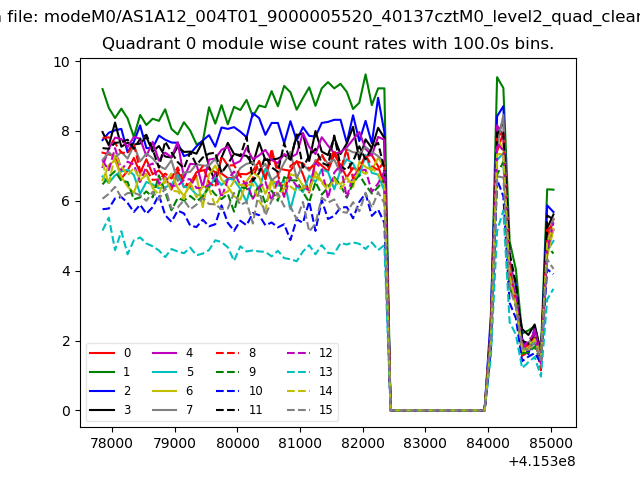 |
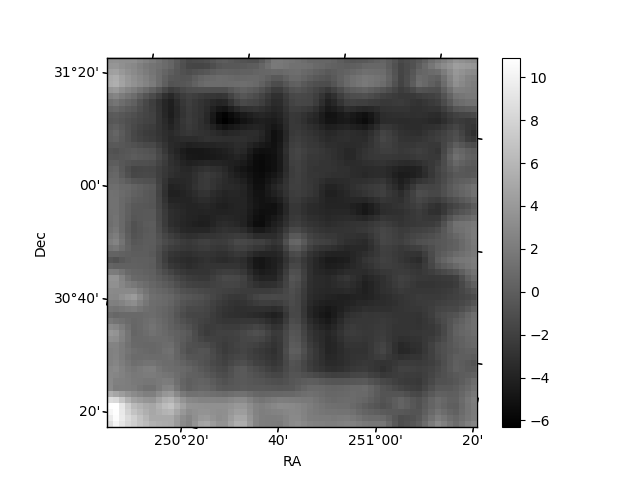 |
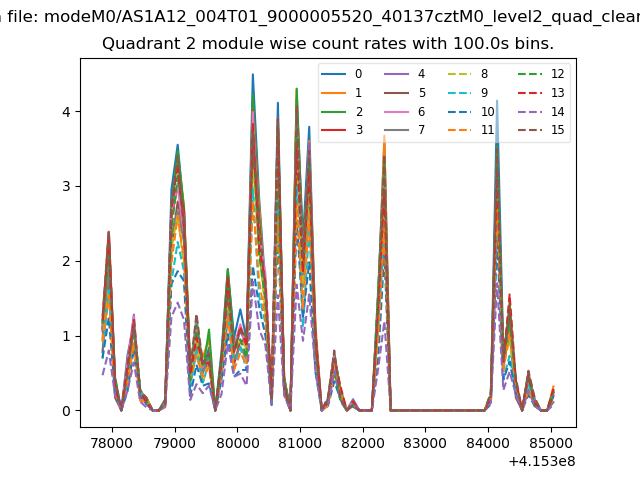
| Module-wise count rates for Quadrant B Data is divided into 100 sec bins |
 |
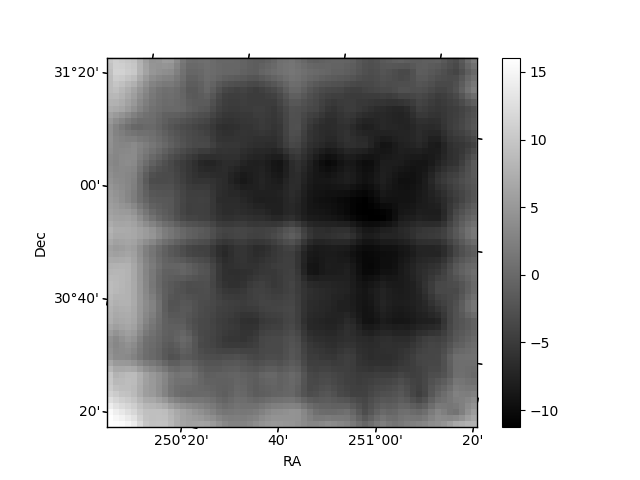 |
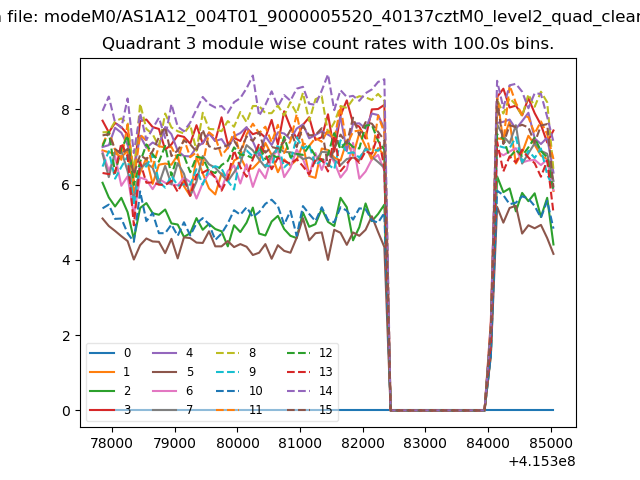
| Module-wise count rates for Quadrant C Data is divided into 100 sec bins |
 |
 |
| Module-wise count rates for Quadrant D Data is divided into 100 sec bins |
 |
 |
| Parameter | Plot |
|---|---|
| CZT HV Monitor | 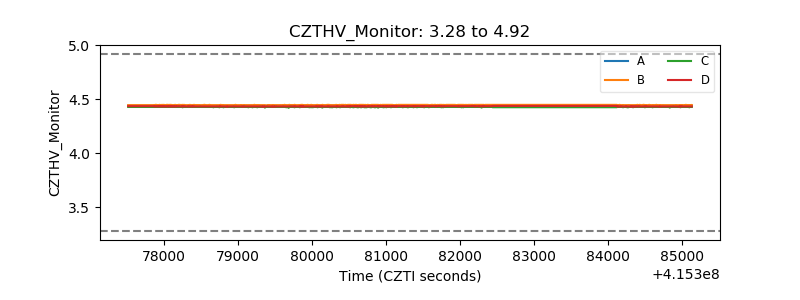 |
| D_VDD | 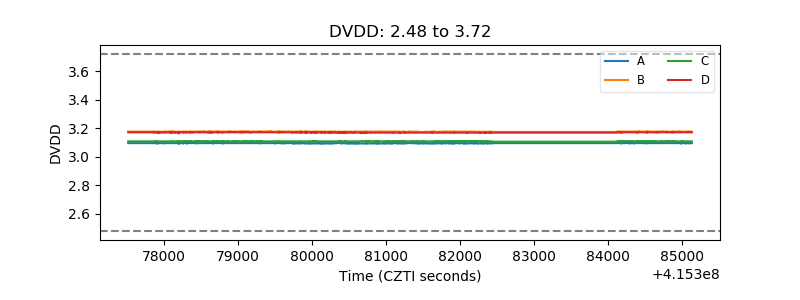 |
| Temperature 1 | 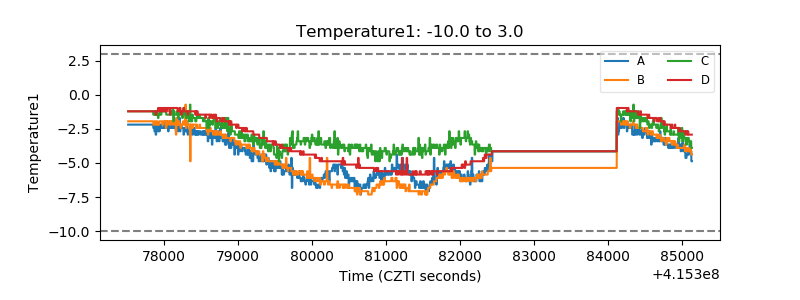 |
| Veto HV Monitor | 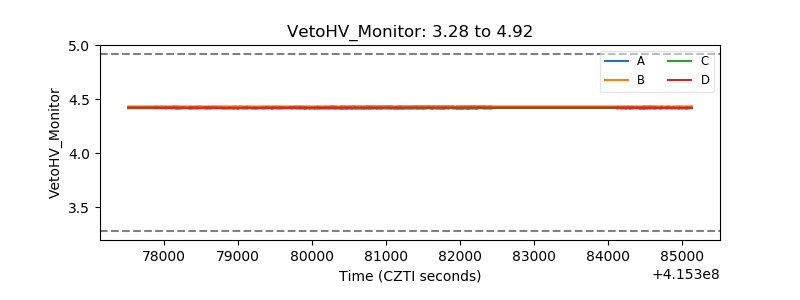 |
| Veto LLD |  |
| Alpha Counter | 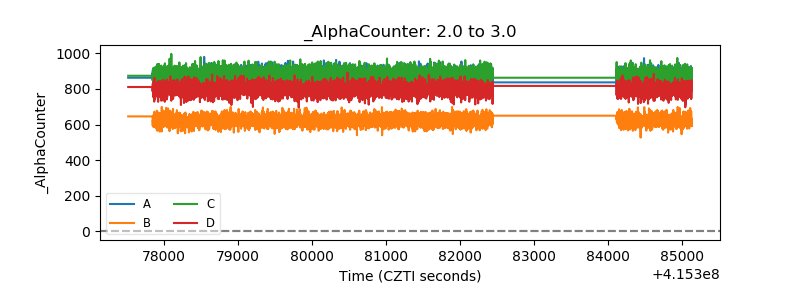 |
| _CPM_Rate | 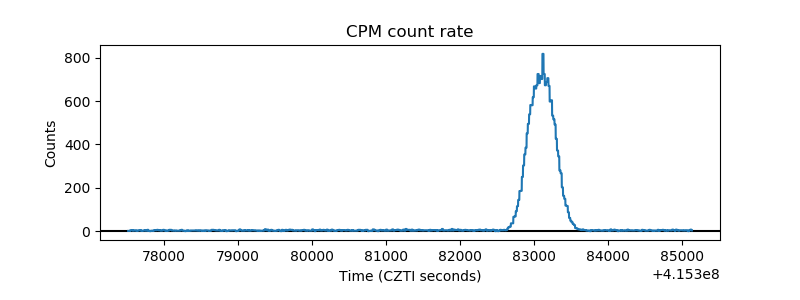 |
| CZT Counter | 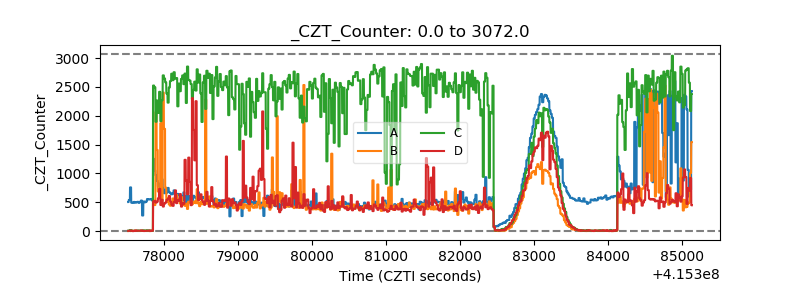 |
| +2.5 Volts monitor | 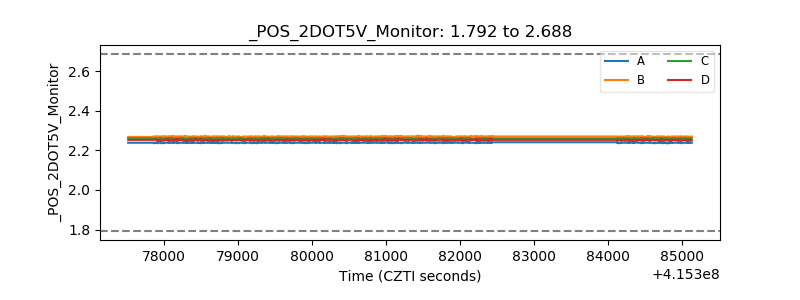 |
| +5 Volts monitor |  |
| _ROLL_ROT | 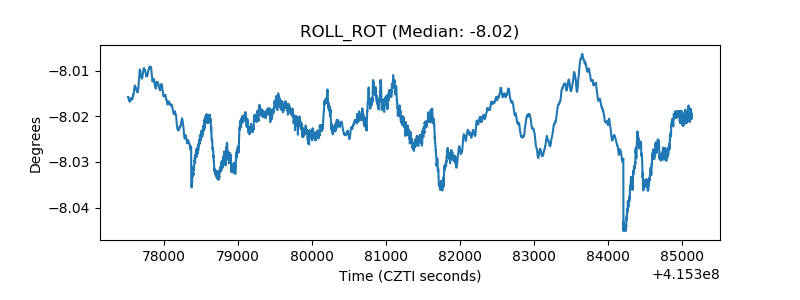 |
| _Roll_DEC | 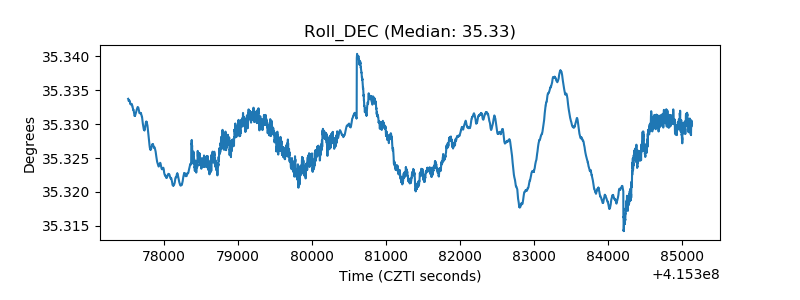 |
| _Roll_RA | 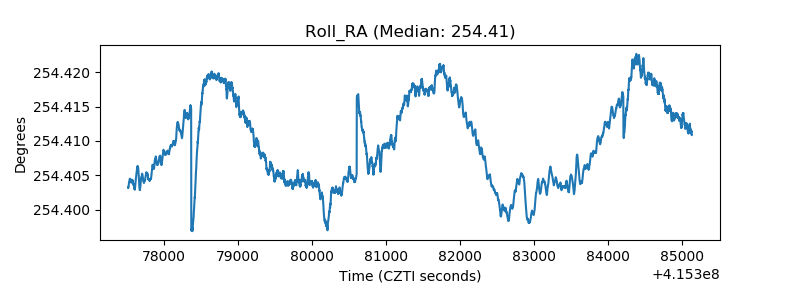 |
| Veto Counter | 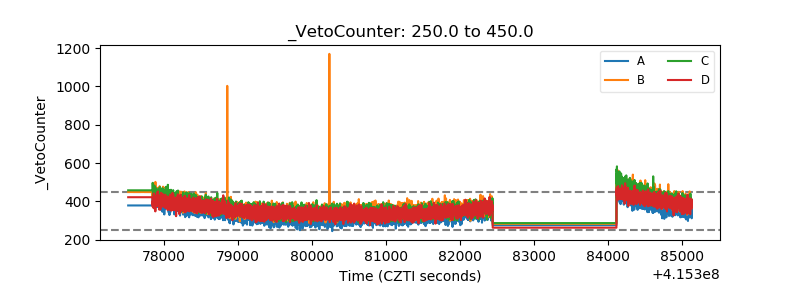 |