| Param | Original file | Final file |
|---|---|---|
| Filename | modeM0/AS1A12_004T01_9000005520_40139cztM0_level2.fits | modeM0/AS1A12_004T01_9000005520_40139cztM0_level2_quad_clean.evt |
| Size (bytes) | 632,125,440 | 69,681,600 |
| Size | 602.8 MB | 66.5 MB |
| Events in quadrant A | 4,262,918 | 531,682 |
| Events in quadrant B | 3,168,650 | 592,787 |
| Events in quadrant C | 12,841,628 | 75,652 |
| Events in quadrant D | 2,718,990 | 543,347 |
| Mode M0 | |||
|---|---|---|---|
| Quadrant | BADHDUFLAG | Total packets | Discarded packets |
| A | 0 | 16009 | 3 |
| B | 0 | 13134 | 2 |
| C | 0 | 41862 | 2 |
| D | 0 | 11817 | 2 |
| Mode M9 | |||
|---|---|---|---|
| Quadrant | BADHDUFLAG | Total packets | Discarded packets |
| A | 0 | 18 | 0 |
| B | 0 | 18 | 0 |
| C | 0 | 18 | 0 |
| D | 0 | 18 | 0 |
| Mode SS | |||
|---|---|---|---|
| Quadrant | BADHDUFLAG | Total packets | Discarded packets |
| A | 0 | 106 | 0 |
| B | 0 | 106 | 0 |
| C | 0 | 106 | 0 |
| D | 0 | 106 | 0 |
| Quadrant | Total seconds | Saturated seconds | Saturation percentage |
|---|---|---|---|
| A | 5231 | 628 | 12.005353% |
| B | 5231 | 269 | 5.142420% |
| C | 5231 | 4684 | 89.543108% |
| D | 5231 | 48 | 0.917607% |
Noise dominated data is calculated using 1-second bins in cleaned event files. If a bin has >2000 counts, and if more than 50% of those come from <1% of pixels, then it is considered to be noise-dominated and hence unusable.
| Quadrant | # 1 sec bins | Bins with >0 counts | Bins with >2000 counts | High rate bins dominated by noise | Noise dominated (total time) | Noise dominated (detector-on time) | Marked lightcurve |
|---|---|---|---|---|---|---|---|
| A | 7024 | 5232 | 544 | 544 | 7.74% | 10.40% | 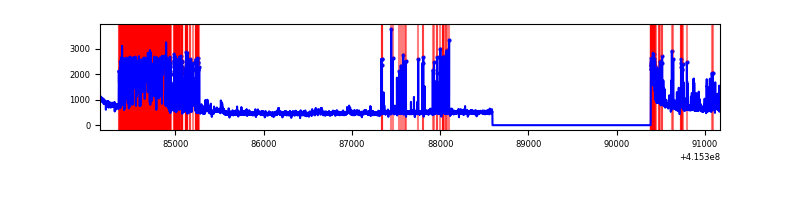 |
| B | 7024 | 5232 | 199 | 199 | 2.83% | 3.80% | 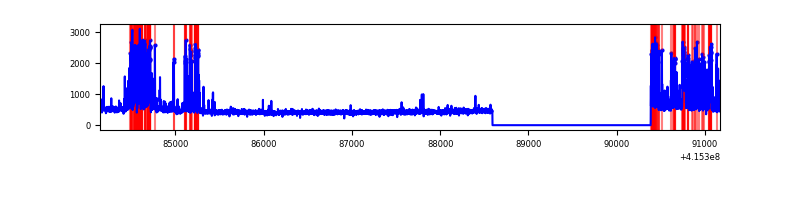 |
| C | 7023 | 5230 | 4606 | 4606 | 65.58% | 88.07% | 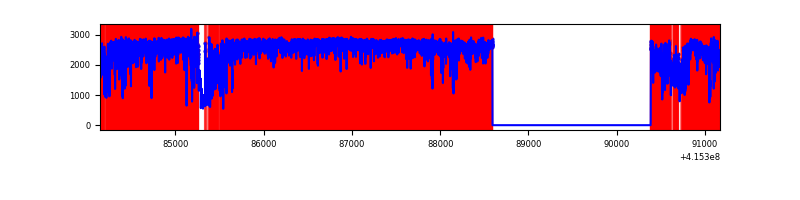 |
| D | 7024 | 5232 | 40 | 40 | 0.57% | 0.76% | 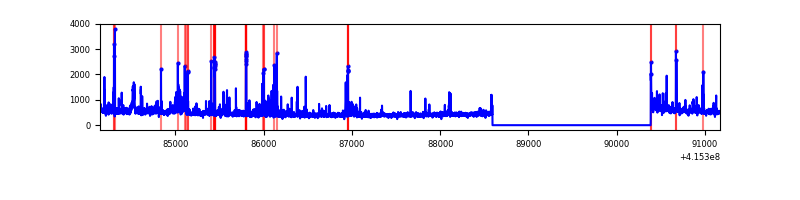 |
Top three noisy pixels from each quadrant. If the there are fewer than three noisy pixels in the level2.evt file, extra rows are filled as -1
| Pixel properties | Quadrant properties | ||||||
|---|---|---|---|---|---|---|---|
| Quadrant | DetID | PixID | Counts | Sigma | Mean | Median | Sigma |
| A | 13 | 248 | 1419345 | 12599.2 | 550 | 539 | 112.6 |
| A | 10 | 83 | 413672 | 3668.68 | 550 | 539 | 112.6 |
| A | 6 | 10 | 159585 | 1412.35 | 550 | 539 | 112.6 |
| B | 0 | 186 | 359370 | 3228.08 | 575 | 559 | 111.2 |
| B | 4 | 171 | 256093 | 2298.94 | 575 | 559 | 111.2 |
| B | 5 | 172 | 160913 | 1442.64 | 575 | 559 | 111.2 |
| C | 9 | 187 | 11613166 | 185737.63 | 264 | 266 | 62.5 |
| C | 15 | 214 | 106761 | 1703.29 | 264 | 266 | 62.5 |
| C | 0 | 10 | 51258 | 815.57 | 264 | 266 | 62.5 |
| D | 13 | 249 | 118251 | 839.28 | 573 | 557 | 140.2 |
| D | 1 | 52 | 66528 | 470.44 | 573 | 557 | 140.2 |
| D | 12 | 233 | 66503 | 470.26 | 573 | 557 | 140.2 |
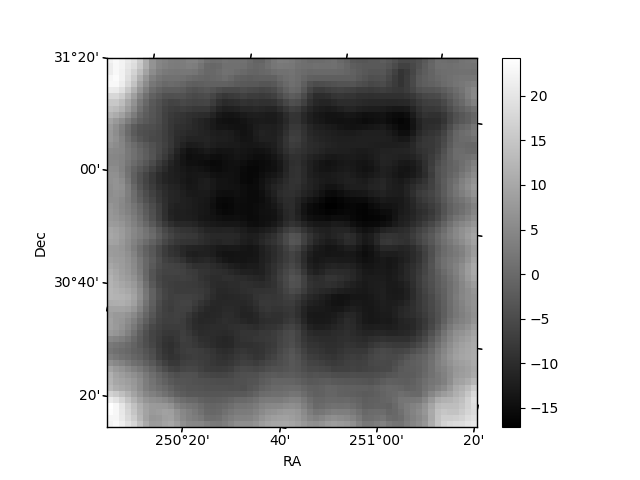
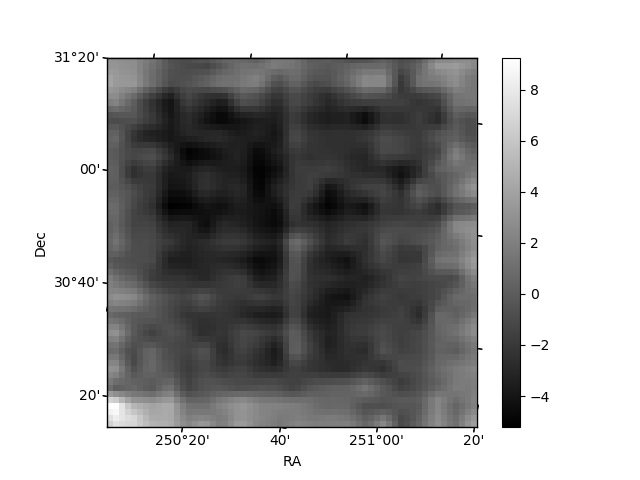
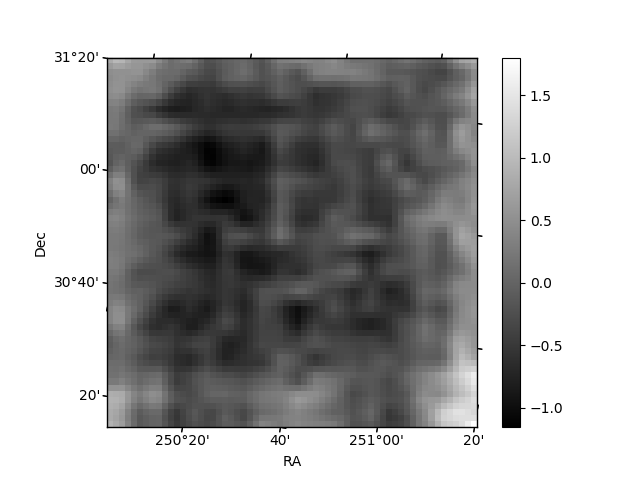
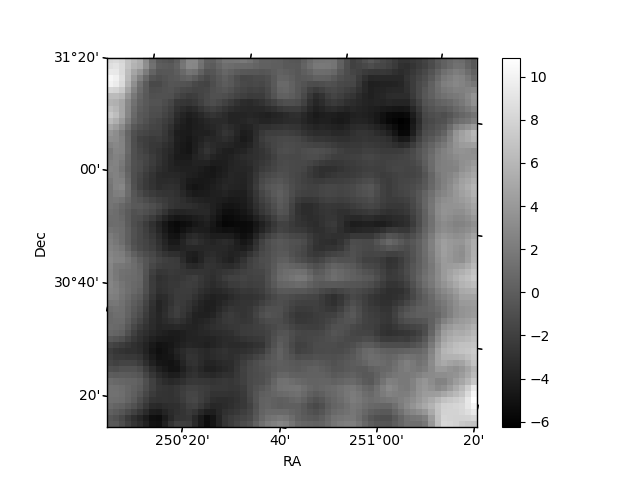
Histogram calculated using DETX and DETY for each event in the final _common_clean file
| Quadrant A | 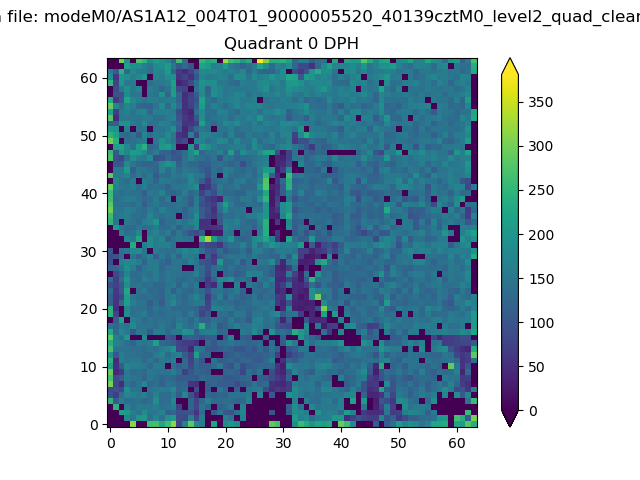 |
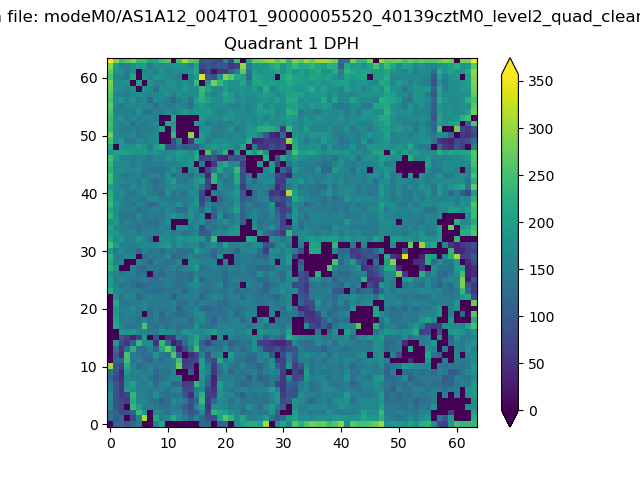 |
Quadrant B |
|---|---|---|---|
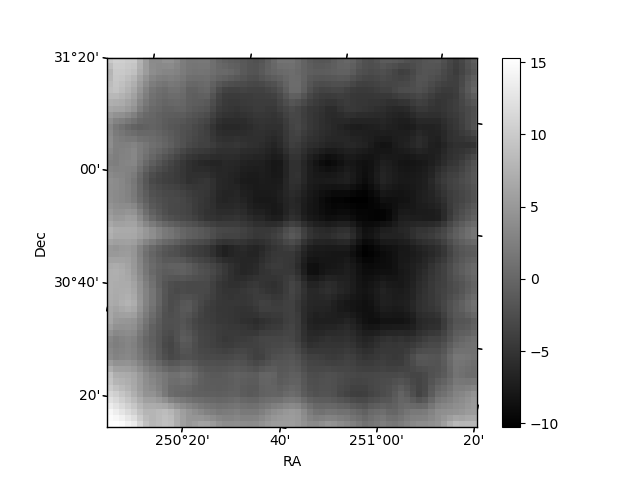
| Quadrant D | 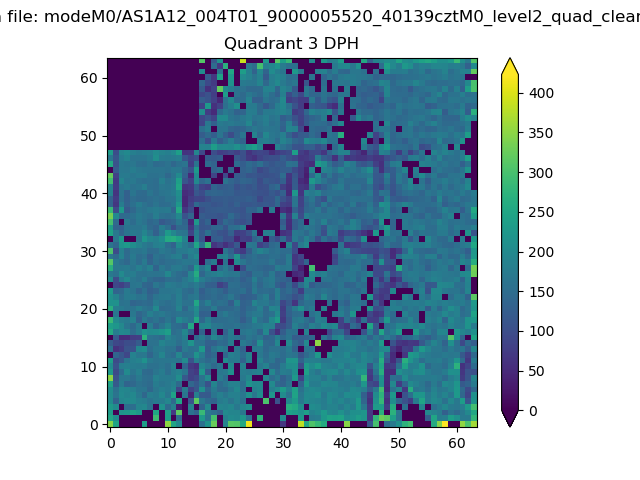 |
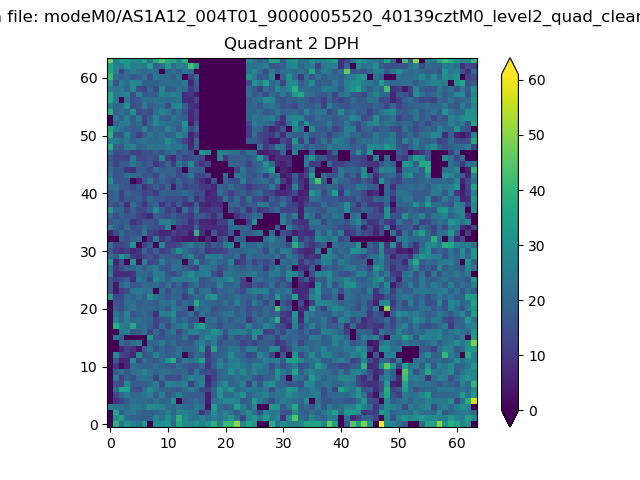 |
Quadrant C |
| Plot type | Count rate plots | Images |
|---|---|---|
| Comparison with Poisson distribution Blue bars denote a histogram of data divided into 1 sec bins. Red curve is a Poisson curve with rate = median count rate of data. |
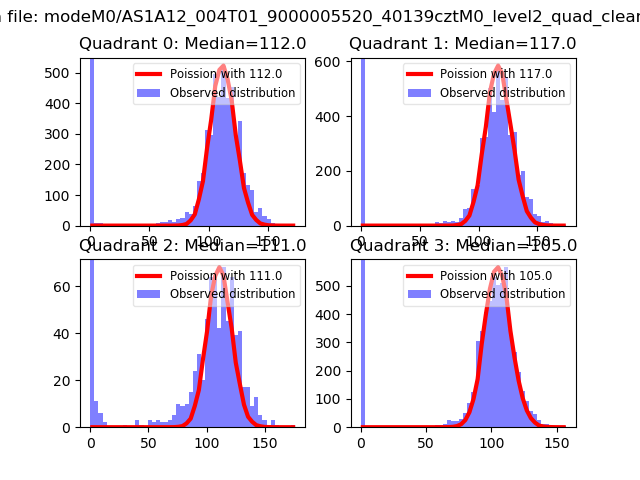 |
 |
| Quadrant-wise count rates Data is divided into 100 sec bins |
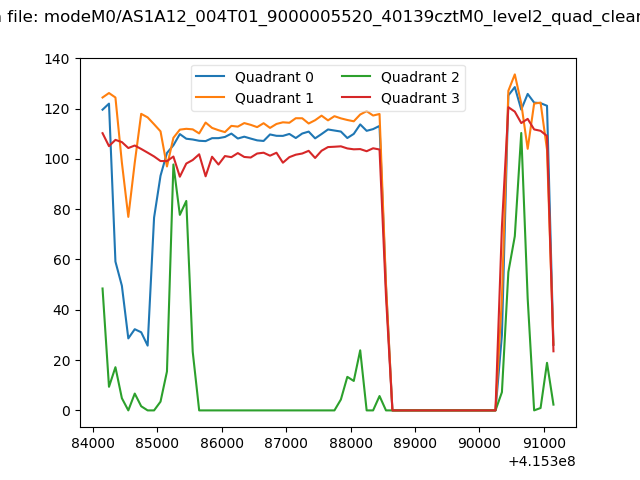 |
|
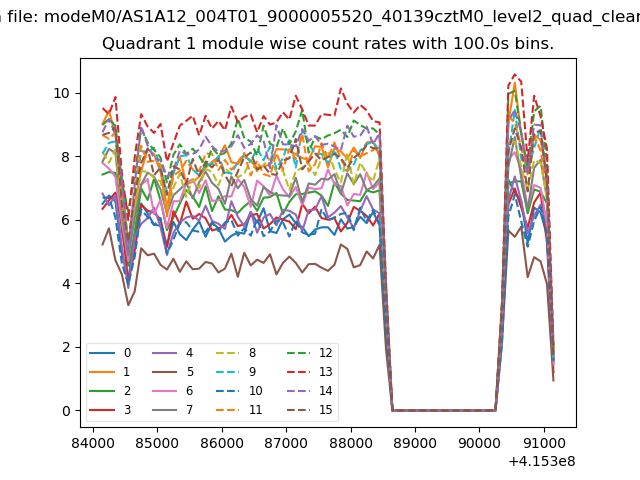
| Module-wise count rates for Quadrant A Data is divided into 100 sec bins |
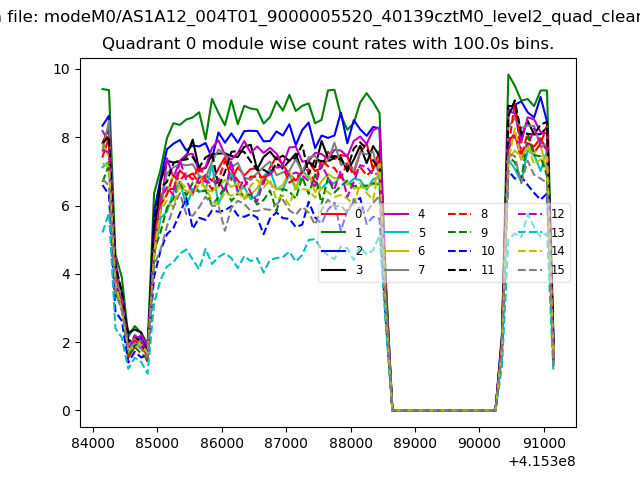 |
 |
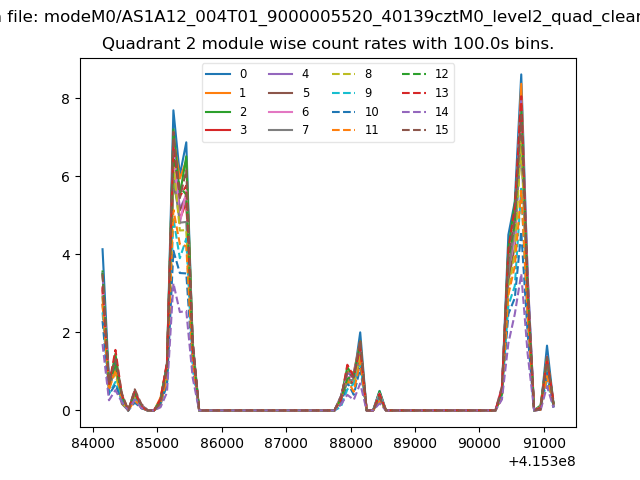
| Module-wise count rates for Quadrant B Data is divided into 100 sec bins |
 |
 |
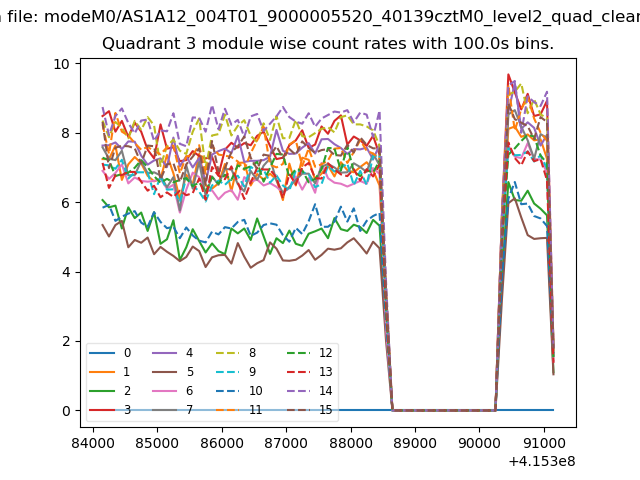
| Module-wise count rates for Quadrant C Data is divided into 100 sec bins |
 |
 |
| Module-wise count rates for Quadrant D Data is divided into 100 sec bins |
 |
 |
| Parameter | Plot |
|---|---|
| CZT HV Monitor | 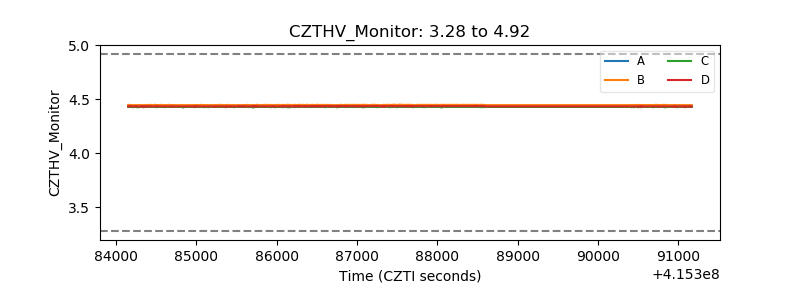 |
| D_VDD | 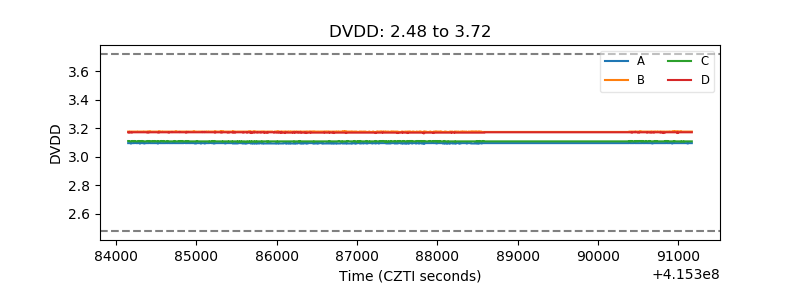 |
| Temperature 1 | 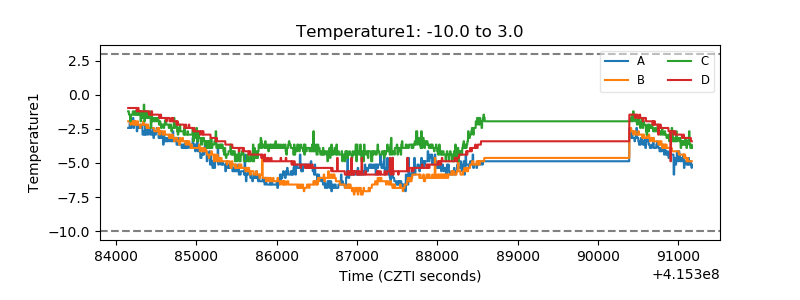 |
| Veto HV Monitor | 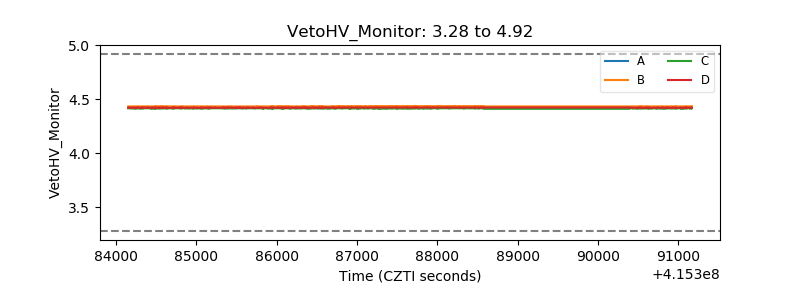 |
| Veto LLD | 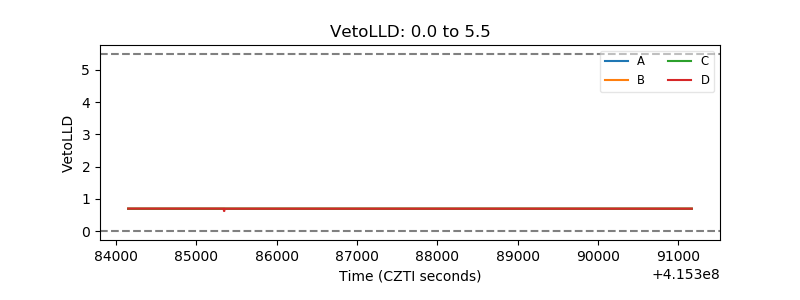 |
| Alpha Counter | 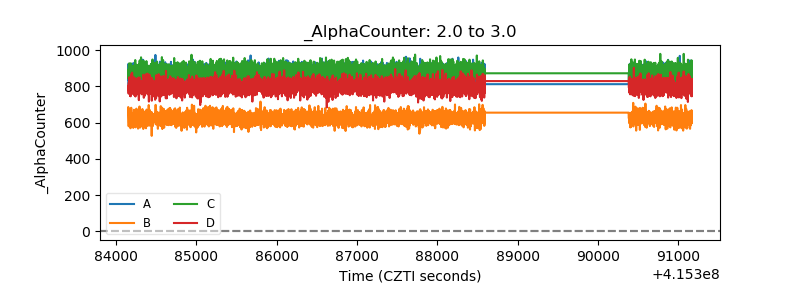 |
| _CPM_Rate | 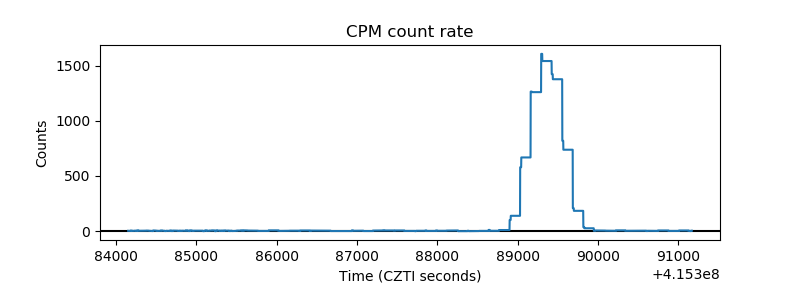 |
| CZT Counter | 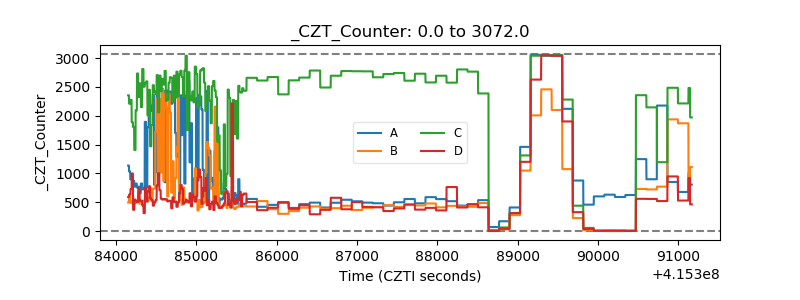 |
| +2.5 Volts monitor |  |
| +5 Volts monitor |  |
| _ROLL_ROT | 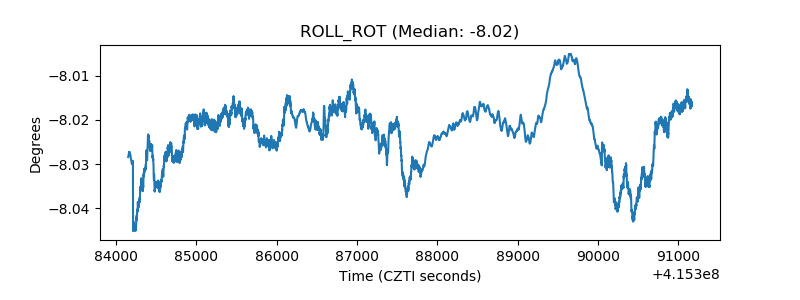 |
| _Roll_DEC | 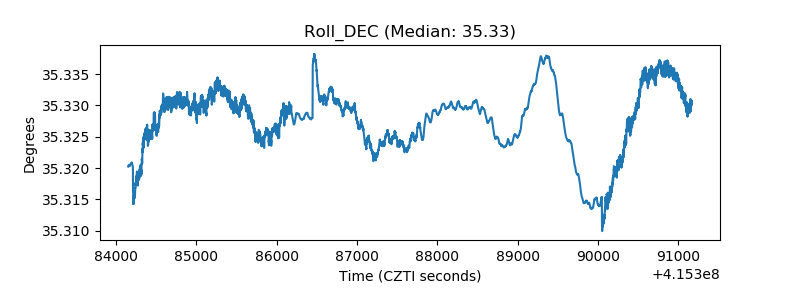 |
| _Roll_RA | 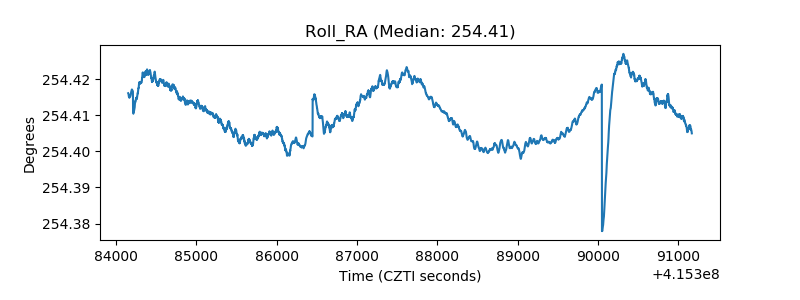 |
| Veto Counter | 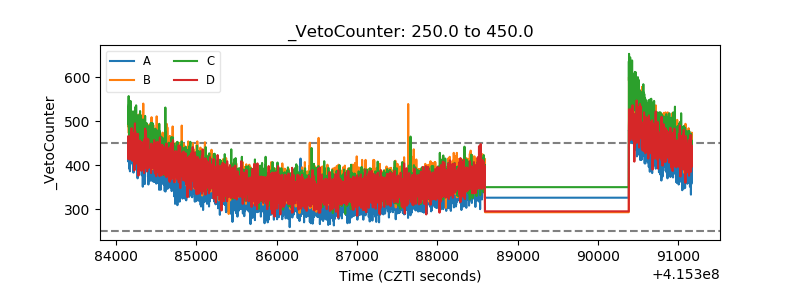 |