| Param | Original file | Final file |
|---|---|---|
| Filename | modeM0/AS1A12_004T01_9000005520_40140cztM0_level2.fits | modeM0/AS1A12_004T01_9000005520_40140cztM0_level2_quad_clean.evt |
| Size (bytes) | 586,883,520 | 72,817,920 |
| Size | 559.7 MB | 69.4 MB |
| Events in quadrant A | 3,222,083 | 602,143 |
| Events in quadrant B | 2,836,747 | 618,236 |
| Events in quadrant C | 12,487,670 | 72,318 |
| Events in quadrant D | 2,780,995 | 555,429 |
| Mode M0 | |||
|---|---|---|---|
| Quadrant | BADHDUFLAG | Total packets | Discarded packets |
| A | 0 | 12966 | 3 |
| B | 0 | 11955 | 2 |
| C | 0 | 40601 | 2 |
| D | 0 | 11868 | 2 |
| Mode M9 | |||
|---|---|---|---|
| Quadrant | BADHDUFLAG | Total packets | Discarded packets |
| A | 0 | 36 | 0 |
| B | 0 | 36 | 0 |
| C | 0 | 36 | 0 |
| D | 0 | 37 | 0 |
| Mode SS | |||
|---|---|---|---|
| Quadrant | BADHDUFLAG | Total packets | Discarded packets |
| A | 0 | 102 | 0 |
| B | 0 | 102 | 0 |
| C | 0 | 102 | 0 |
| D | 0 | 102 | 0 |
| Quadrant | Total seconds | Saturated seconds | Saturation percentage |
|---|---|---|---|
| A | 5097 | 132 | 2.589759% |
| B | 5097 | 164 | 3.217579% |
| C | 5097 | 4620 | 90.641554% |
| D | 5097 | 62 | 1.216402% |
Noise dominated data is calculated using 1-second bins in cleaned event files. If a bin has >2000 counts, and if more than 50% of those come from <1% of pixels, then it is considered to be noise-dominated and hence unusable.
| Quadrant | # 1 sec bins | Bins with >0 counts | Bins with >2000 counts | High rate bins dominated by noise | Noise dominated (total time) | Noise dominated (detector-on time) | Marked lightcurve |
|---|---|---|---|---|---|---|---|
| A | 7010 | 5098 | 117 | 117 | 1.67% | 2.30% | 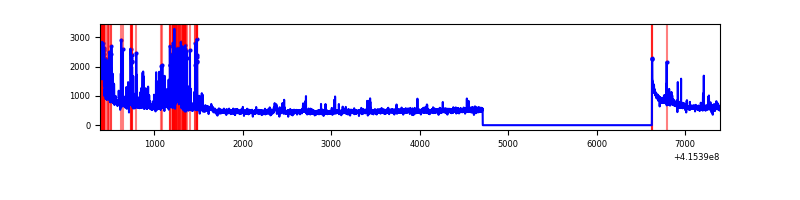 |
| B | 7010 | 5098 | 118 | 118 | 1.68% | 2.31% | 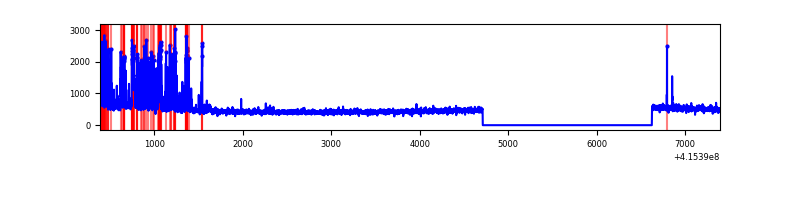 |
| C | 7009 | 5096 | 4612 | 4612 | 65.80% | 90.50% | 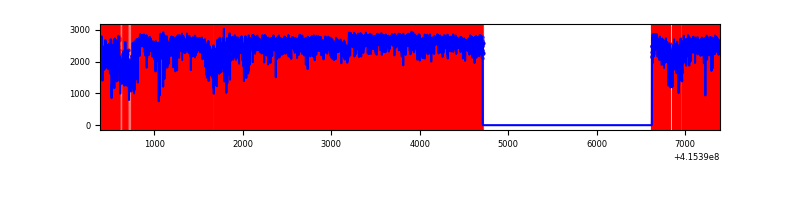 |
| D | 7010 | 5098 | 59 | 59 | 0.84% | 1.16% | 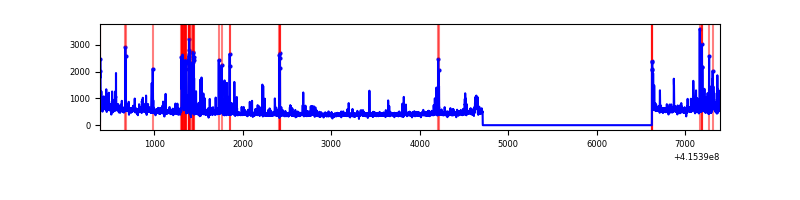 |
Top three noisy pixels from each quadrant. If the there are fewer than three noisy pixels in the level2.evt file, extra rows are filled as -1
| Pixel properties | Quadrant properties | ||||||
|---|---|---|---|---|---|---|---|
| Quadrant | DetID | PixID | Counts | Sigma | Mean | Median | Sigma |
| A | 10 | 83 | 435389 | 3687.67 | 577 | 567 | 117.9 |
| A | 13 | 248 | 372517 | 3154.46 | 577 | 567 | 117.9 |
| A | 12 | 189 | 97363 | 820.92 | 577 | 567 | 117.9 |
| B | 5 | 172 | 265127 | 2380.88 | 576 | 559 | 111.1 |
| B | 4 | 171 | 131469 | 1178.07 | 576 | 559 | 111.1 |
| B | 0 | 186 | 86584 | 774.15 | 576 | 559 | 111.1 |
| C | 9 | 187 | 11183657 | 167496.29 | 284 | 285 | 66.8 |
| C | 15 | 214 | 111275 | 1662.32 | 284 | 285 | 66.8 |
| C | 0 | 10 | 56781 | 846.15 | 284 | 285 | 66.8 |
| D | 13 | 249 | 254866 | 1808.78 | 572 | 558 | 140.6 |
| D | 1 | 52 | 83814 | 592.16 | 572 | 558 | 140.6 |
| D | 2 | 250 | 57525 | 405.18 | 572 | 558 | 140.6 |
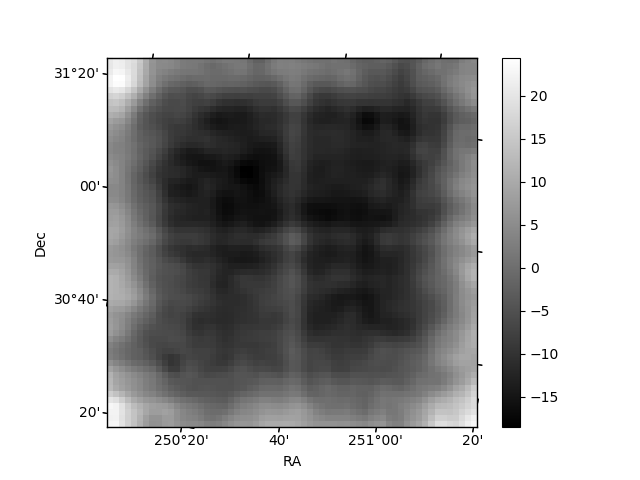
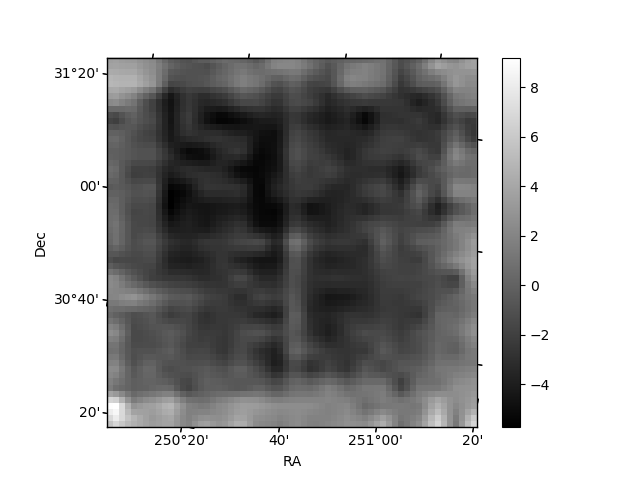
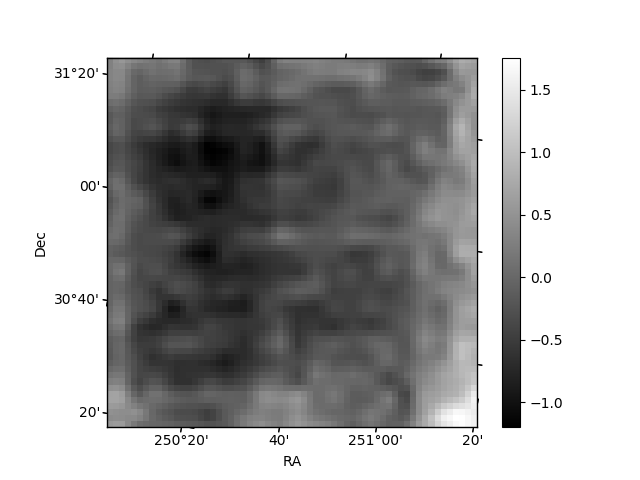
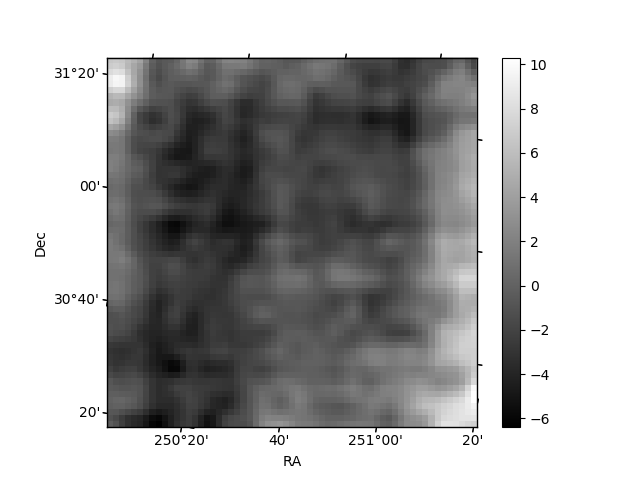
Histogram calculated using DETX and DETY for each event in the final _common_clean file
| Quadrant A | 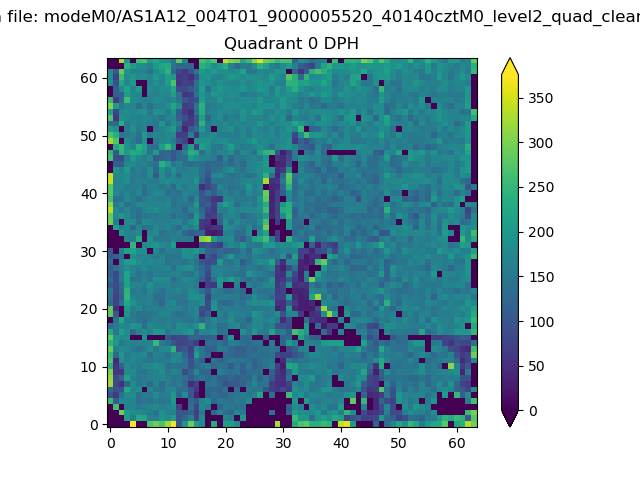 |
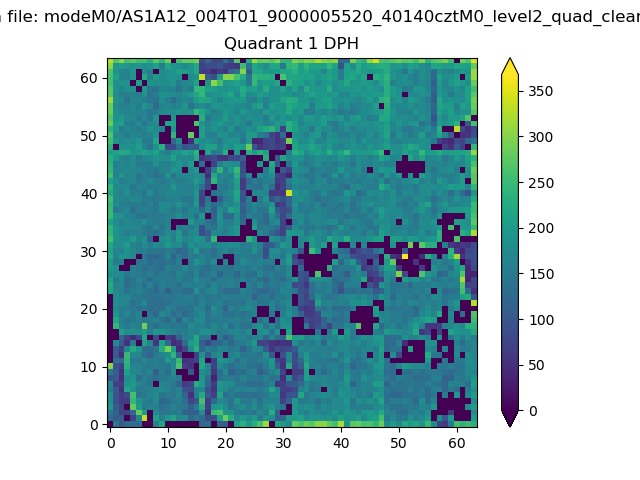 |
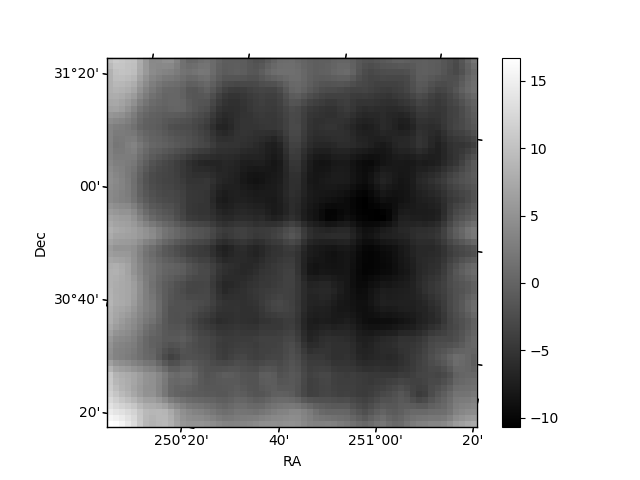
Quadrant B |
|---|---|---|---|
| Quadrant D | 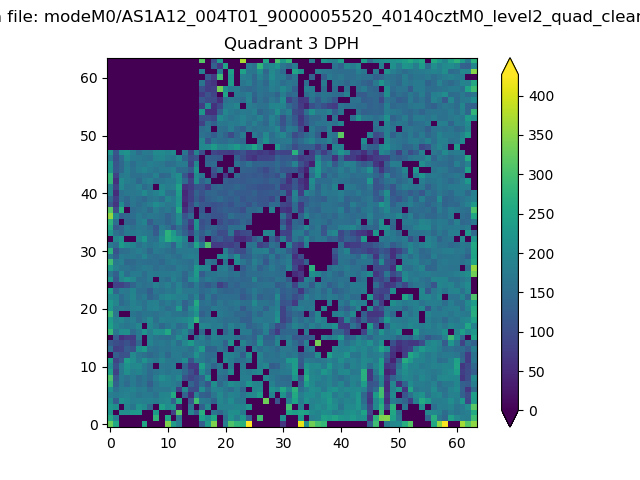 |
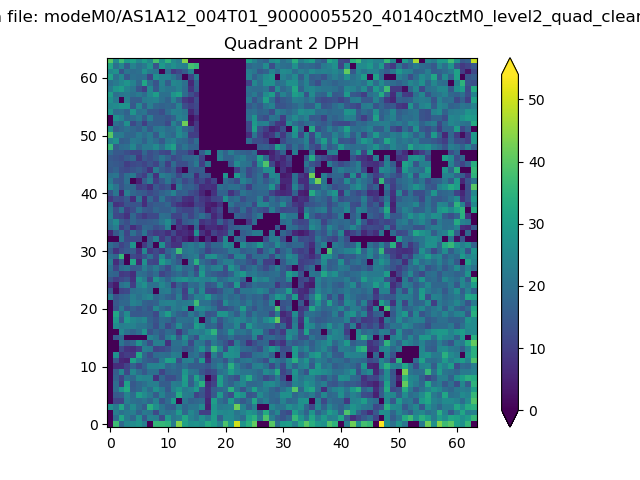 |
Quadrant C |
| Plot type | Count rate plots | Images |
|---|---|---|
| Comparison with Poisson distribution Blue bars denote a histogram of data divided into 1 sec bins. Red curve is a Poisson curve with rate = median count rate of data. |
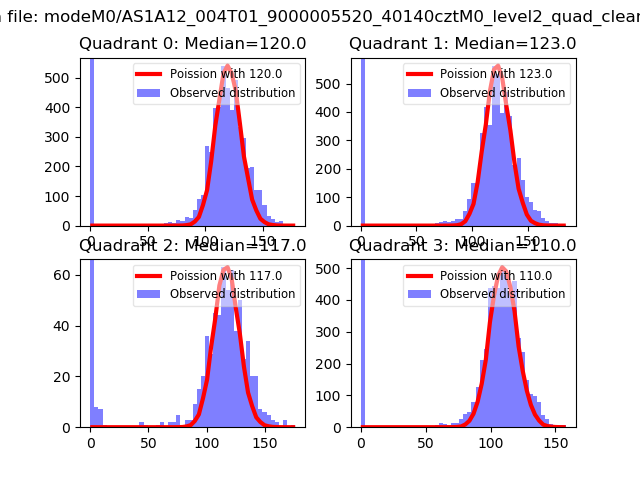 |
 |
| Quadrant-wise count rates Data is divided into 100 sec bins |
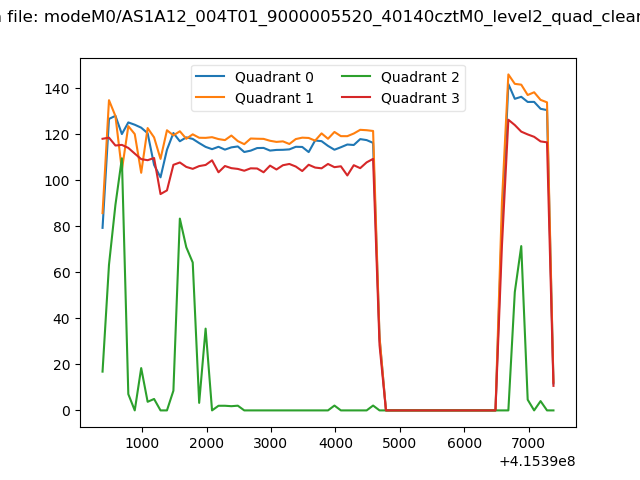 |
|
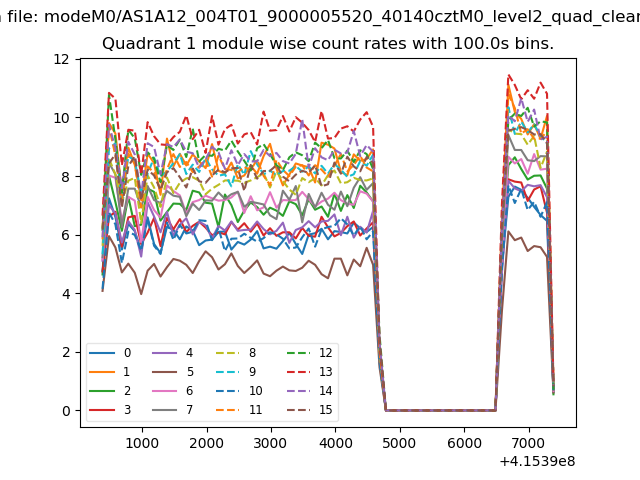
| Module-wise count rates for Quadrant A Data is divided into 100 sec bins |
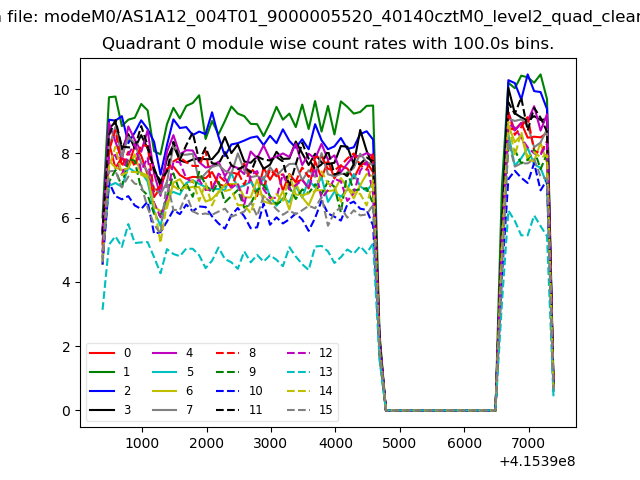 |
 |
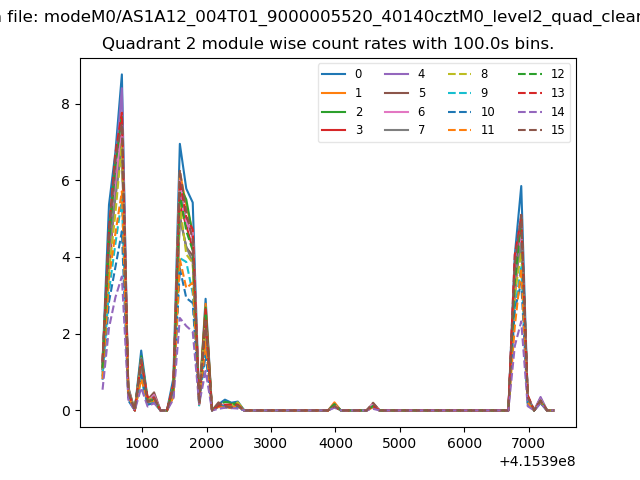
| Module-wise count rates for Quadrant B Data is divided into 100 sec bins |
 |
 |
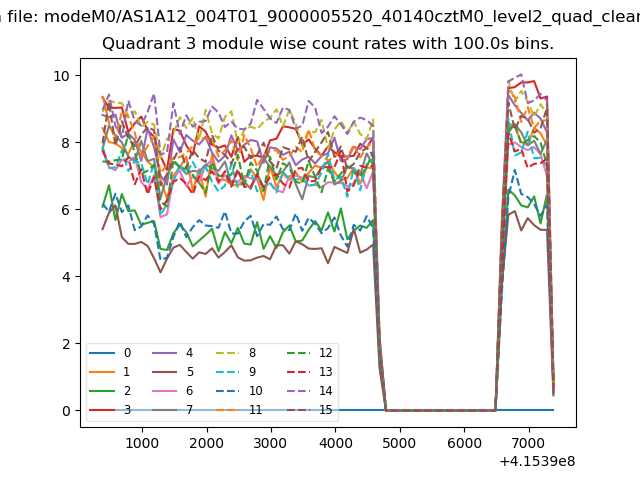
| Module-wise count rates for Quadrant C Data is divided into 100 sec bins |
 |
 |
| Module-wise count rates for Quadrant D Data is divided into 100 sec bins |
 |
 |
| Parameter | Plot |
|---|---|
| CZT HV Monitor | 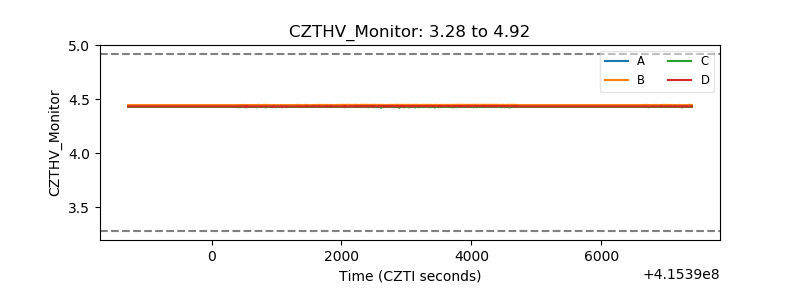 |
| D_VDD | 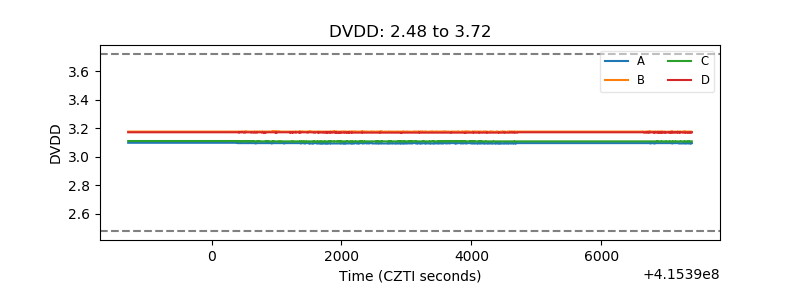 |
| Temperature 1 | 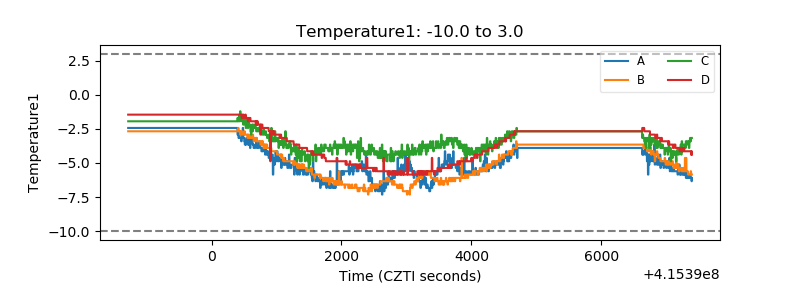 |
| Veto HV Monitor | 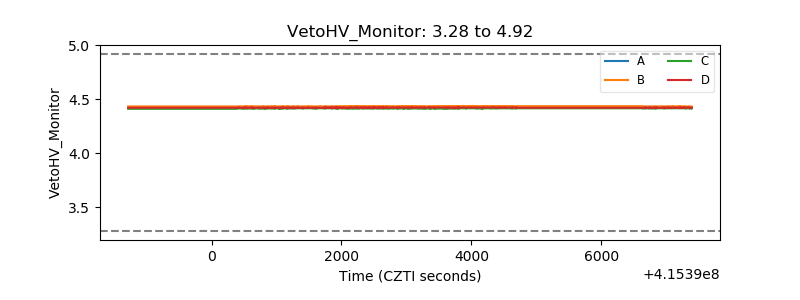 |
| Veto LLD | 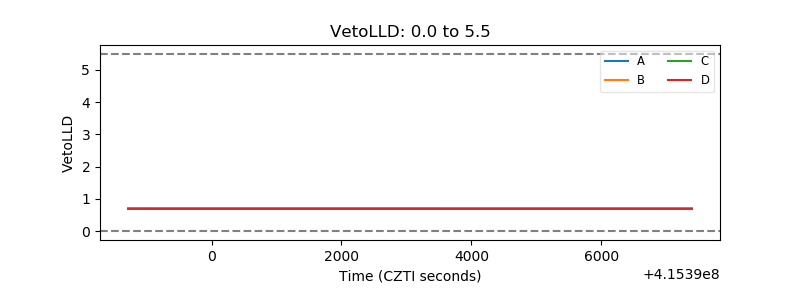 |
| Alpha Counter |  |
| _CPM_Rate | 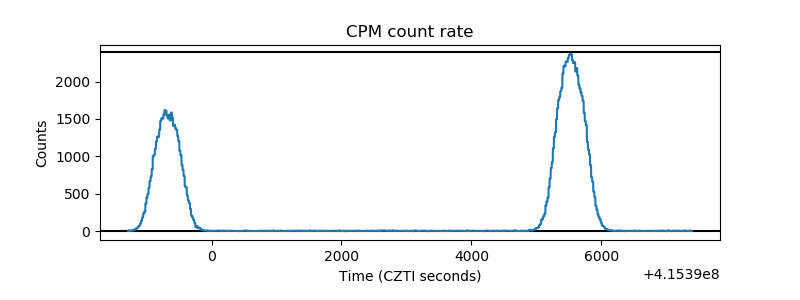 |
| CZT Counter | 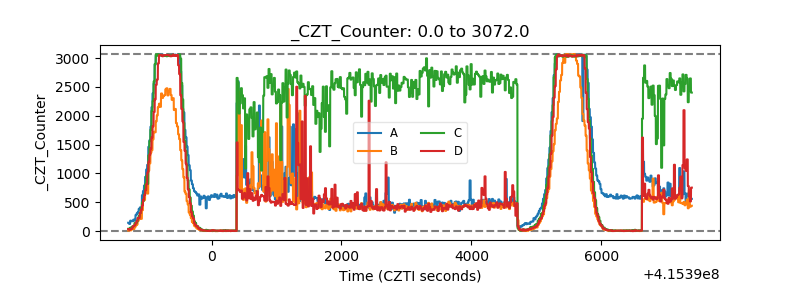 |
| +2.5 Volts monitor | 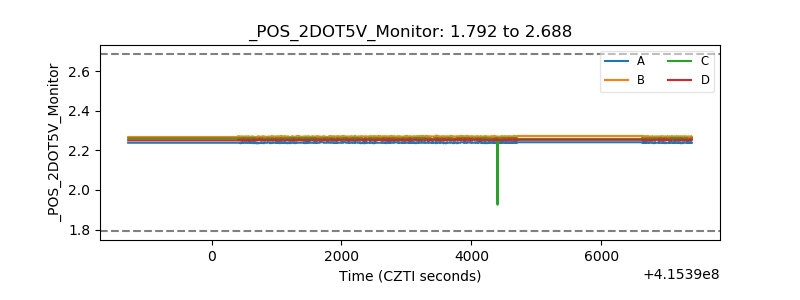 |
| +5 Volts monitor |  |
| _ROLL_ROT | 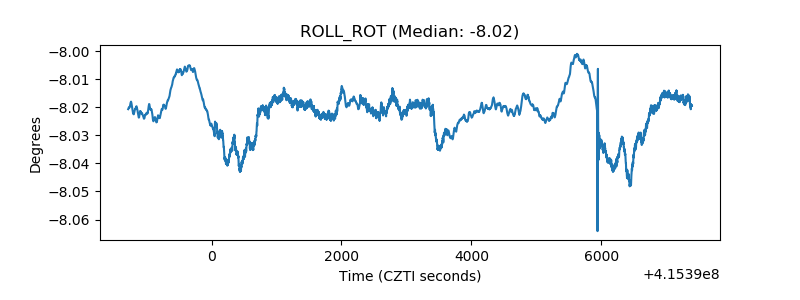 |
| _Roll_DEC | 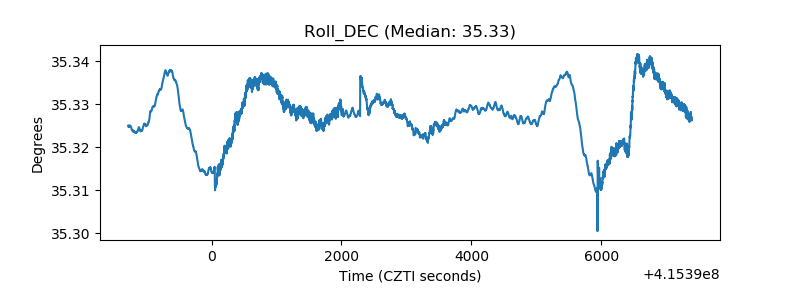 |
| _Roll_RA | 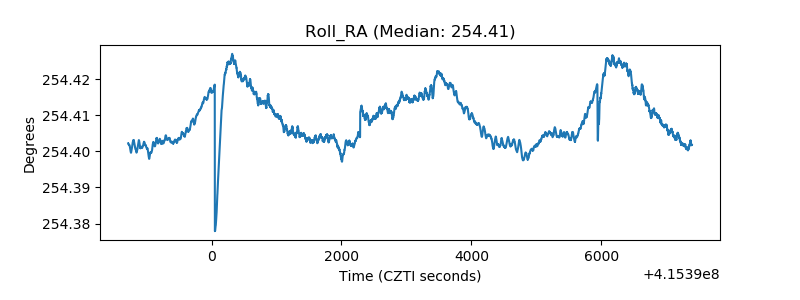 |
| Veto Counter | 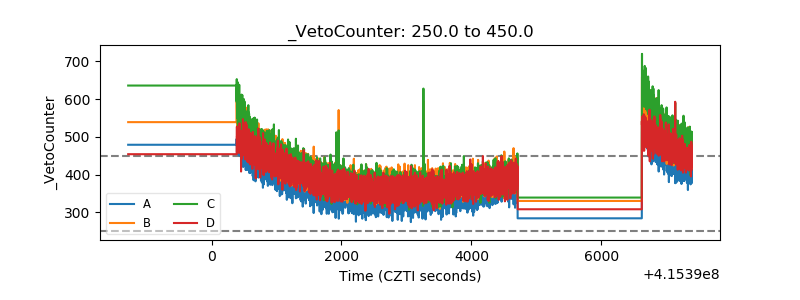 |