| Param | Original file | Final file |
|---|---|---|
| Filename | modeM0/AS1A12_004T01_9000005520_40141cztM0_level2.fits | modeM0/AS1A12_004T01_9000005520_40141cztM0_level2_quad_clean.evt |
| Size (bytes) | 566,640,000 | 74,496,960 |
| Size | 540.4 MB | 71.0 MB |
| Events in quadrant A | 2,848,986 | 624,985 |
| Events in quadrant B | 2,365,943 | 650,594 |
| Events in quadrant C | 12,575,529 | 58,162 |
| Events in quadrant D | 2,792,130 | 569,264 |
| Mode M0 | |||
|---|---|---|---|
| Quadrant | BADHDUFLAG | Total packets | Discarded packets |
| A | 0 | 11615 | 3 |
| B | 0 | 10323 | 2 |
| C | 0 | 40817 | 2 |
| D | 0 | 11809 | 2 |
| Mode M9 | |||
|---|---|---|---|
| Quadrant | BADHDUFLAG | Total packets | Discarded packets |
| A | 0 | 36 | 0 |
| B | 0 | 36 | 0 |
| C | 0 | 36 | 0 |
| D | 0 | 37 | 0 |
| Mode SS | |||
|---|---|---|---|
| Quadrant | BADHDUFLAG | Total packets | Discarded packets |
| A | 0 | 102 | 0 |
| B | 0 | 102 | 0 |
| C | 0 | 102 | 0 |
| D | 0 | 102 | 0 |
| Quadrant | Total seconds | Saturated seconds | Saturation percentage |
|---|---|---|---|
| A | 5037 | 17 | 0.337502% |
| B | 5037 | 18 | 0.357356% |
| C | 5037 | 4678 | 92.872742% |
| D | 5037 | 49 | 0.972801% |
Noise dominated data is calculated using 1-second bins in cleaned event files. If a bin has >2000 counts, and if more than 50% of those come from <1% of pixels, then it is considered to be noise-dominated and hence unusable.
| Quadrant | # 1 sec bins | Bins with >0 counts | Bins with >2000 counts | High rate bins dominated by noise | Noise dominated (total time) | Noise dominated (detector-on time) | Marked lightcurve |
|---|---|---|---|---|---|---|---|
| A | 7069 | 5038 | 7 | 7 | 0.10% | 0.14% | 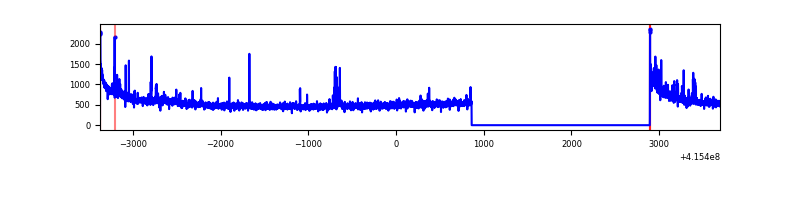 |
| B | 7069 | 5038 | 2 | 2 | 0.03% | 0.04% | 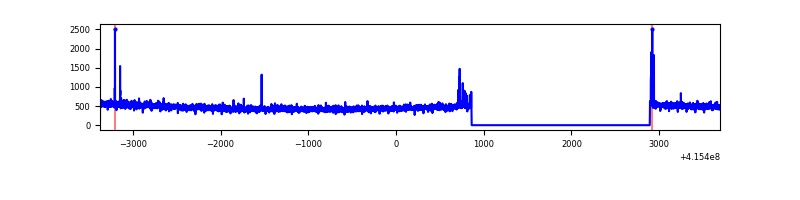 |
| C | 7068 | 5036 | 4626 | 4626 | 65.45% | 91.86% | 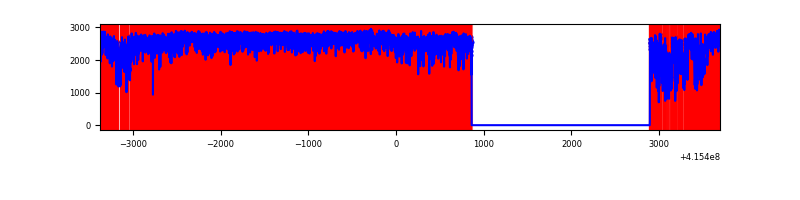 |
| D | 7069 | 5038 | 49 | 49 | 0.69% | 0.97% | 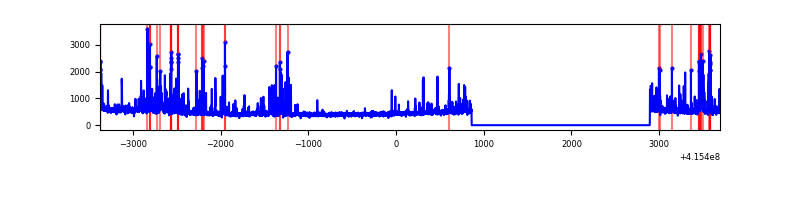 |
Top three noisy pixels from each quadrant. If the there are fewer than three noisy pixels in the level2.evt file, extra rows are filled as -1
| Pixel properties | Quadrant properties | ||||||
|---|---|---|---|---|---|---|---|
| Quadrant | DetID | PixID | Counts | Sigma | Mean | Median | Sigma |
| A | 10 | 83 | 440409 | 3708.89 | 581 | 571 | 118.6 |
| A | 13 | 248 | 45287 | 377.06 | 581 | 571 | 118.6 |
| A | 2 | 79 | 42179 | 350.86 | 581 | 571 | 118.6 |
| B | 0 | 190 | 29740 | 260.87 | 586 | 571 | 111.8 |
| B | 5 | 172 | 23997 | 209.51 | 586 | 571 | 111.8 |
| B | 12 | 111 | 13773 | 118.07 | 586 | 571 | 111.8 |
| C | 9 | 187 | 11323526 | 171355.73 | 282 | 285 | 66.1 |
| C | 15 | 214 | 108751 | 1641.43 | 282 | 285 | 66.1 |
| C | 0 | 10 | 20310 | 303.04 | 282 | 285 | 66.1 |
| D | 13 | 249 | 157130 | 1139.9 | 571 | 558 | 137.4 |
| D | 12 | 227 | 110680 | 801.72 | 571 | 558 | 137.4 |
| D | 9 | 19 | 80603 | 582.75 | 571 | 558 | 137.4 |
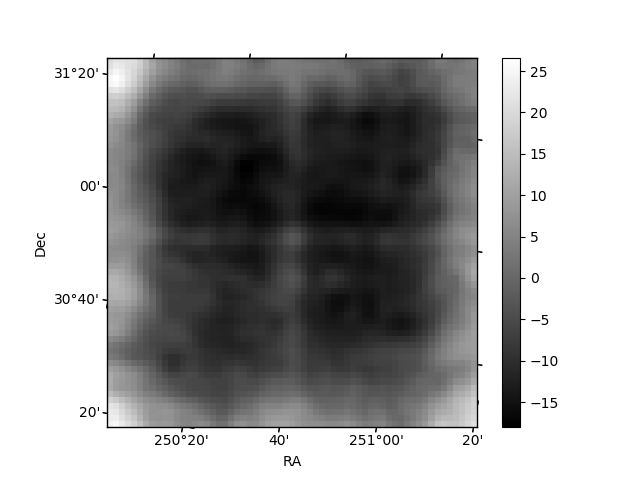
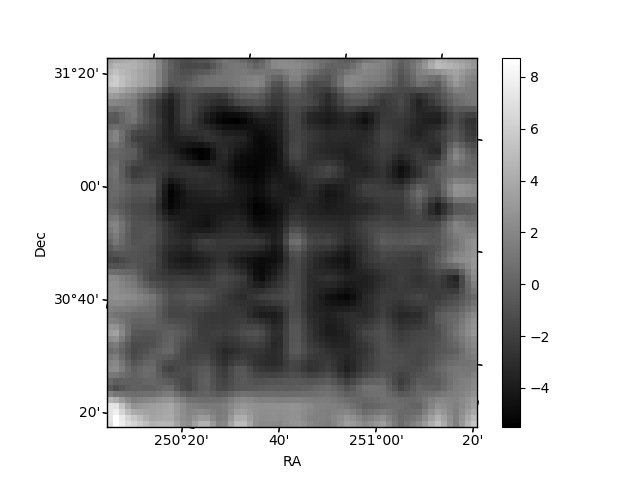
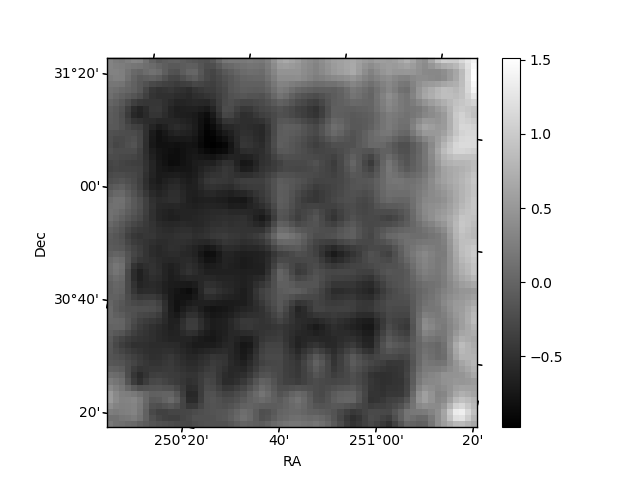
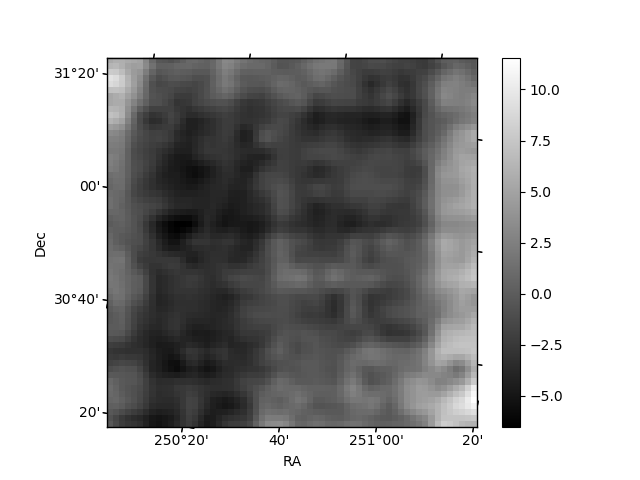
Histogram calculated using DETX and DETY for each event in the final _common_clean file
| Quadrant A | 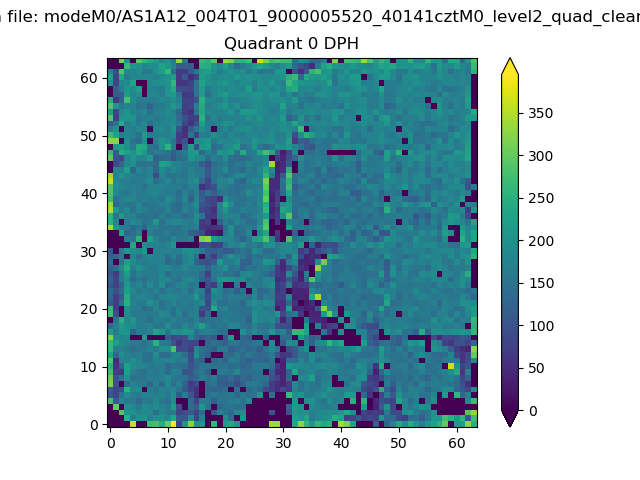 |
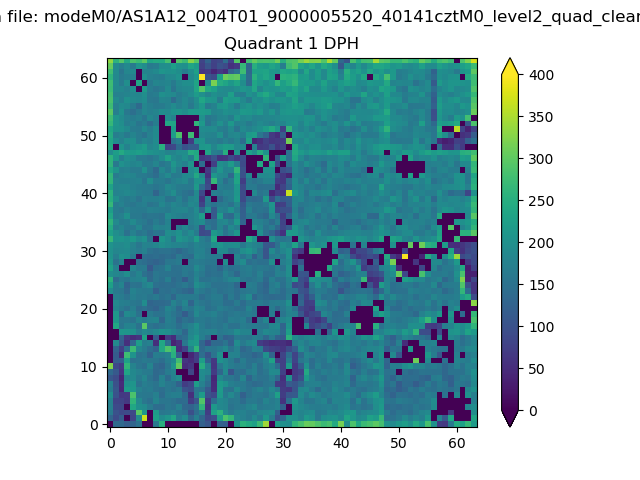 |
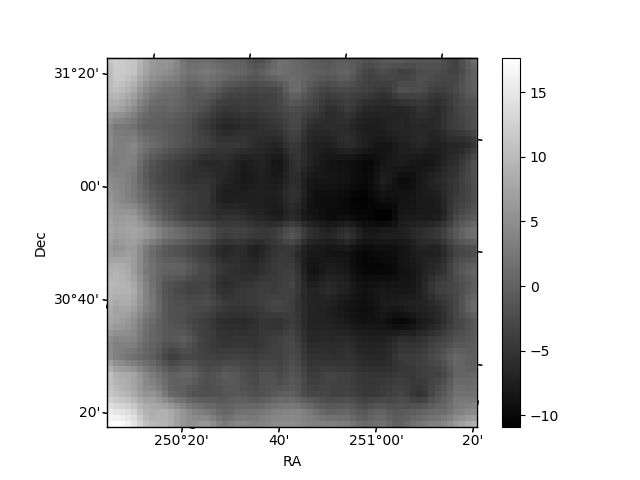
Quadrant B |
|---|---|---|---|
| Quadrant D | 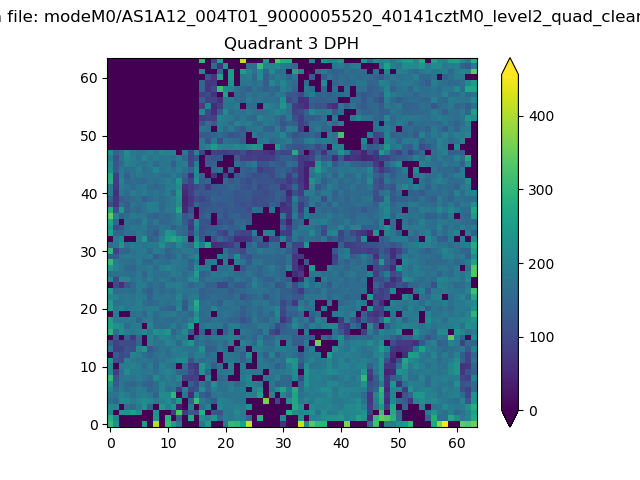 |
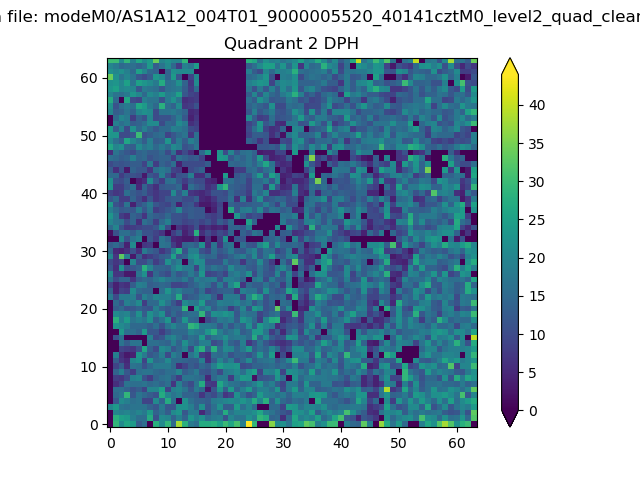 |
Quadrant C |
| Plot type | Count rate plots | Images |
|---|---|---|
| Comparison with Poisson distribution Blue bars denote a histogram of data divided into 1 sec bins. Red curve is a Poisson curve with rate = median count rate of data. |
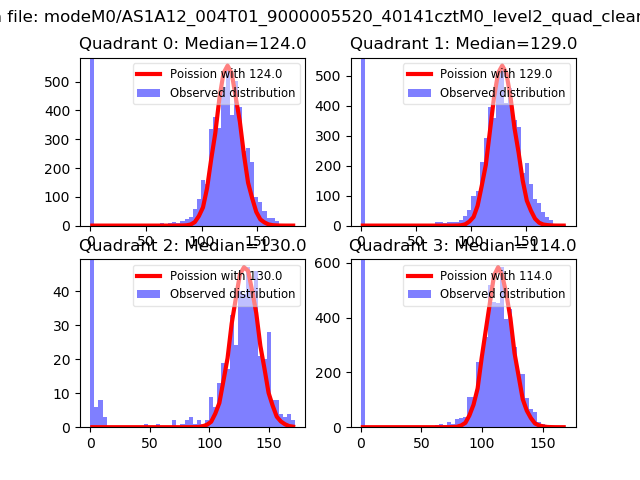 |
 |
| Quadrant-wise count rates Data is divided into 100 sec bins |
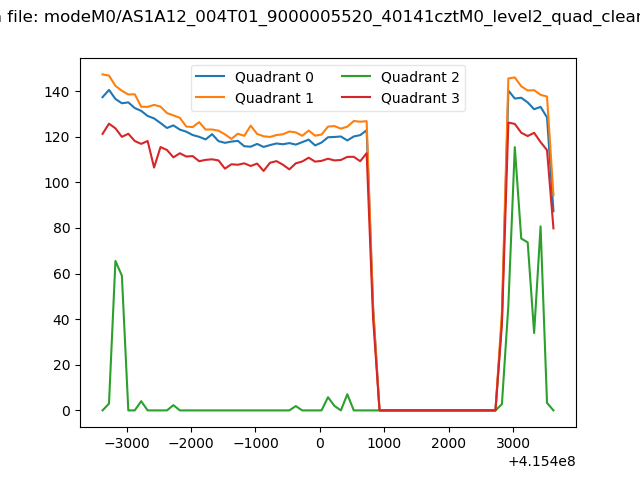 |
|
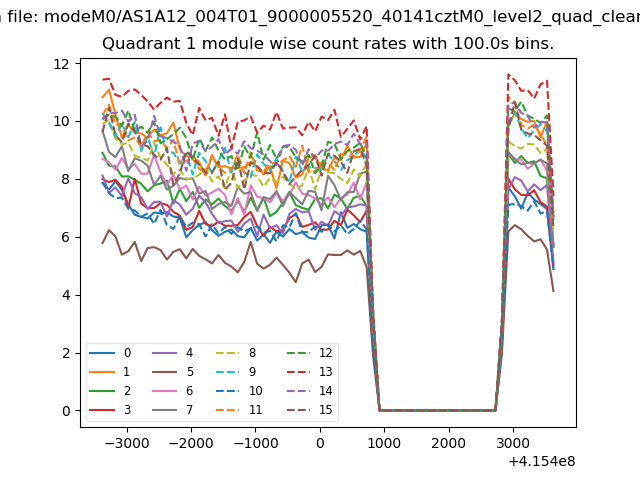
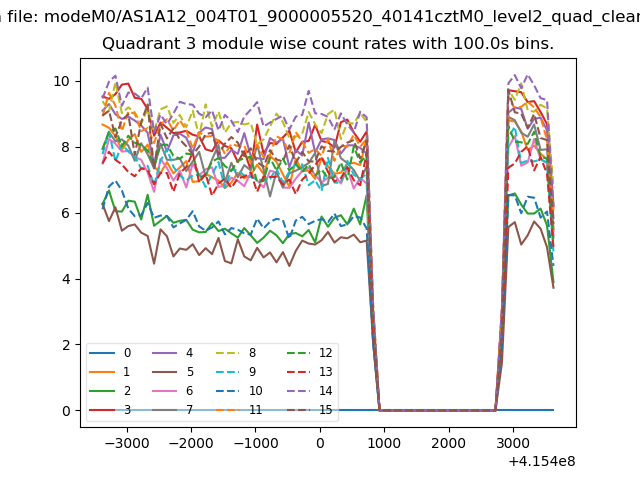
| Module-wise count rates for Quadrant A Data is divided into 100 sec bins |
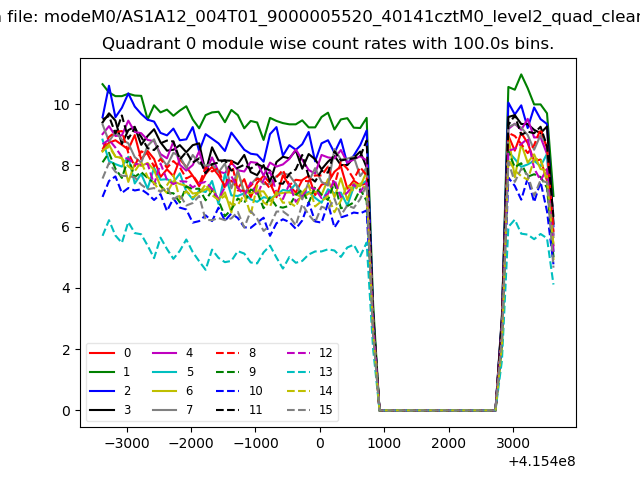 |
 |
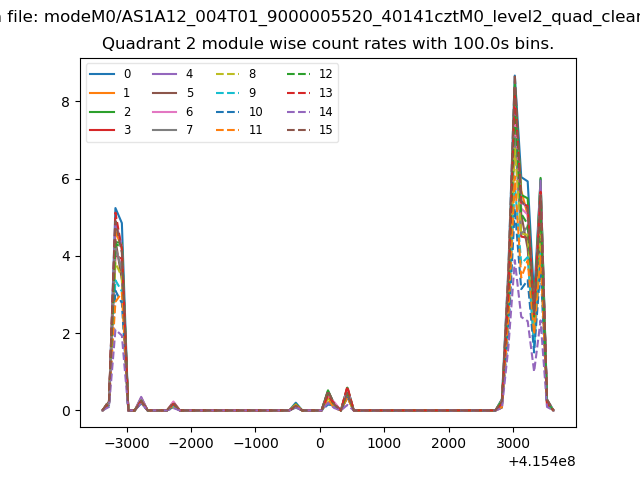
| Module-wise count rates for Quadrant B Data is divided into 100 sec bins |
 |
 |
| Module-wise count rates for Quadrant C Data is divided into 100 sec bins |
 |
 |
| Module-wise count rates for Quadrant D Data is divided into 100 sec bins |
 |
 |
| Parameter | Plot |
|---|---|
| CZT HV Monitor | 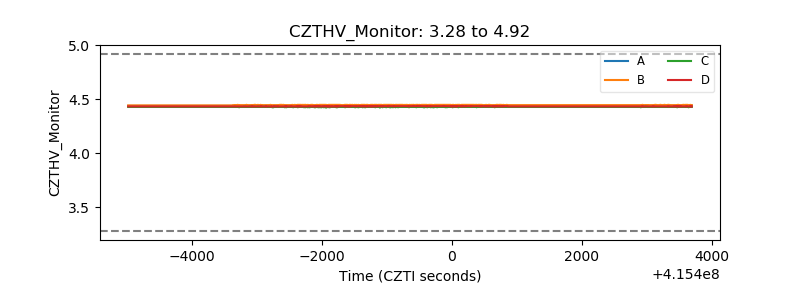 |
| D_VDD | 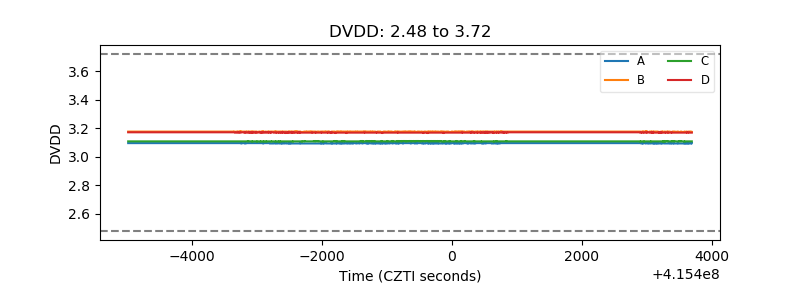 |
| Temperature 1 | 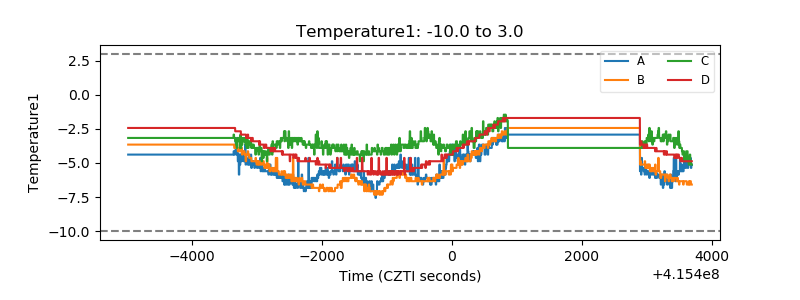 |
| Veto HV Monitor | 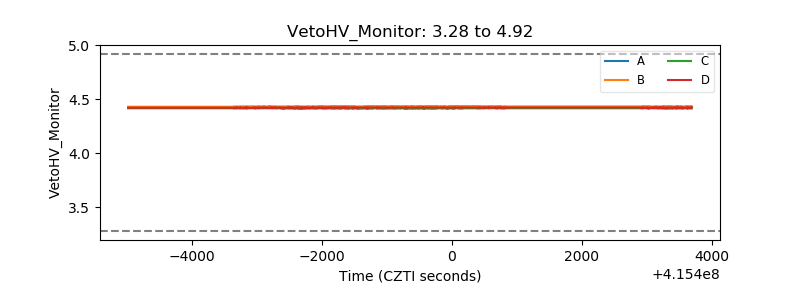 |
| Veto LLD | 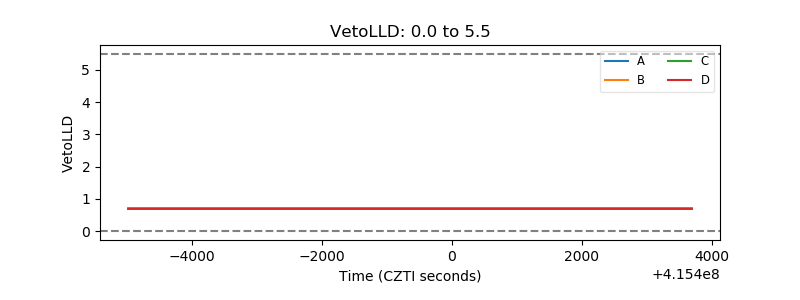 |
| Alpha Counter | 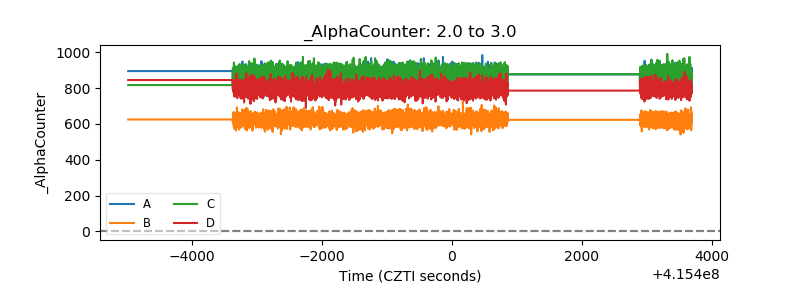 |
| _CPM_Rate | 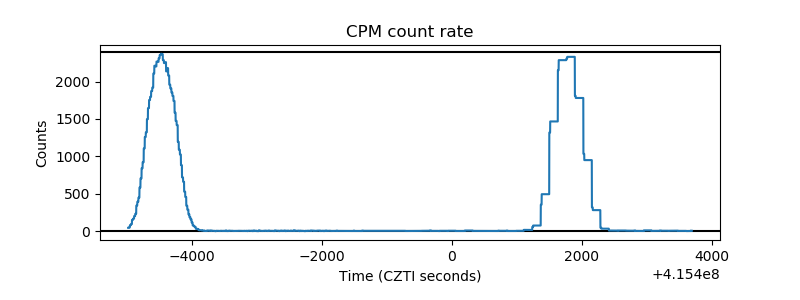 |
| CZT Counter | 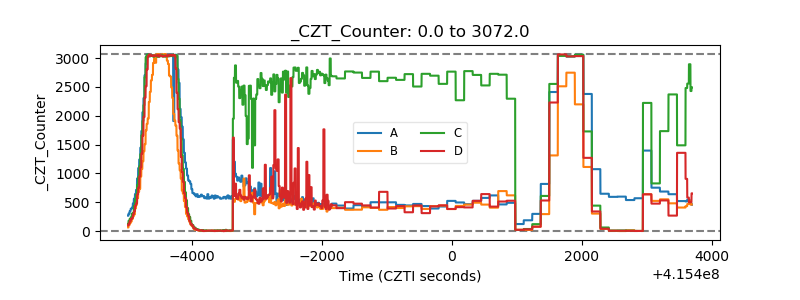 |
| +2.5 Volts monitor | 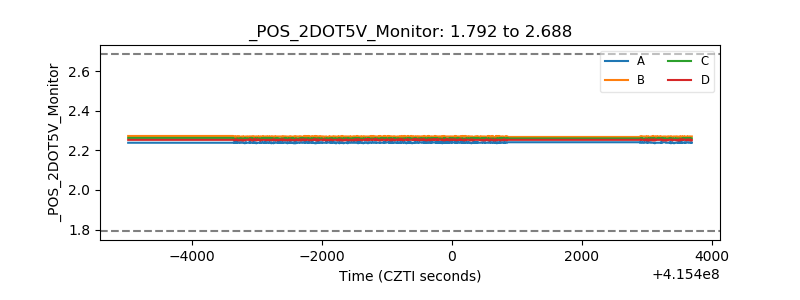 |
| +5 Volts monitor | 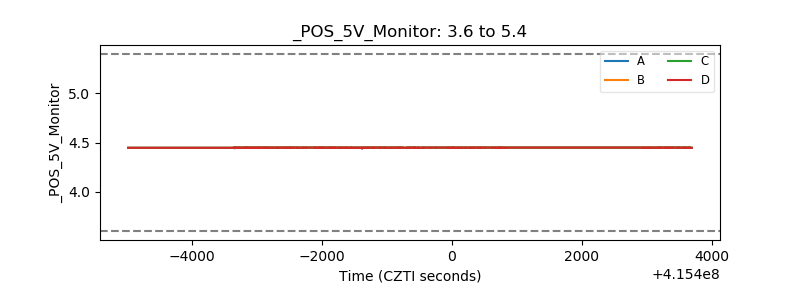 |
| _ROLL_ROT | 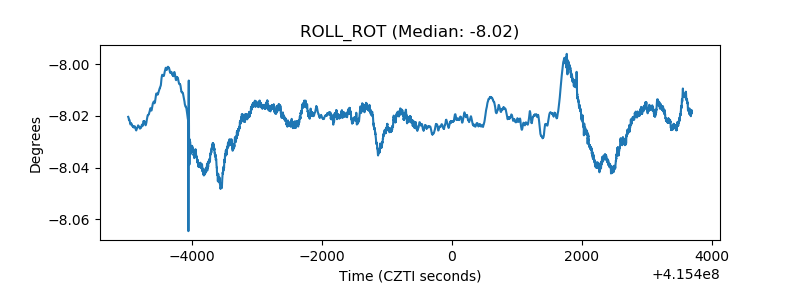 |
| _Roll_DEC | 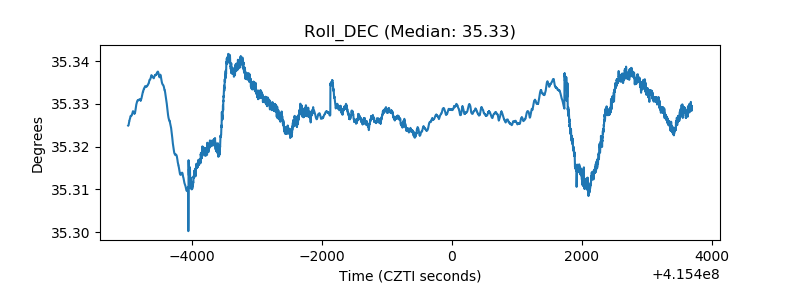 |
| _Roll_RA | 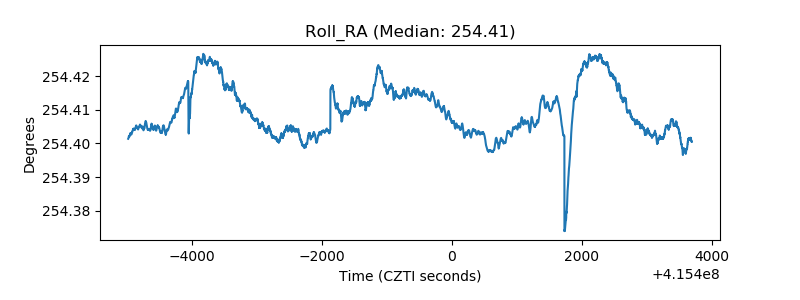 |
| Veto Counter | 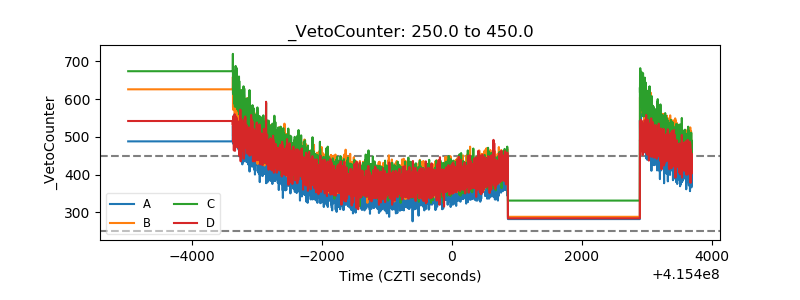 |