| Param | Original file | Final file |
|---|---|---|
| Filename | modeM0/AS1A12_004T01_9000005520_40142cztM0_level2.fits | modeM0/AS1A12_004T01_9000005520_40142cztM0_level2_quad_clean.evt |
| Size (bytes) | 510,027,840 | 67,512,960 |
| Size | 486.4 MB | 64.4 MB |
| Events in quadrant A | 2,747,215 | 553,834 |
| Events in quadrant B | 2,090,368 | 582,297 |
| Events in quadrant C | 11,145,121 | 84,769 |
| Events in quadrant D | 2,543,548 | 504,775 |
| Mode M0 | |||
|---|---|---|---|
| Quadrant | BADHDUFLAG | Total packets | Discarded packets |
| A | 0 | 11191 | 2 |
| B | 0 | 9201 | 2 |
| C | 0 | 36221 | 2 |
| D | 0 | 10748 | 2 |
| Mode M9 | |||
|---|---|---|---|
| Quadrant | BADHDUFLAG | Total packets | Discarded packets |
| A | 0 | 29 | 0 |
| B | 0 | 29 | 0 |
| C | 0 | 29 | 0 |
| D | 0 | 30 | 0 |
| Mode SS | |||
|---|---|---|---|
| Quadrant | BADHDUFLAG | Total packets | Discarded packets |
| A | 0 | 94 | 0 |
| B | 0 | 94 | 0 |
| C | 0 | 94 | 0 |
| D | 0 | 94 | 0 |
| Quadrant | Total seconds | Saturated seconds | Saturation percentage |
|---|---|---|---|
| A | 4529 | 19 | 0.419519% |
| B | 4529 | 12 | 0.264959% |
| C | 4529 | 4000 | 88.319717% |
| D | 4529 | 56 | 1.236476% |
Noise dominated data is calculated using 1-second bins in cleaned event files. If a bin has >2000 counts, and if more than 50% of those come from <1% of pixels, then it is considered to be noise-dominated and hence unusable.
| Quadrant | # 1 sec bins | Bins with >0 counts | Bins with >2000 counts | High rate bins dominated by noise | Noise dominated (total time) | Noise dominated (detector-on time) | Marked lightcurve |
|---|---|---|---|---|---|---|---|
| A | 6621 | 4530 | 7 | 7 | 0.11% | 0.15% | 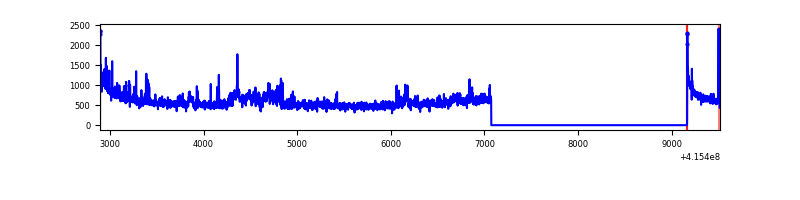 |
| B | 6621 | 4530 | 2 | 2 | 0.03% | 0.04% | 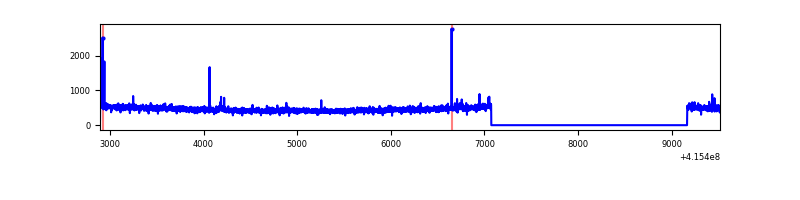 |
| C | 6620 | 4528 | 4032 | 4032 | 60.91% | 89.05% | 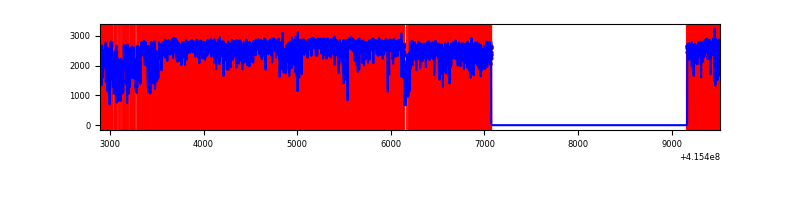 |
| D | 6621 | 4530 | 58 | 58 | 0.88% | 1.28% | 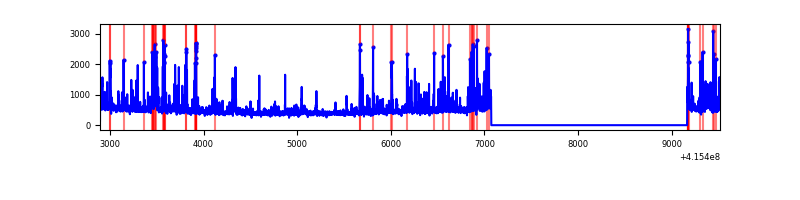 |
Top three noisy pixels from each quadrant. If the there are fewer than three noisy pixels in the level2.evt file, extra rows are filled as -1
| Pixel properties | Quadrant properties | ||||||
|---|---|---|---|---|---|---|---|
| Quadrant | DetID | PixID | Counts | Sigma | Mean | Median | Sigma |
| A | 10 | 83 | 396220 | 3750.98 | 514 | 505 | 105.5 |
| A | 12 | 189 | 241847 | 2287.68 | 514 | 505 | 105.5 |
| A | 13 | 248 | 39264 | 367.4 | 514 | 505 | 105.5 |
| B | 5 | 172 | 18342 | 176.6 | 521 | 506 | 101.0 |
| B | 4 | 171 | 15598 | 149.43 | 521 | 506 | 101.0 |
| B | 12 | 111 | 12285 | 116.63 | 521 | 506 | 101.0 |
| C | 9 | 187 | 9864257 | 145903.72 | 286 | 288 | 67.6 |
| C | 15 | 214 | 109897 | 1621.29 | 286 | 288 | 67.6 |
| C | 0 | 10 | 19796 | 288.55 | 286 | 288 | 67.6 |
| D | 12 | 227 | 148761 | 1216.03 | 503 | 489 | 121.9 |
| D | 13 | 249 | 108275 | 883.99 | 503 | 489 | 121.9 |
| D | 9 | 19 | 91042 | 742.66 | 503 | 489 | 121.9 |
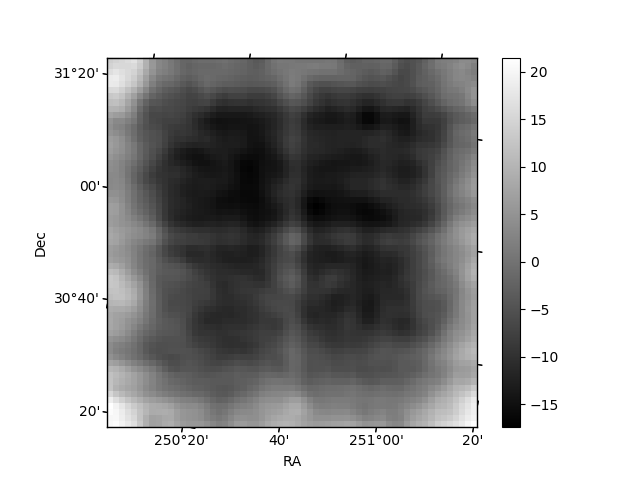
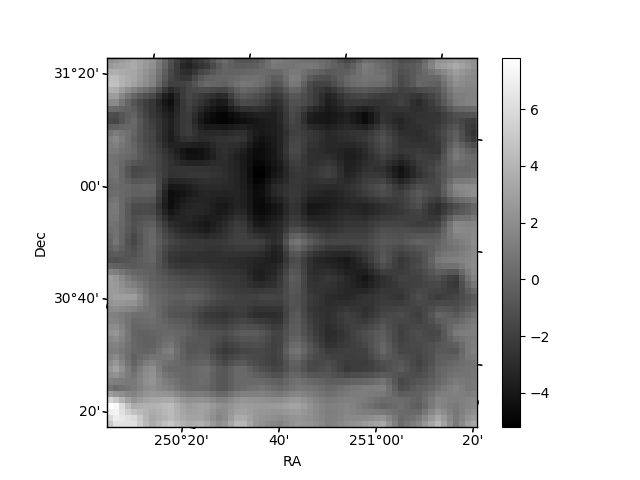
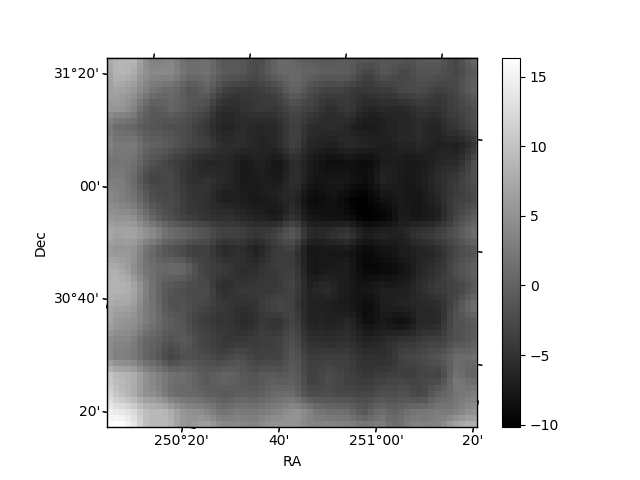
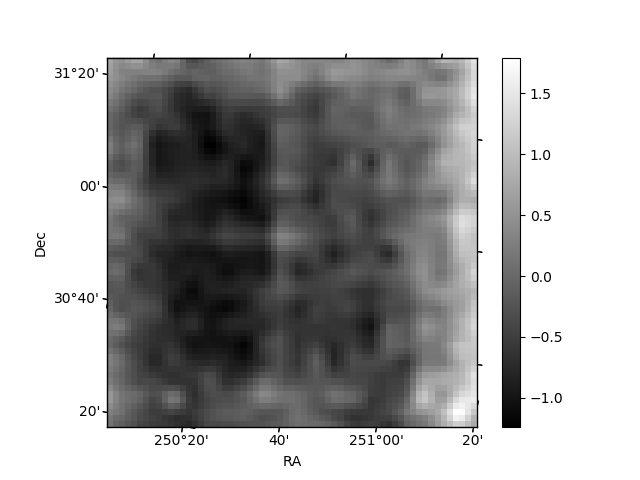
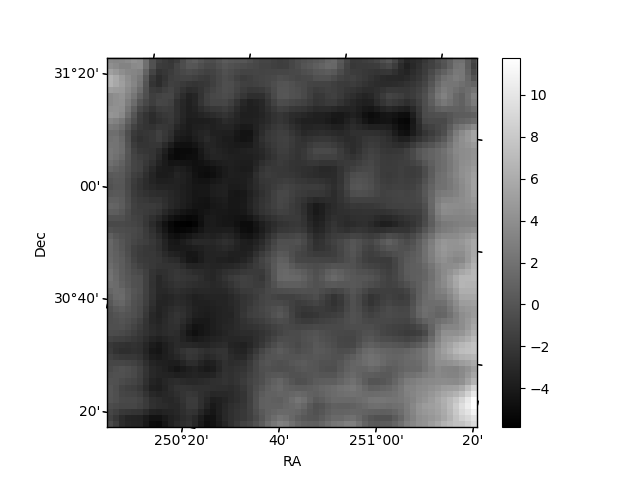
Histogram calculated using DETX and DETY for each event in the final _common_clean file
| Quadrant A | 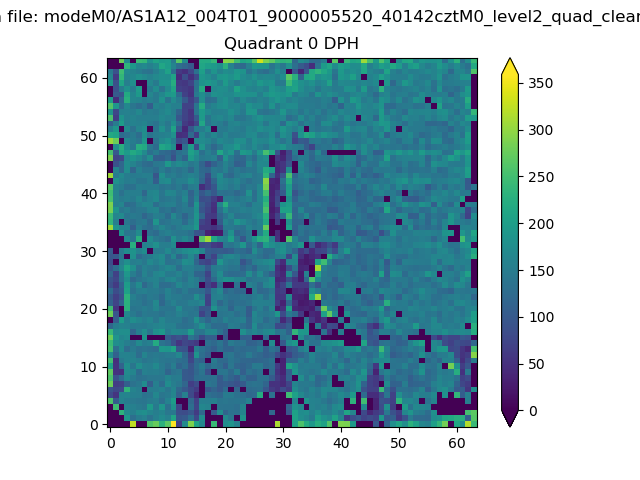 |
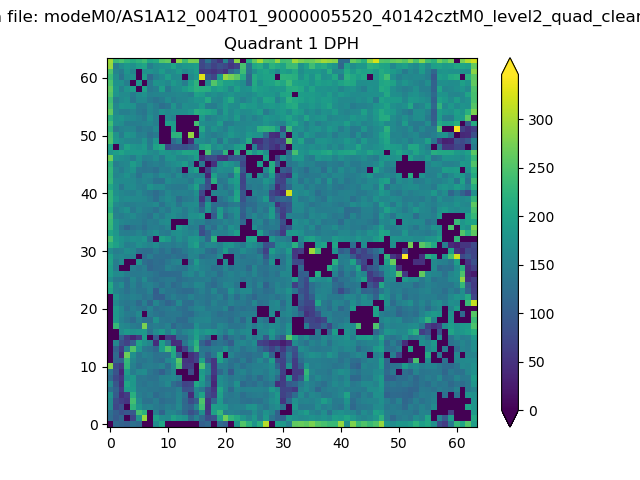 |
Quadrant B |
|---|---|---|---|
| Quadrant D | 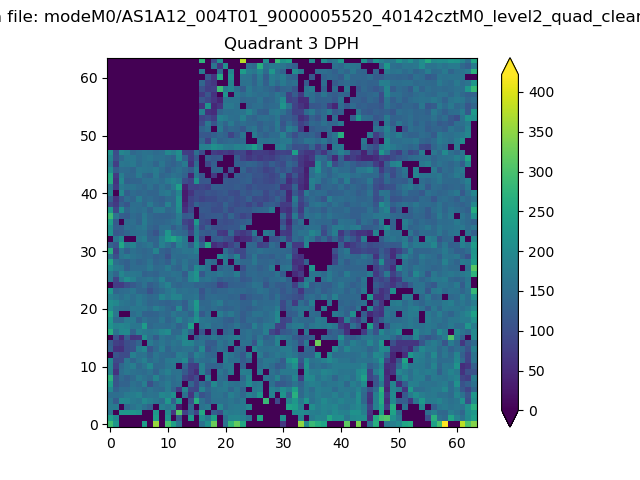 |
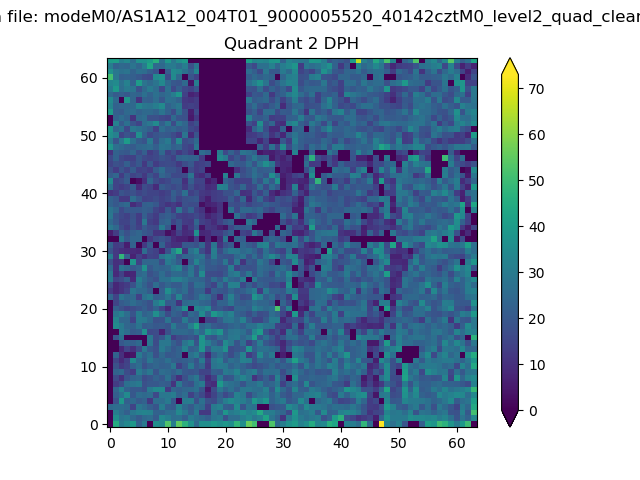 |
Quadrant C |
| Plot type | Count rate plots | Images |
|---|---|---|
| Comparison with Poisson distribution Blue bars denote a histogram of data divided into 1 sec bins. Red curve is a Poisson curve with rate = median count rate of data. |
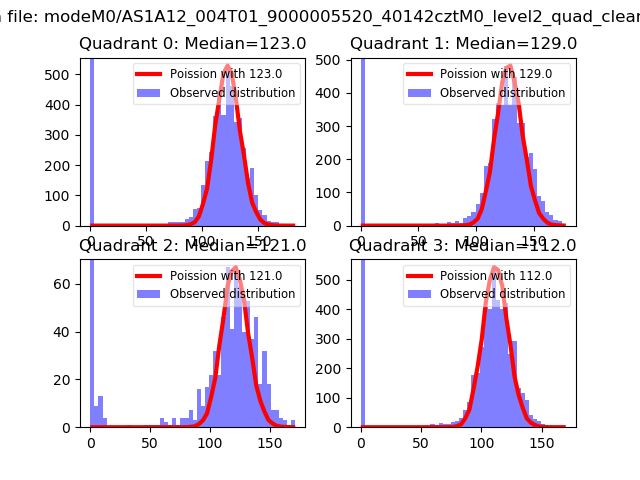 |
 |
| Quadrant-wise count rates Data is divided into 100 sec bins |
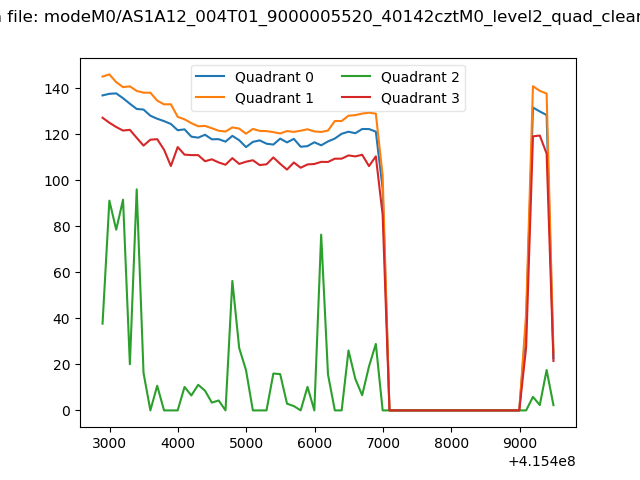 |
|
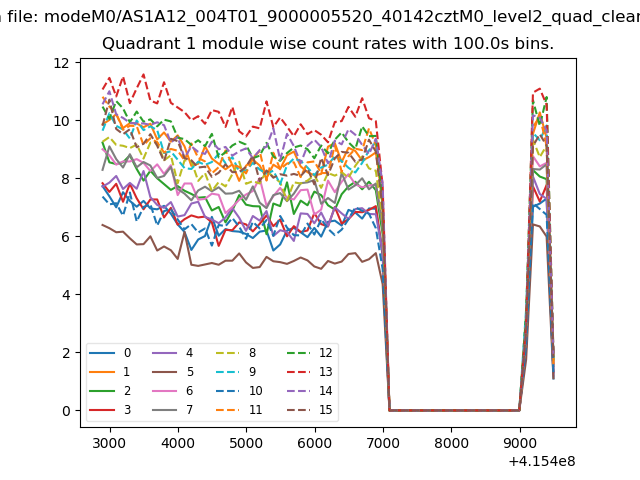
| Module-wise count rates for Quadrant A Data is divided into 100 sec bins |
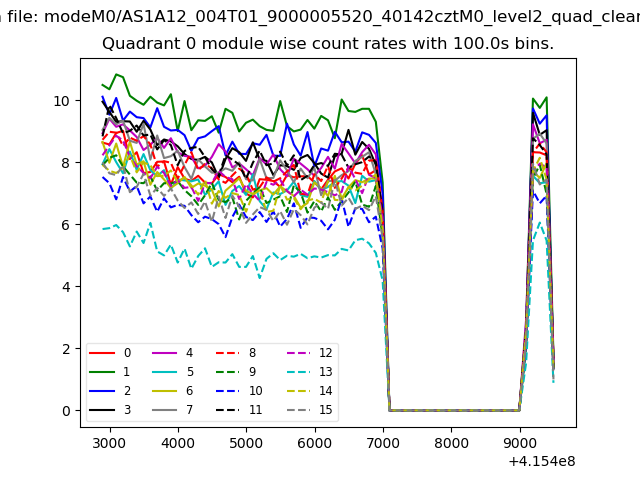 |
 |
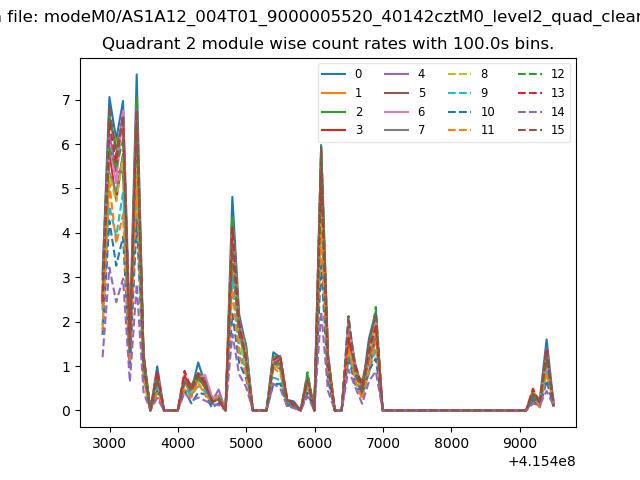
| Module-wise count rates for Quadrant B Data is divided into 100 sec bins |
 |
 |
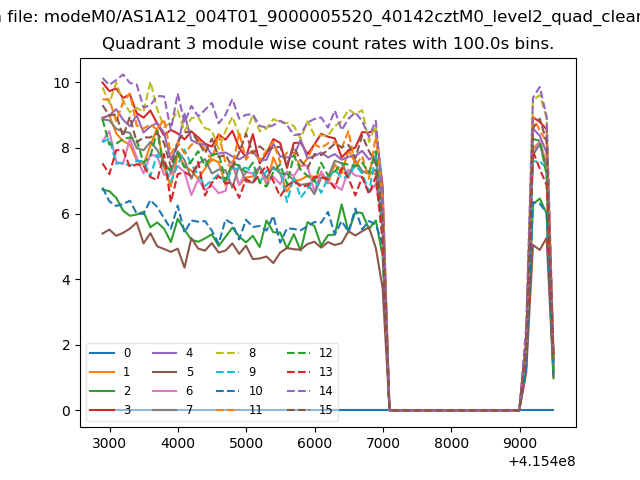
| Module-wise count rates for Quadrant C Data is divided into 100 sec bins |
 |
 |
| Module-wise count rates for Quadrant D Data is divided into 100 sec bins |
 |
 |
| Parameter | Plot |
|---|---|
| CZT HV Monitor |  |
| D_VDD | 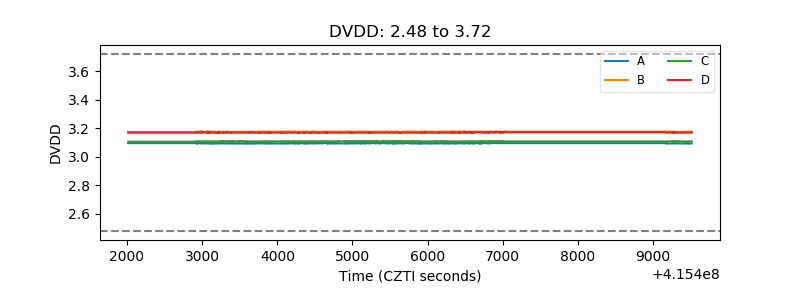 |
| Temperature 1 | 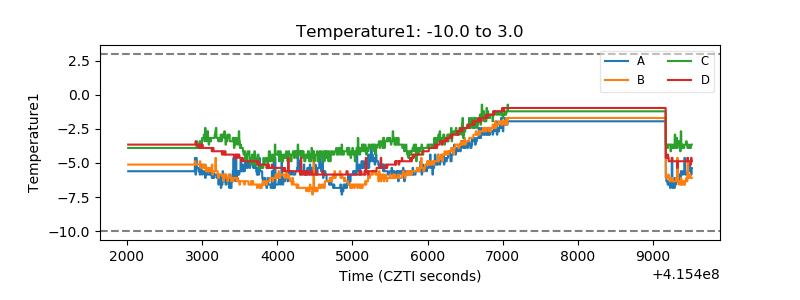 |
| Veto HV Monitor | 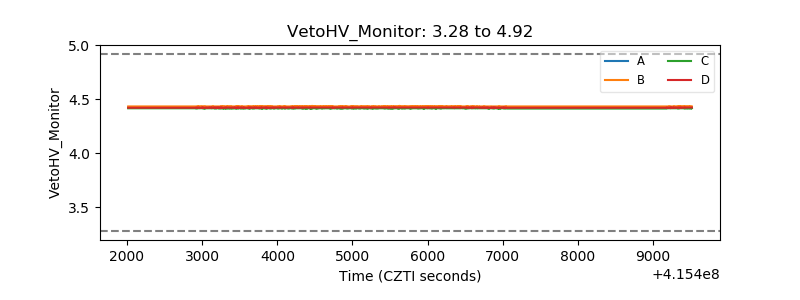 |
| Veto LLD | 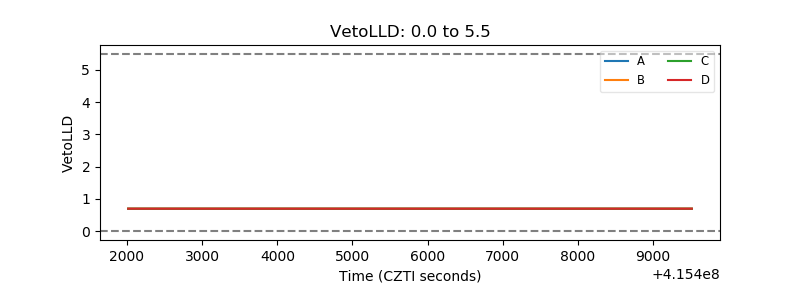 |
| Alpha Counter | 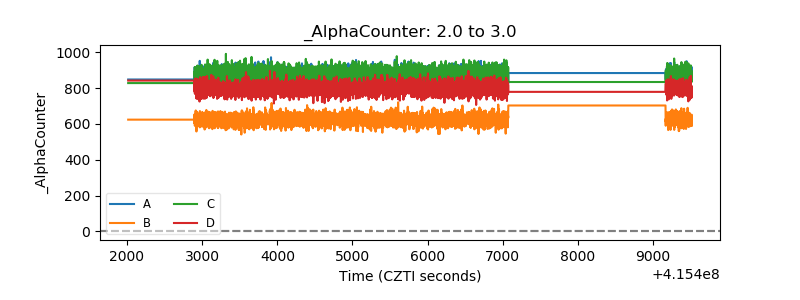 |
| _CPM_Rate | 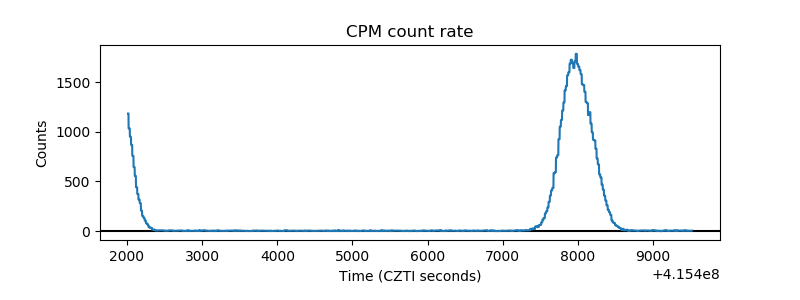 |
| CZT Counter | 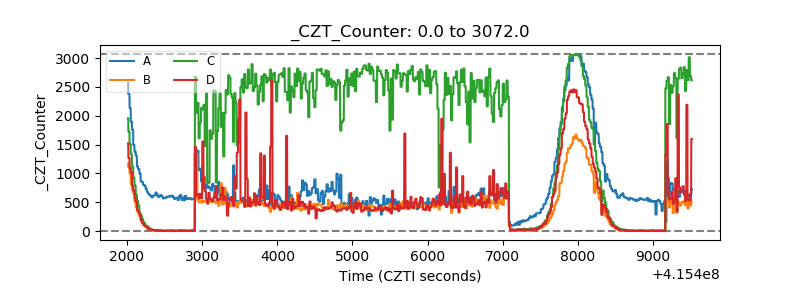 |
| +2.5 Volts monitor | 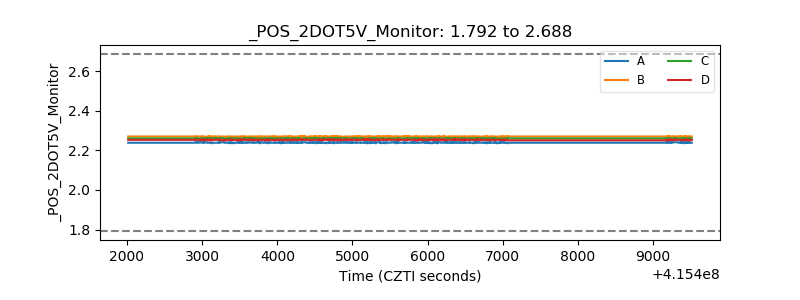 |
| +5 Volts monitor | 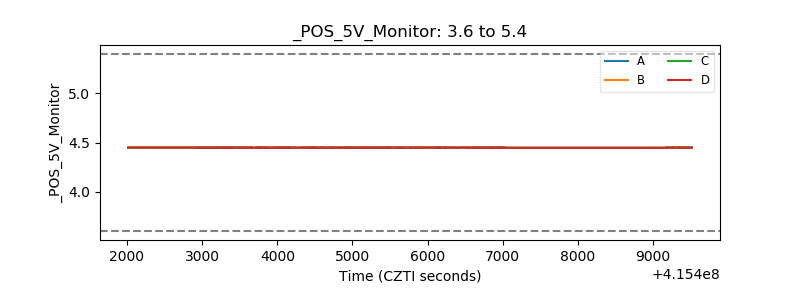 |
| _ROLL_ROT | 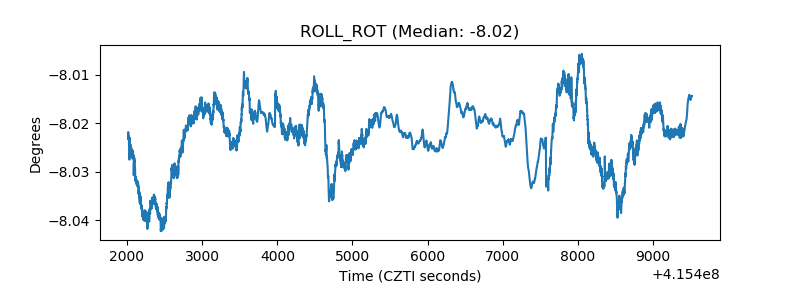 |
| _Roll_DEC | 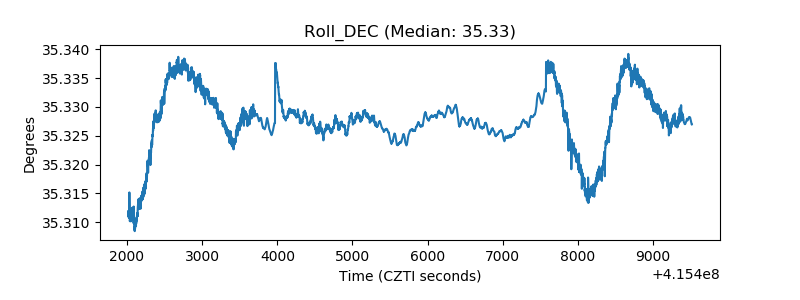 |
| _Roll_RA | 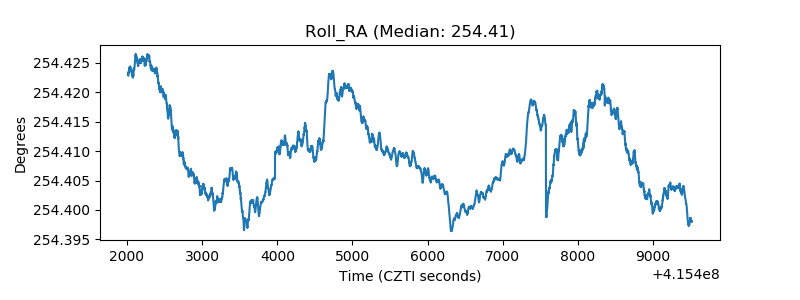 |
| Veto Counter | 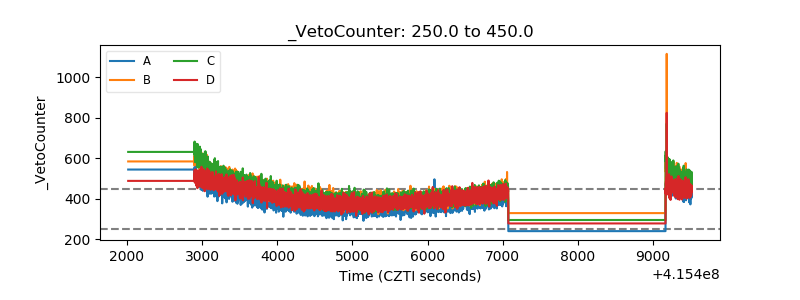 |