| Param | Original file | Final file |
|---|---|---|
| Filename | modeM0/AS1A12_004T01_9000005520_40143cztM0_level2.fits | modeM0/AS1A12_004T01_9000005520_40143cztM0_level2_quad_clean.evt |
| Size (bytes) | 43,470,720 | 5,518,080 |
| Size | 41.5 MB | 5.3 MB |
| Events in quadrant A | 268,589 | 44,904 |
| Events in quadrant B | 175,093 | 48,492 |
| Events in quadrant C | 884,365 | 1,464 |
| Events in quadrant D | 250,277 | 39,786 |
| Mode M0 | |||
|---|---|---|---|
| Quadrant | BADHDUFLAG | Total packets | Discarded packets |
| A | 0 | 1093 | 1 |
| B | 0 | 711 | 1 |
| C | 0 | 2875 | 1 |
| D | 0 | 969 | 1 |
| Mode M9 | |||
|---|---|---|---|
| Quadrant | BADHDUFLAG | Total packets | Discarded packets |
| A | 0 | 7 | 0 |
| B | 0 | 7 | 0 |
| C | 0 | 7 | 0 |
| D | 0 | 8 | 0 |
| Mode SS | |||
|---|---|---|---|
| Quadrant | BADHDUFLAG | Total packets | Discarded packets |
| A | 0 | 8 | 0 |
| B | 0 | 8 | 0 |
| C | 0 | 8 | 0 |
| D | 0 | 8 | 0 |
| Quadrant | Total seconds | Saturated seconds | Saturation percentage |
|---|---|---|---|
| A | 351 | 6 | 1.709402% |
| B | 351 | 2 | 0.569801% |
| C | 351 | 337 | 96.011396% |
| D | 351 | 13 | 3.703704% |
Noise dominated data is calculated using 1-second bins in cleaned event files. If a bin has >2000 counts, and if more than 50% of those come from <1% of pixels, then it is considered to be noise-dominated and hence unusable.
| Quadrant | # 1 sec bins | Bins with >0 counts | Bins with >2000 counts | High rate bins dominated by noise | Noise dominated (total time) | Noise dominated (detector-on time) | Marked lightcurve |
|---|---|---|---|---|---|---|---|
| A | 351 | 351 | 4 | 4 | 1.14% | 1.14% | 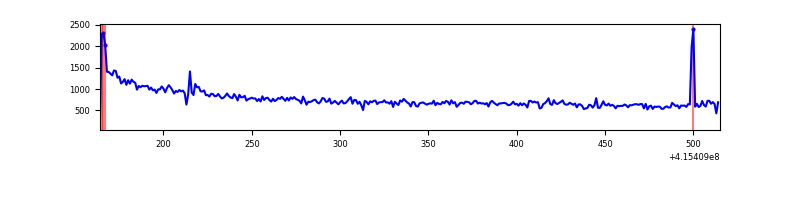 |
| B | 351 | 351 | 0 | 0 | 0.00% | 0.00% | 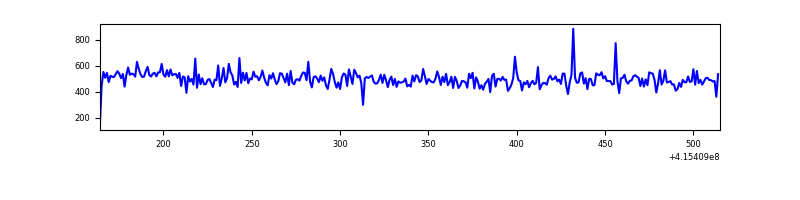 |
| C | 350 | 350 | 329 | 329 | 94.00% | 94.00% | 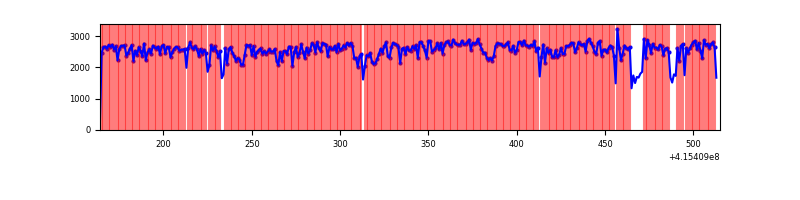 |
| D | 351 | 351 | 11 | 11 | 3.13% | 3.13% | 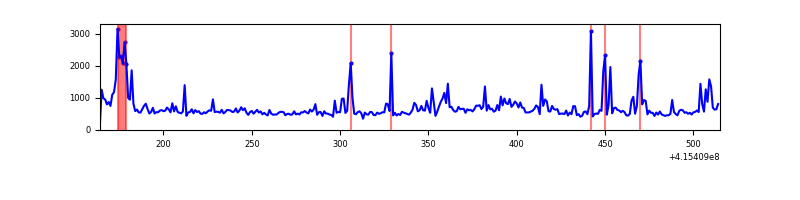 |
Top three noisy pixels from each quadrant. If the there are fewer than three noisy pixels in the level2.evt file, extra rows are filled as -1
| Pixel properties | Quadrant properties | ||||||
|---|---|---|---|---|---|---|---|
| Quadrant | DetID | PixID | Counts | Sigma | Mean | Median | Sigma |
| A | 10 | 83 | 92376 | 8600.28 | 42 | 41 | 10.7 |
| A | 9 | 143 | 4354 | 401.72 | 42 | 41 | 10.7 |
| A | 12 | 189 | 3393 | 312.21 | 42 | 41 | 10.7 |
| B | 0 | 245 | 1094 | 99.01 | 44 | 43 | 10.6 |
| B | 12 | 111 | 1072 | 96.94 | 44 | 43 | 10.6 |
| B | 11 | 111 | 926 | 83.19 | 44 | 43 | 10.6 |
| C | 9 | 187 | 791265 | 127575.78 | 18 | 18 | 6.2 |
| C | 15 | 214 | 8634 | 1389.19 | 18 | 18 | 6.2 |
| C | 0 | 10 | 6749 | 1085.26 | 18 | 18 | 6.2 |
| D | 13 | 249 | 27633 | 2285.37 | 41 | 40 | 12.1 |
| D | 12 | 0 | 18956 | 1566.7 | 41 | 40 | 12.1 |
| D | 2 | 249 | 15268 | 1261.25 | 41 | 40 | 12.1 |
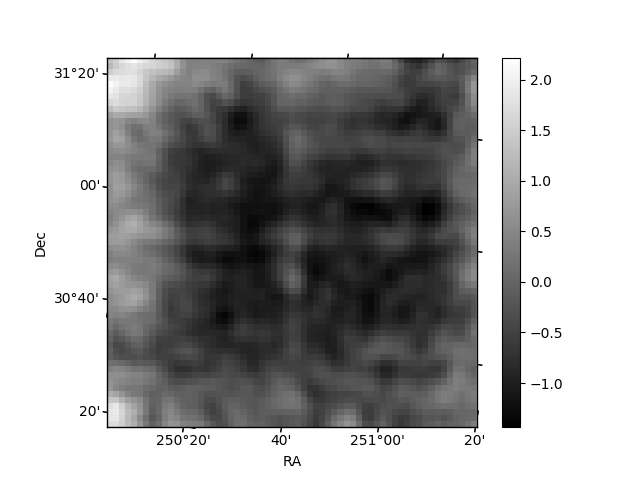
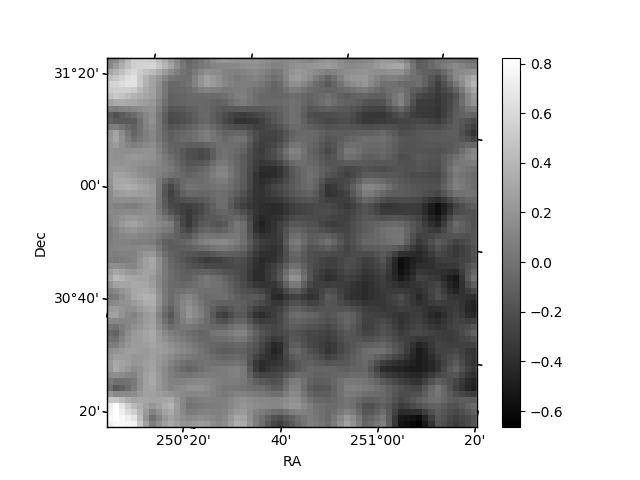
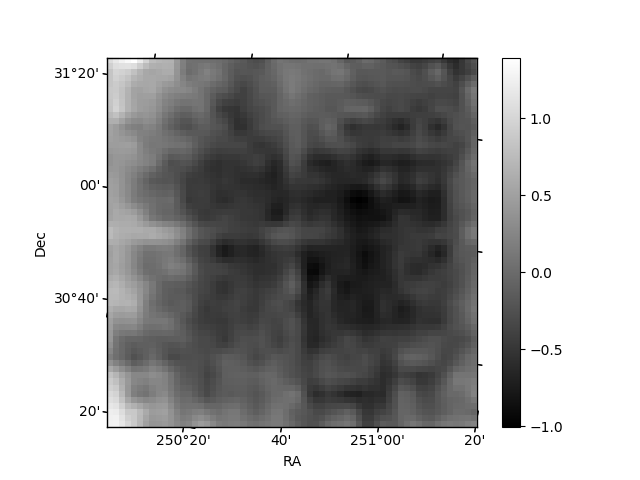
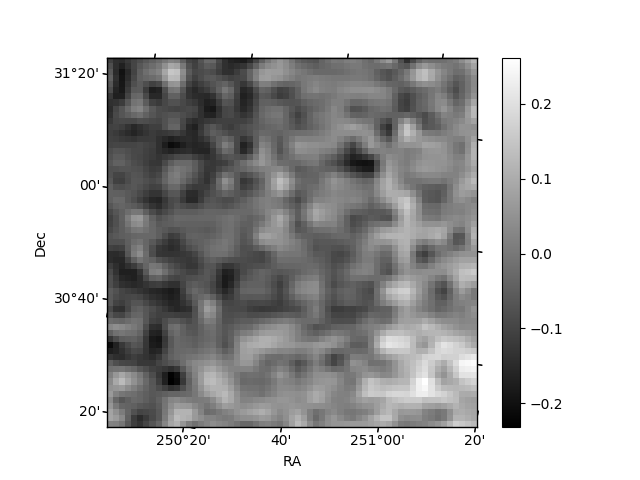
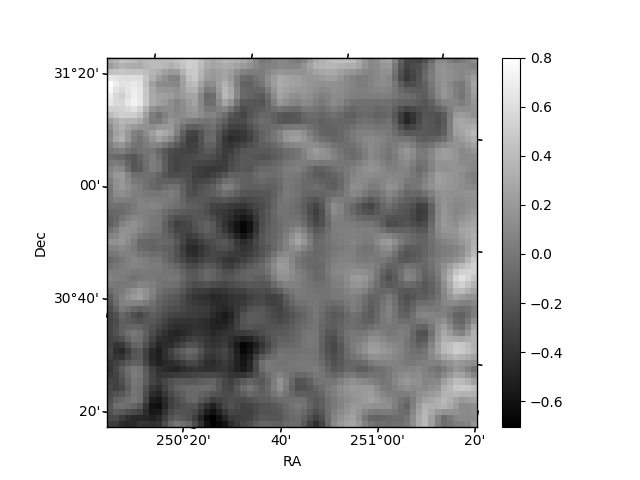
Histogram calculated using DETX and DETY for each event in the final _common_clean file
| Quadrant A | 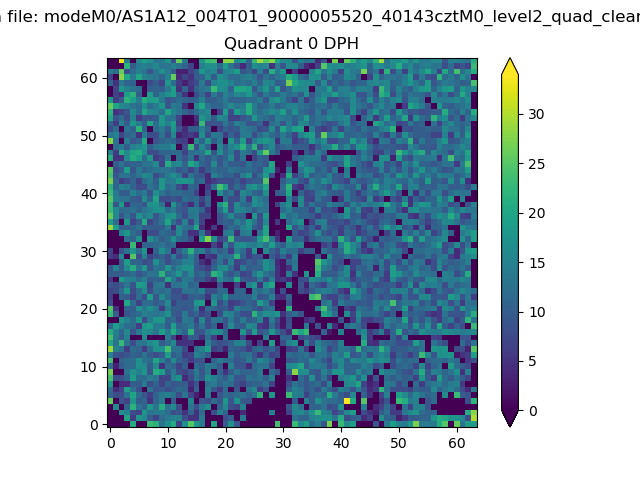 |
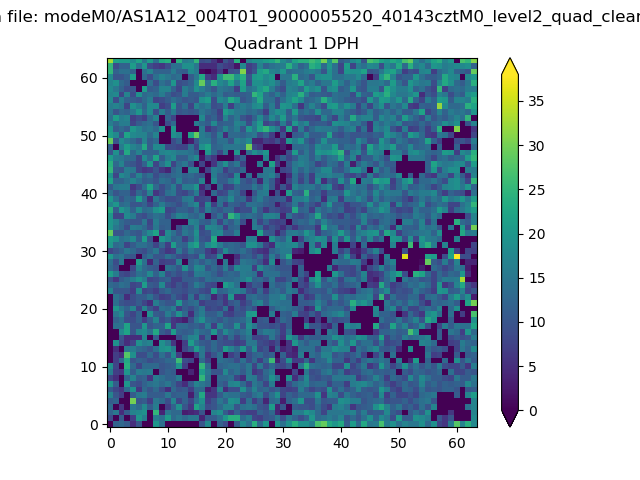 |
Quadrant B |
|---|---|---|---|
| Quadrant D | 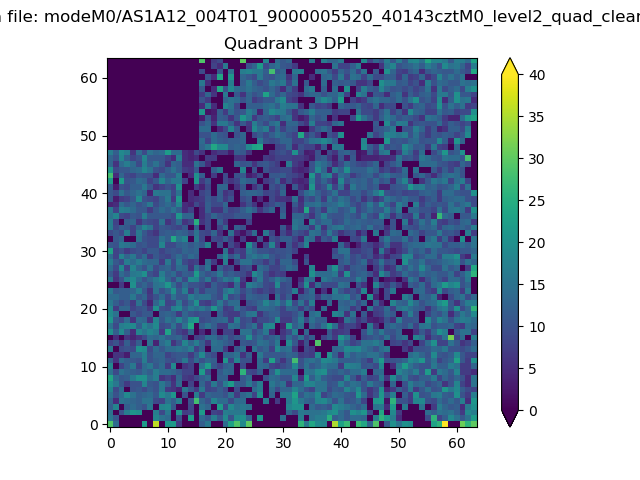 |
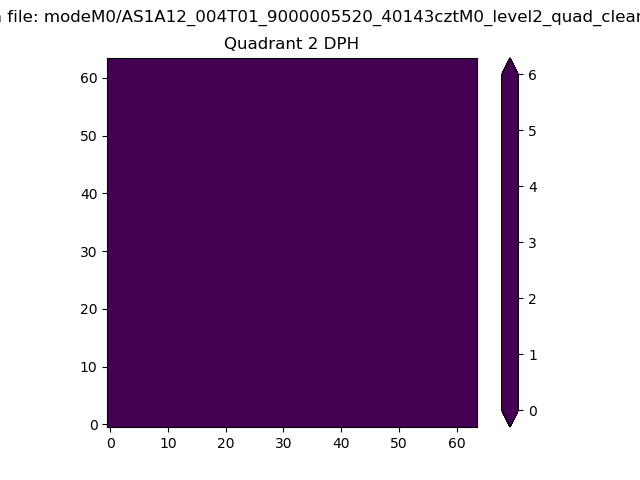 |
Quadrant C |
| Plot type | Count rate plots | Images |
|---|---|---|
| Comparison with Poisson distribution Blue bars denote a histogram of data divided into 1 sec bins. Red curve is a Poisson curve with rate = median count rate of data. |
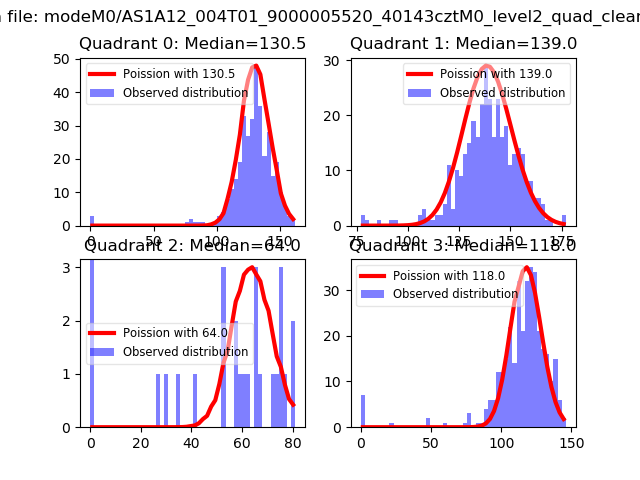 |
 |
| Quadrant-wise count rates Data is divided into 100 sec bins |
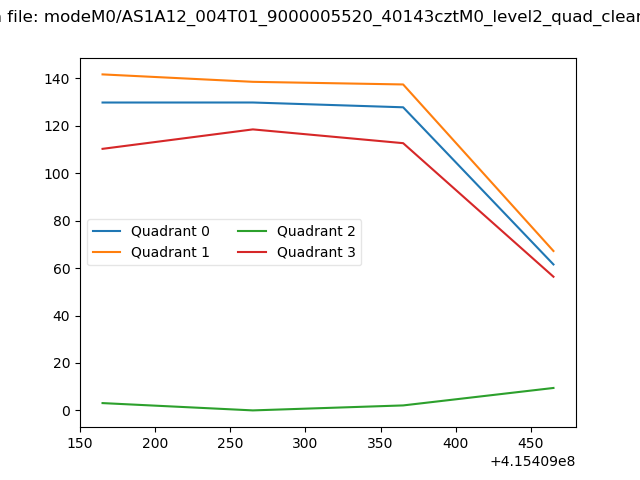 |
|
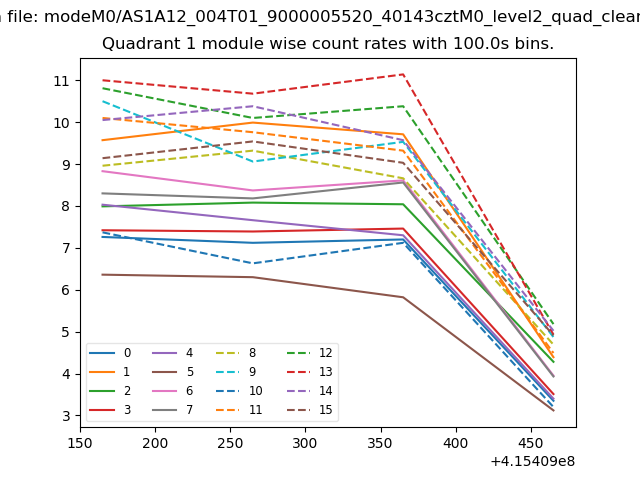
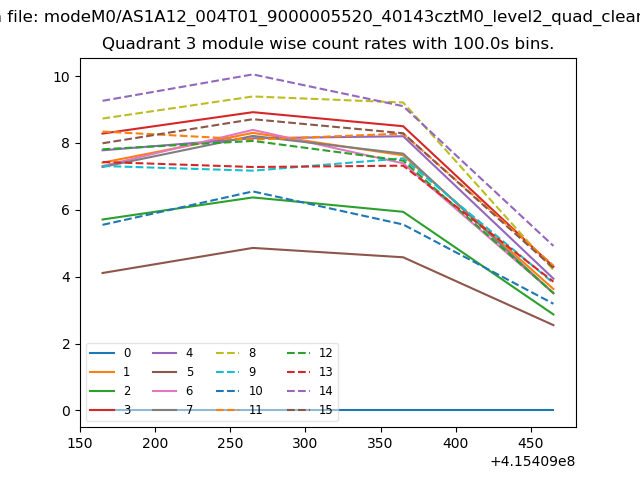
| Module-wise count rates for Quadrant A Data is divided into 100 sec bins |
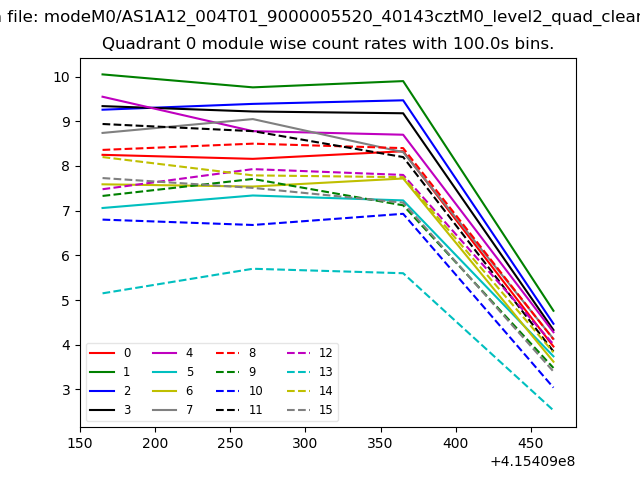 |
 |
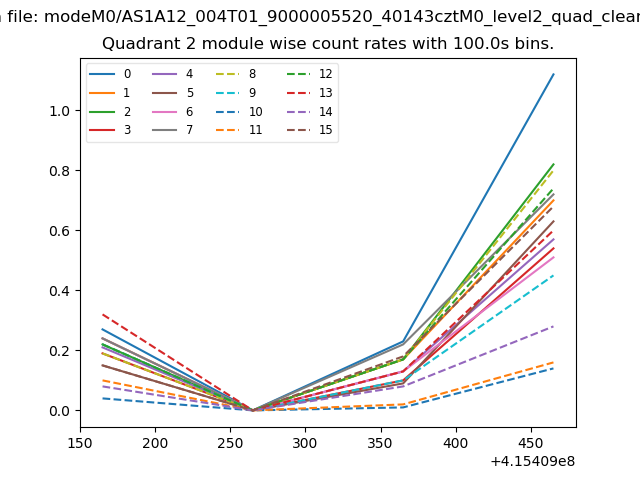
| Module-wise count rates for Quadrant B Data is divided into 100 sec bins |
 |
 |
| Module-wise count rates for Quadrant C Data is divided into 100 sec bins |
 |
 |
| Module-wise count rates for Quadrant D Data is divided into 100 sec bins |
 |
 |
| Parameter | Plot |
|---|---|
| CZT HV Monitor | 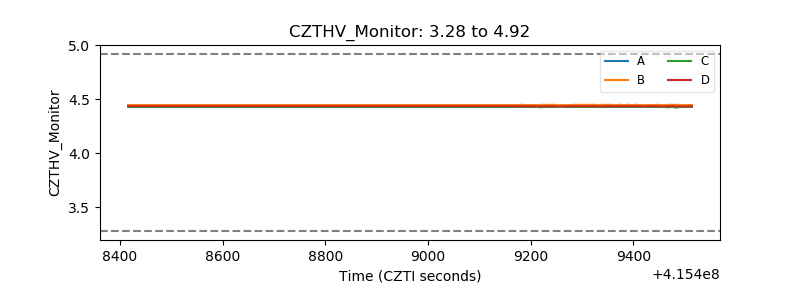 |
| D_VDD | 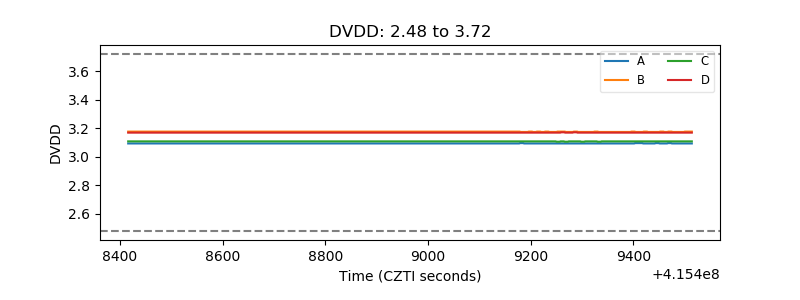 |
| Temperature 1 | 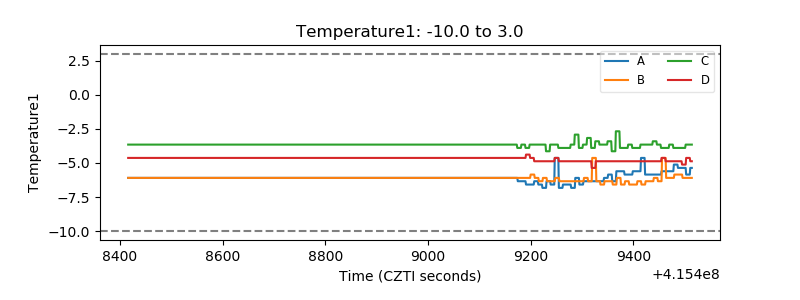 |
| Veto HV Monitor | 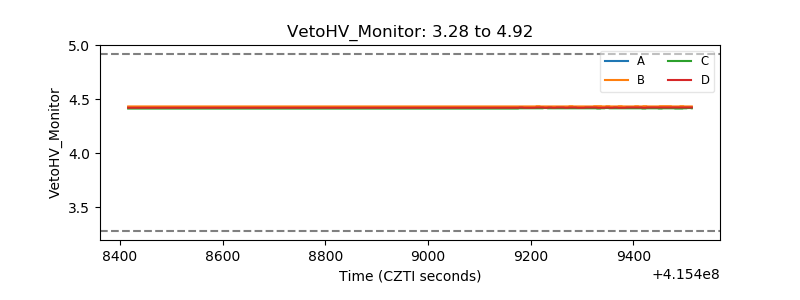 |
| Veto LLD | 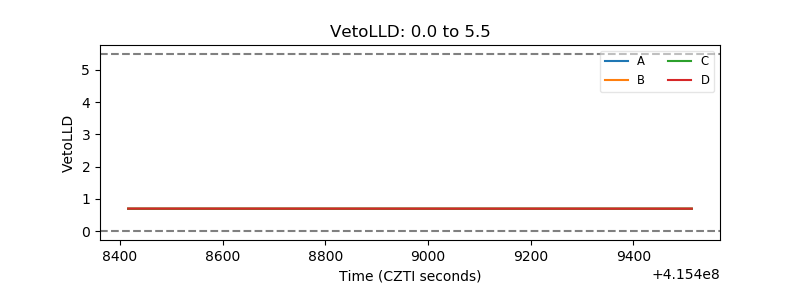 |
| Alpha Counter | 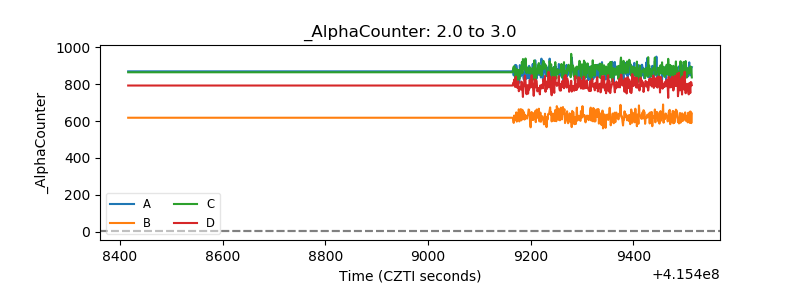 |
| _CPM_Rate | 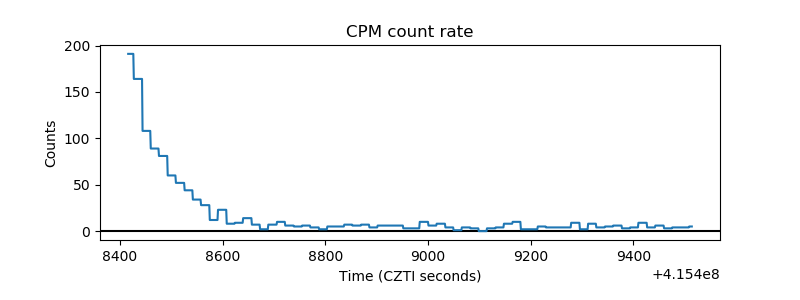 |
| CZT Counter | 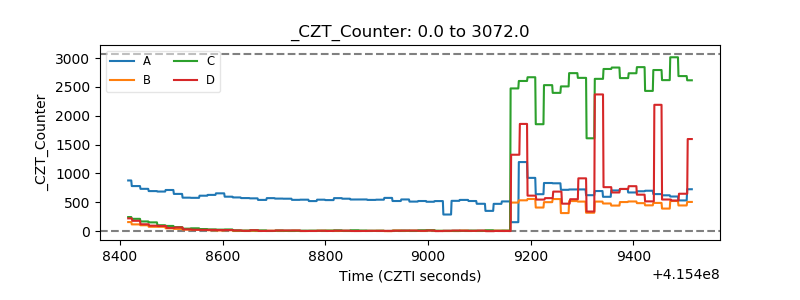 |
| +2.5 Volts monitor | 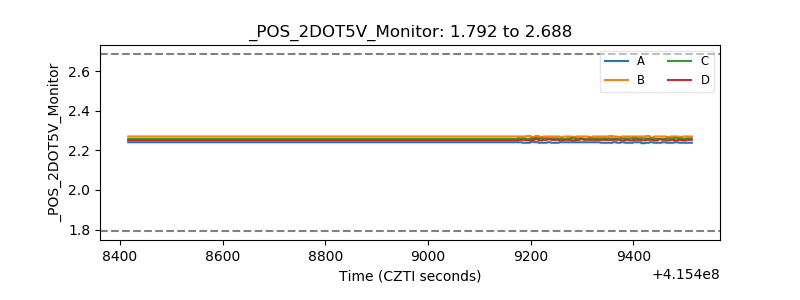 |
| +5 Volts monitor |  |
| _ROLL_ROT | 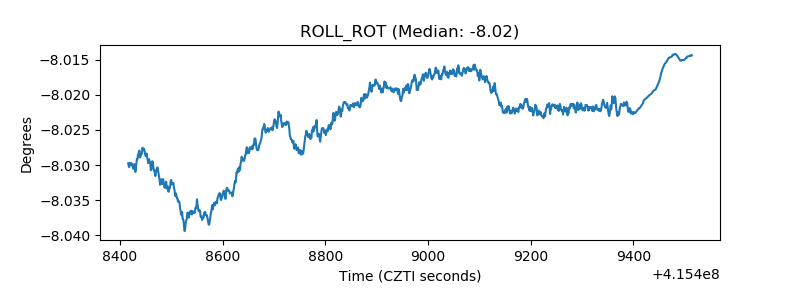 |
| _Roll_DEC | 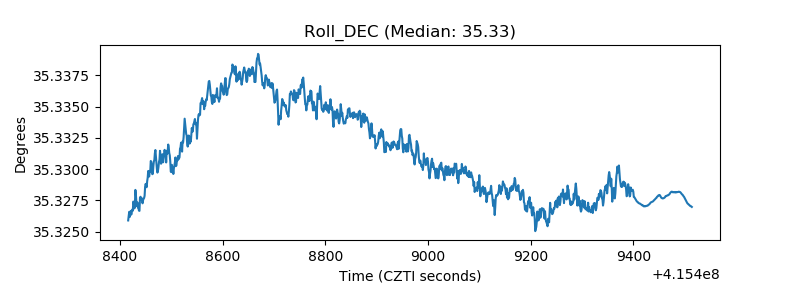 |
| _Roll_RA | 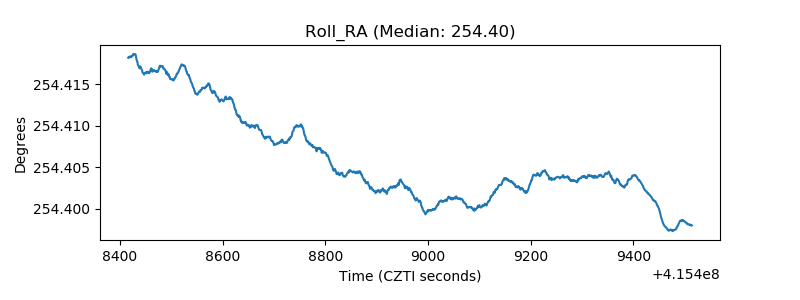 |
| Veto Counter | 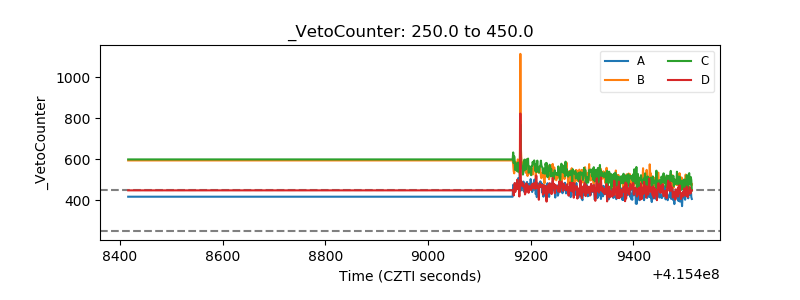 |