| Param | Original file | Final file |
|---|---|---|
| Filename | modeM0/AS1A12_042T01_9000005522_40142cztM0_level2.fits | modeM0/AS1A12_042T01_9000005522_40142cztM0_level2_quad_clean.evt |
| Size (bytes) | 12,268,800 | 1,013,760 |
| Size | 11.7 MB | 990.0 KB |
| Events in quadrant A | 58,729 | 3,998 |
| Events in quadrant B | 51,094 | 4,935 |
| Events in quadrant C | 273,448 | 869 |
| Events in quadrant D | 57,238 | 4,018 |
| Mode SS | |||
|---|---|---|---|
| Quadrant | BADHDUFLAG | Total packets | Discarded packets |
| A | 0 | 2 | 0 |
| B | 0 | 2 | 0 |
| C | 0 | 2 | 0 |
| D | 0 | 2 | 0 |
| Mode M0 | |||
|---|---|---|---|
| Quadrant | BADHDUFLAG | Total packets | Discarded packets |
| A | 0 | 260 | 1 |
| B | 0 | 253 | 0 |
| C | 0 | 897 | 0 |
| D | 0 | 277 | 0 |
| Quadrant | Total seconds | Saturated seconds | Saturation percentage |
|---|---|---|---|
| A | 126 | 0 | 0.000000% |
| B | 126 | 0 | 0.000000% |
| C | 126 | 81 | 64.285714% |
| D | 126 | 1 | 0.793651% |
Noise dominated data is calculated using 1-second bins in cleaned event files. If a bin has >2000 counts, and if more than 50% of those come from <1% of pixels, then it is considered to be noise-dominated and hence unusable.
| Quadrant | # 1 sec bins | Bins with >0 counts | Bins with >2000 counts | High rate bins dominated by noise | Noise dominated (total time) | Noise dominated (detector-on time) | Marked lightcurve |
|---|---|---|---|---|---|---|---|
| A | 126 | 126 | 1 | 1 | 0.79% | 0.79% | 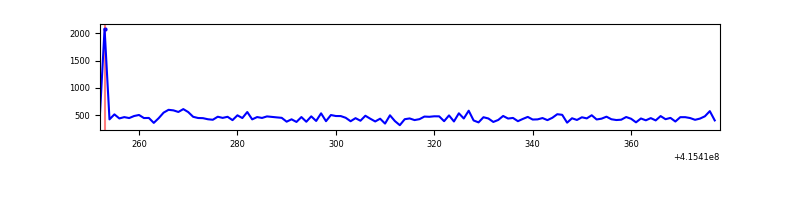 |
| B | 126 | 126 | 0 | 0 | 0.00% | 0.00% | 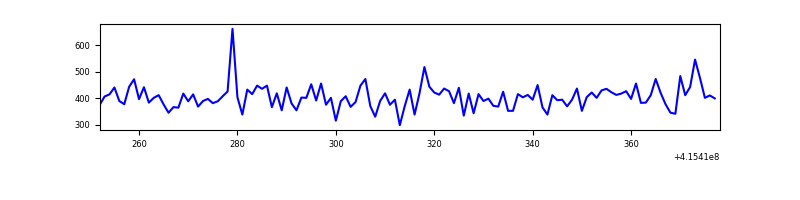 |
| C | 125 | 125 | 88 | 88 | 70.40% | 70.40% | 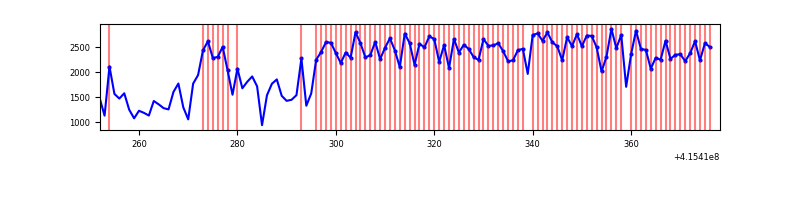 |
| D | 126 | 126 | 1 | 1 | 0.79% | 0.79% | 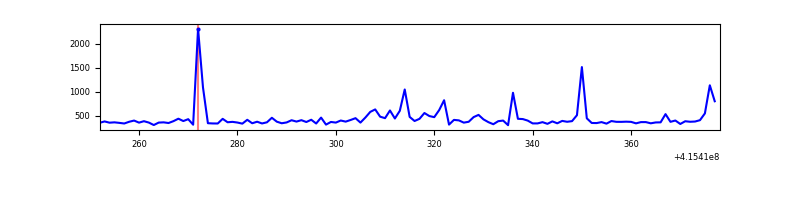 |
Top three noisy pixels from each quadrant. If the there are fewer than three noisy pixels in the level2.evt file, extra rows are filled as -1
| Pixel properties | Quadrant properties | ||||||
|---|---|---|---|---|---|---|---|
| Quadrant | DetID | PixID | Counts | Sigma | Mean | Median | Sigma |
| A | 10 | 83 | 6886 | 1610.22 | 12 | 12 | 4.3 |
| A | 9 | 143 | 1794 | 417.43 | 12 | 12 | 4.3 |
| A | 6 | 10 | 1759 | 409.23 | 12 | 12 | 4.3 |
| B | 4 | 171 | 552 | 125.45 | 12 | 12 | 4.3 |
| B | 12 | 111 | 310 | 69.23 | 12 | 12 | 4.3 |
| B | 14 | 111 | 259 | 57.38 | 12 | 12 | 4.3 |
| C | 9 | 187 | 226082 | 56866.75 | 10 | 10 | 4.0 |
| C | 15 | 214 | 4114 | 1032.33 | 10 | 10 | 4.0 |
| C | 10 | 20 | 459 | 112.94 | 10 | 10 | 4.0 |
| D | 12 | 0 | 8947 | 2017.97 | 12 | 11 | 4.4 |
| D | 2 | 249 | 913 | 203.69 | 12 | 11 | 4.4 |
| D | 2 | 234 | 625 | 138.66 | 12 | 11 | 4.4 |
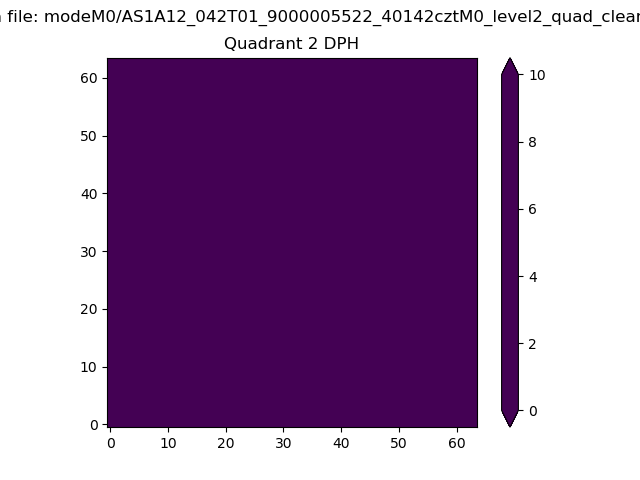
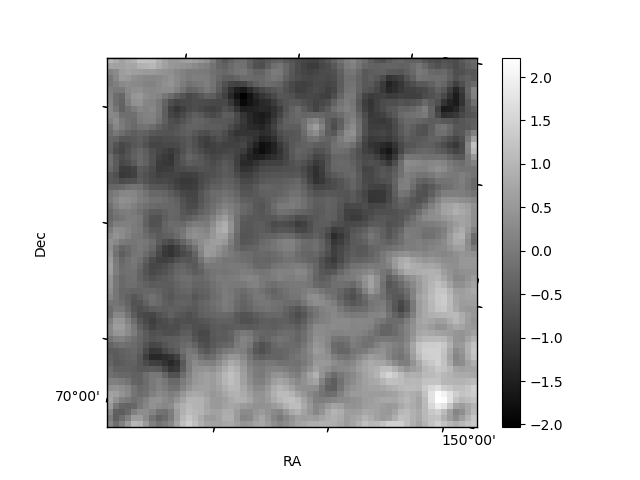
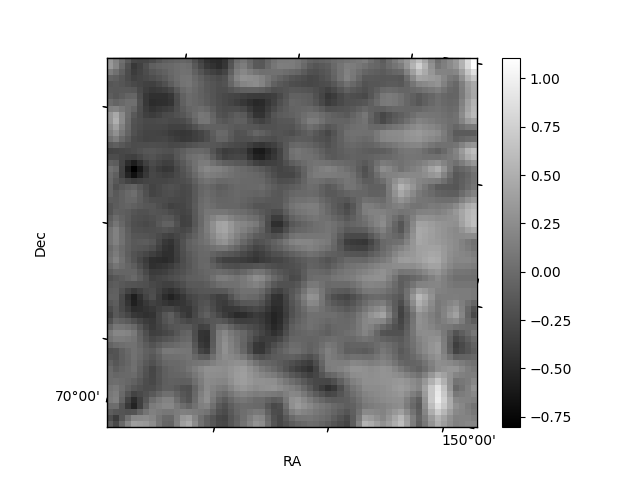
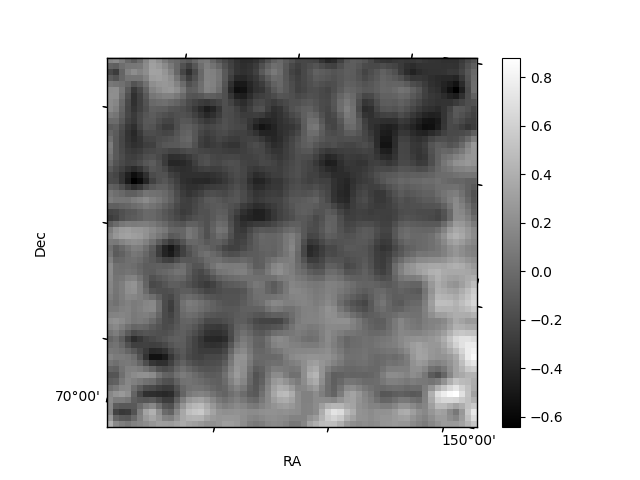
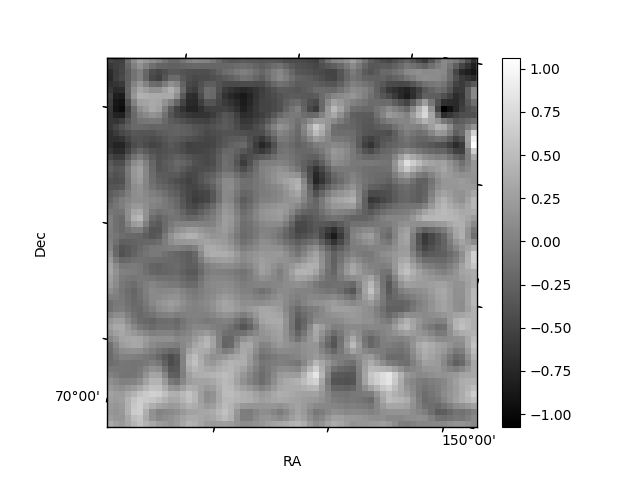
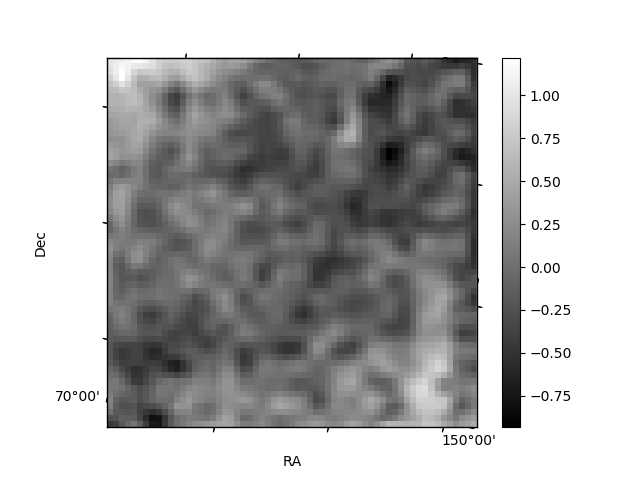
Histogram calculated using DETX and DETY for each event in the final _common_clean file
| Quadrant A | 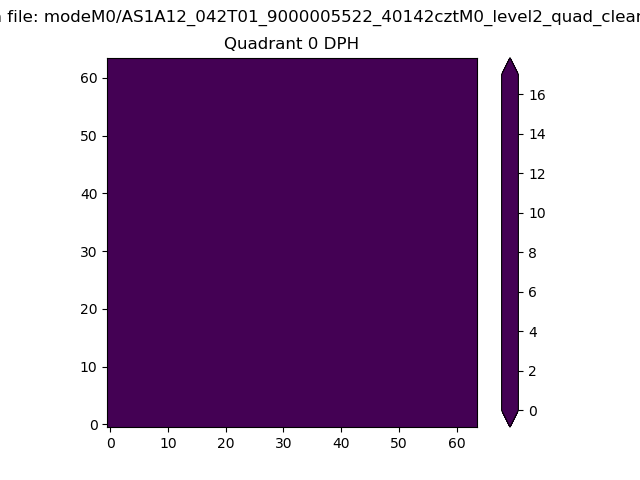 |
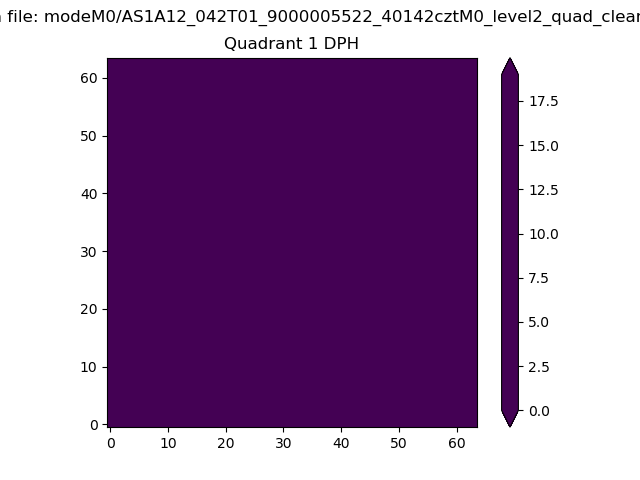 |
Quadrant B |
|---|---|---|---|
| Quadrant D | 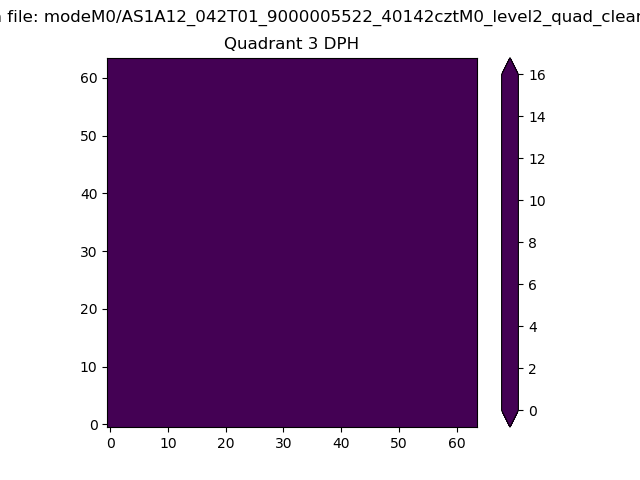 |
 |
Quadrant C |
| Plot type | Count rate plots | Images |
|---|---|---|
| Comparison with Poisson distribution Blue bars denote a histogram of data divided into 1 sec bins. Red curve is a Poisson curve with rate = median count rate of data. |
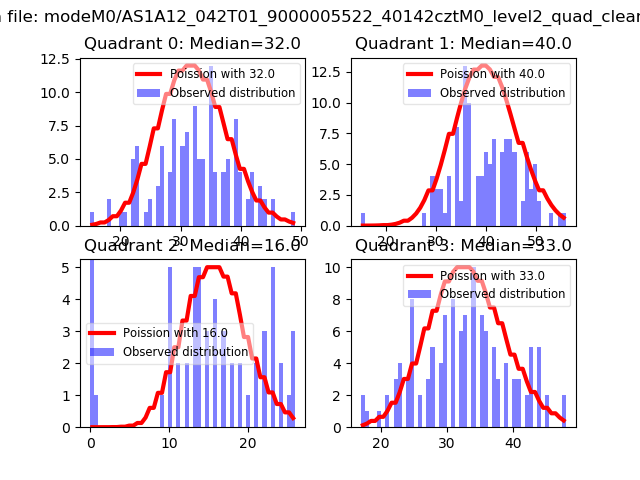 |
 |
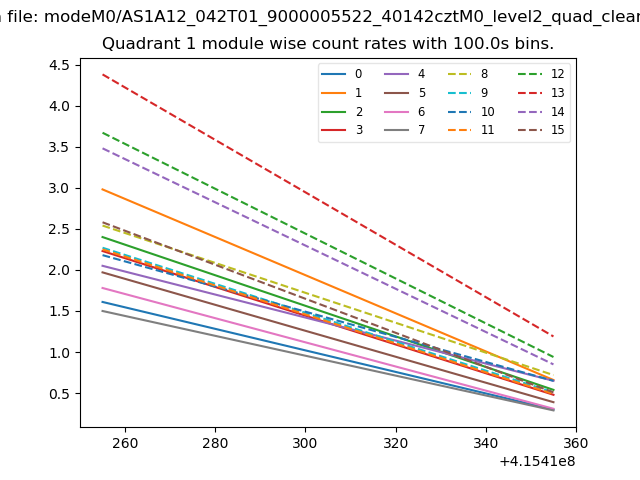
| Quadrant-wise count rates Data is divided into 100 sec bins |
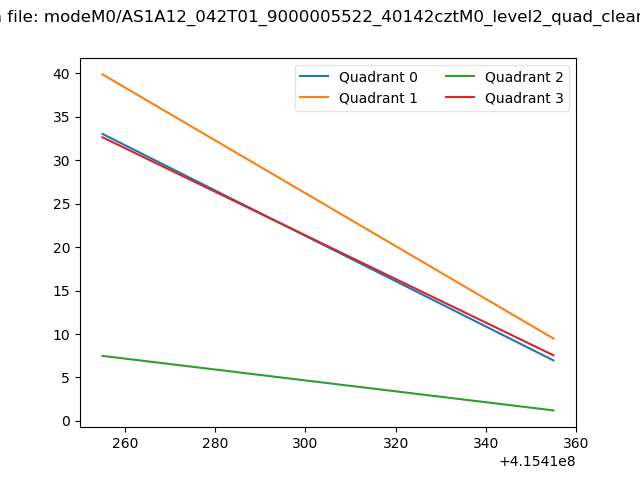 |
|
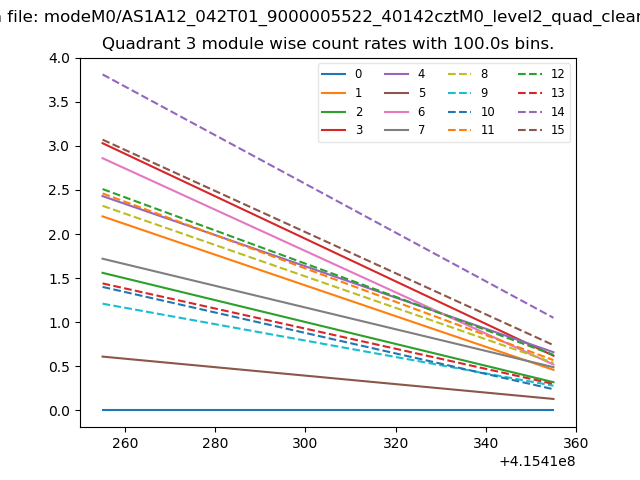
| Module-wise count rates for Quadrant A Data is divided into 100 sec bins |
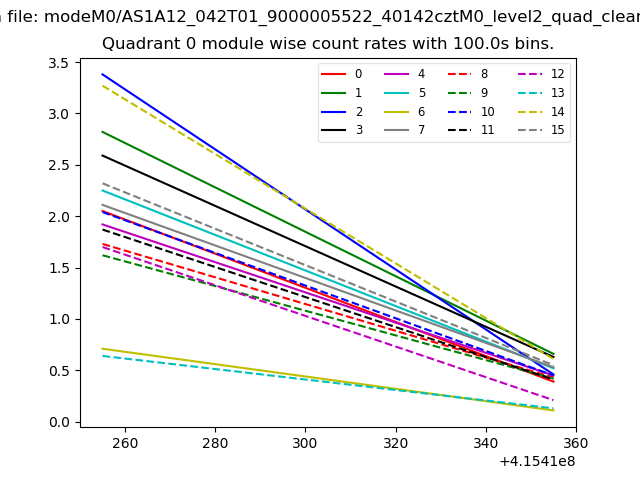 |
 |
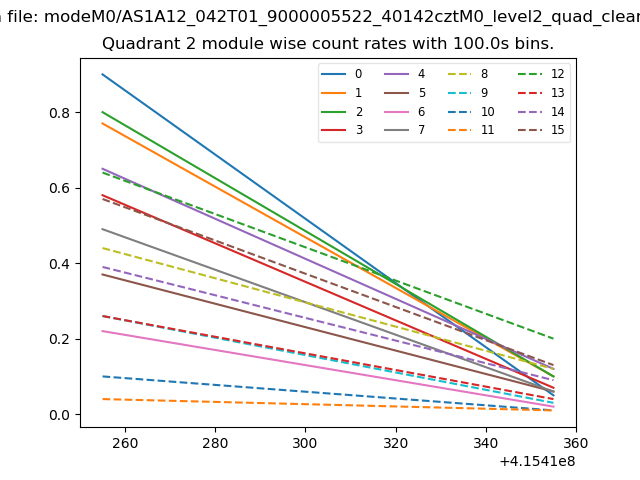
| Module-wise count rates for Quadrant B Data is divided into 100 sec bins |
 |
 |
| Module-wise count rates for Quadrant C Data is divided into 100 sec bins |
 |
 |
| Module-wise count rates for Quadrant D Data is divided into 100 sec bins |
 |
 |
| Parameter | Plot |
|---|---|
| CZT HV Monitor | 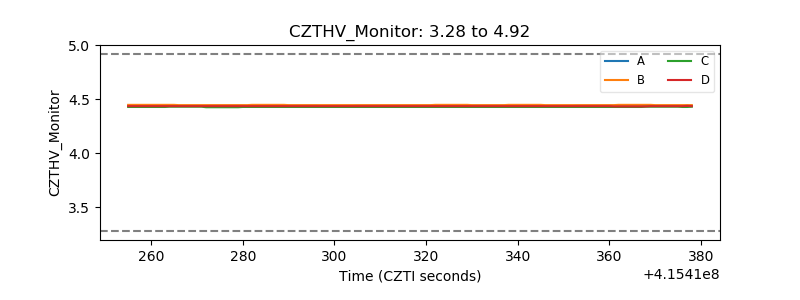 |
| D_VDD | 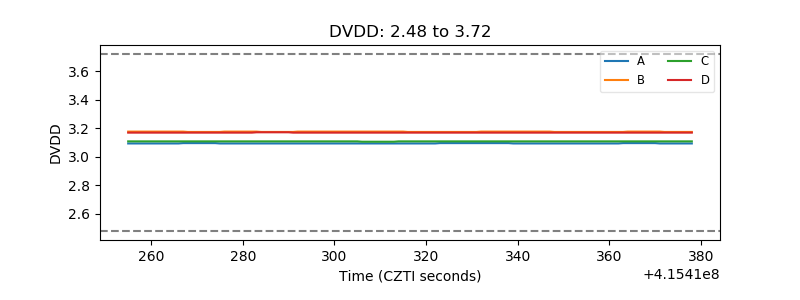 |
| Temperature 1 | 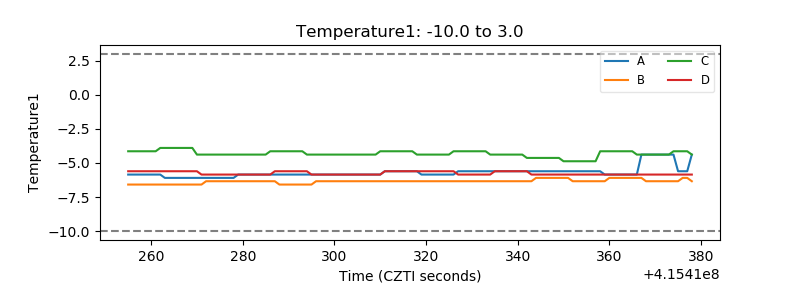 |
| Veto HV Monitor | 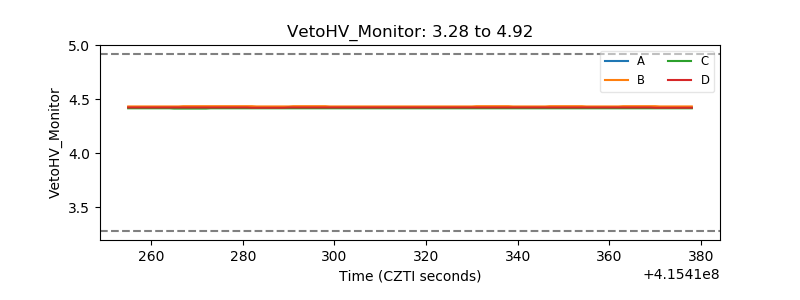 |
| Veto LLD | 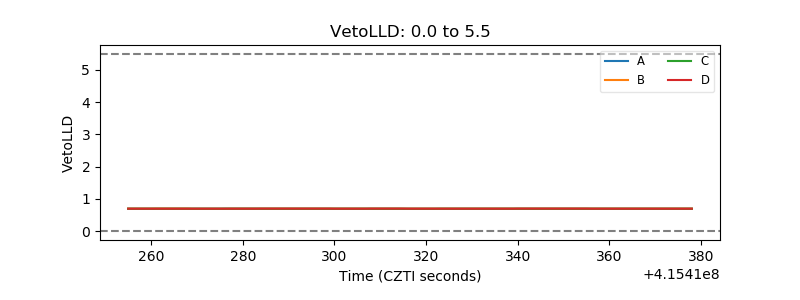 |
| Alpha Counter | 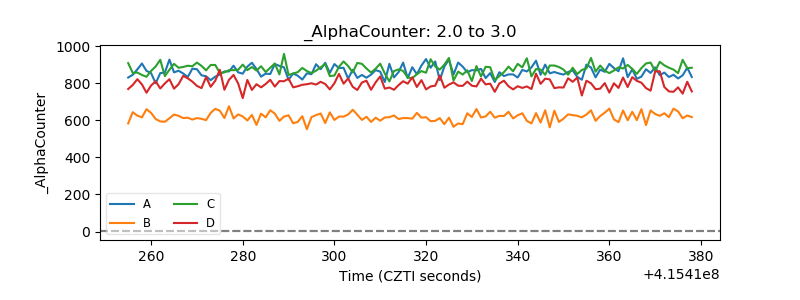 |
| _CPM_Rate | 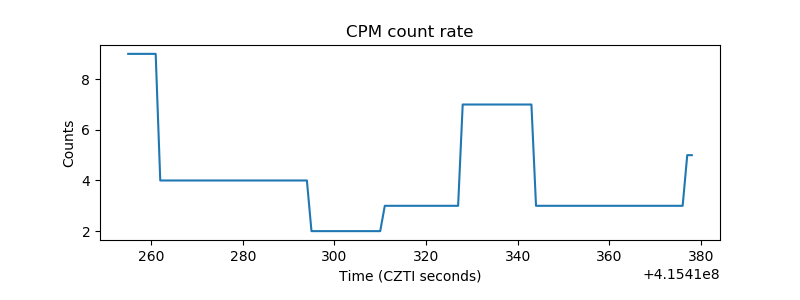 |
| CZT Counter | 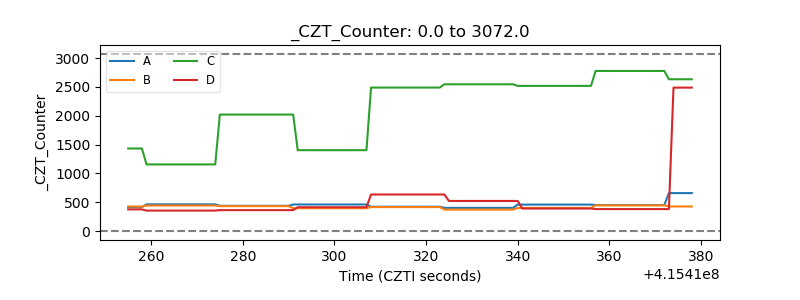 |
| +2.5 Volts monitor | 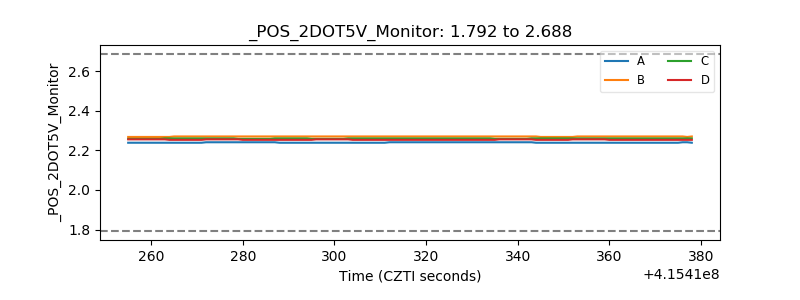 |
| +5 Volts monitor | 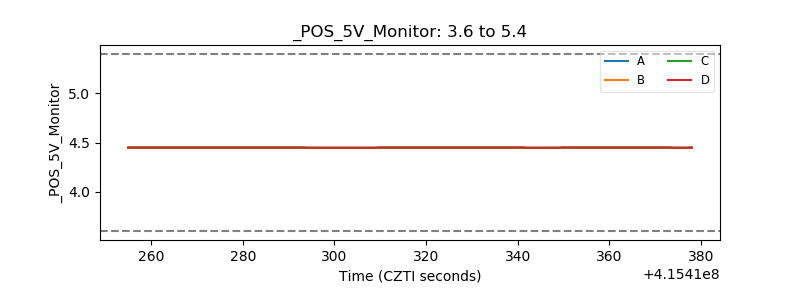 |
| _ROLL_ROT | 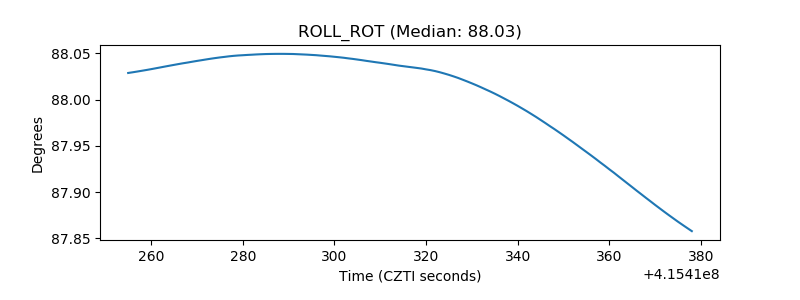 |
| _Roll_DEC | 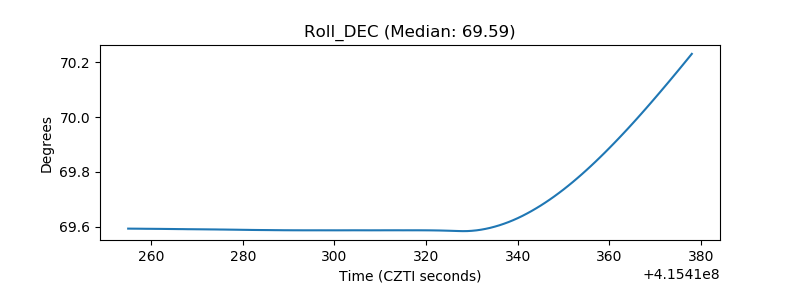 |
| _Roll_RA | 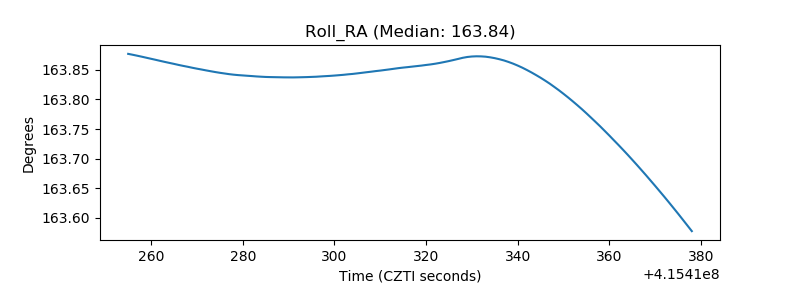 |
| Veto Counter | 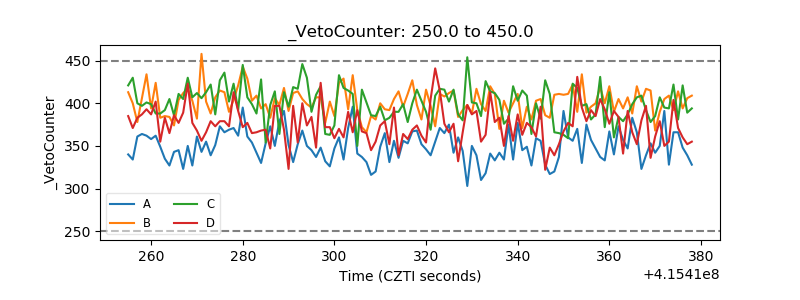 |