| Param | Original file | Final file |
|---|---|---|
| Filename | modeM0/AS1A12_042T01_9000005522_40143cztM0_level2.fits | modeM0/AS1A12_042T01_9000005522_40143cztM0_level2_quad_clean.evt |
| Size (bytes) | 451,382,400 | 52,223,040 |
| Size | 430.5 MB | 49.8 MB |
| Events in quadrant A | 2,048,121 | 445,667 |
| Events in quadrant B | 1,806,900 | 462,964 |
| Events in quadrant C | 9,825,404 | 15,732 |
| Events in quadrant D | 2,725,893 | 384,228 |
| Mode SS | |||
|---|---|---|---|
| Quadrant | BADHDUFLAG | Total packets | Discarded packets |
| A | 0 | 78 | 0 |
| B | 0 | 78 | 0 |
| C | 0 | 78 | 0 |
| D | 0 | 78 | 0 |
| Mode M0 | |||
|---|---|---|---|
| Quadrant | BADHDUFLAG | Total packets | Discarded packets |
| A | 0 | 8544 | 2 |
| B | 0 | 8137 | 1 |
| C | 0 | 31885 | 1 |
| D | 0 | 10884 | 1 |
| Mode M9 | |||
|---|---|---|---|
| Quadrant | BADHDUFLAG | Total packets | Discarded packets |
| A | 0 | 22 | 0 |
| B | 0 | 22 | 0 |
| C | 0 | 22 | 0 |
| D | 0 | 22 | 0 |
| Quadrant | Total seconds | Saturated seconds | Saturation percentage |
|---|---|---|---|
| A | 3868 | 9 | 0.232678% |
| B | 3868 | 7 | 0.180972% |
| C | 3868 | 3758 | 97.156153% |
| D | 3868 | 262 | 6.773526% |
Noise dominated data is calculated using 1-second bins in cleaned event files. If a bin has >2000 counts, and if more than 50% of those come from <1% of pixels, then it is considered to be noise-dominated and hence unusable.
| Quadrant | # 1 sec bins | Bins with >0 counts | Bins with >2000 counts | High rate bins dominated by noise | Noise dominated (total time) | Noise dominated (detector-on time) | Marked lightcurve |
|---|---|---|---|---|---|---|---|
| A | 5991 | 3869 | 5 | 5 | 0.08% | 0.13% | 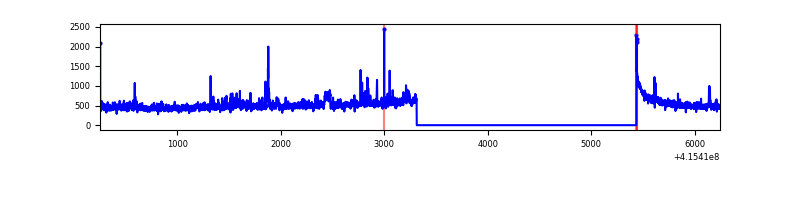 |
| B | 5991 | 3869 | 2 | 2 | 0.03% | 0.05% | 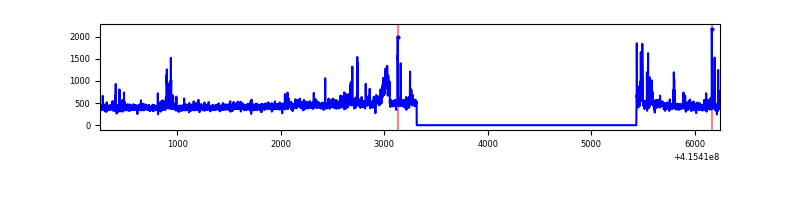 |
| C | 5990 | 3867 | 3744 | 3744 | 62.50% | 96.82% | 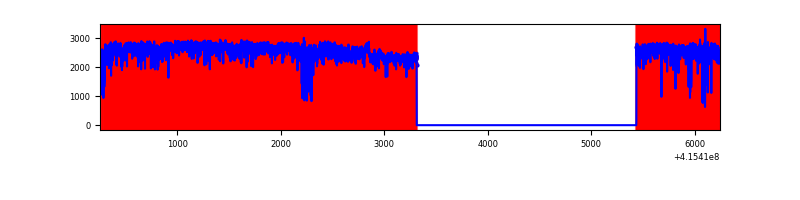 |
| D | 5991 | 3869 | 278 | 278 | 4.64% | 7.19% | 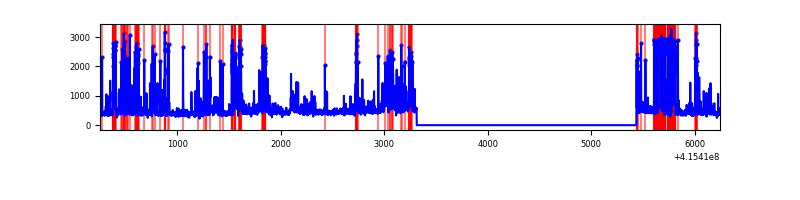 |
Top three noisy pixels from each quadrant. If the there are fewer than three noisy pixels in the level2.evt file, extra rows are filled as -1
| Pixel properties | Quadrant properties | ||||||
|---|---|---|---|---|---|---|---|
| Quadrant | DetID | PixID | Counts | Sigma | Mean | Median | Sigma |
| A | 10 | 83 | 289313 | 3391.28 | 413 | 405 | 85.2 |
| A | 12 | 189 | 94117 | 1100.02 | 413 | 405 | 85.2 |
| A | 6 | 10 | 22558 | 260.04 | 413 | 405 | 85.2 |
| B | 4 | 171 | 103168 | 1302.99 | 414 | 404 | 78.9 |
| B | 4 | 170 | 35921 | 450.34 | 414 | 404 | 78.9 |
| B | 0 | 190 | 24699 | 308.05 | 414 | 404 | 78.9 |
| C | 9 | 187 | 9223240 | 284980.17 | 135 | 136 | 32.4 |
| C | 15 | 214 | 57925 | 1785.59 | 135 | 136 | 32.4 |
| C | 0 | 10 | 5857 | 176.77 | 135 | 136 | 32.4 |
| D | 12 | 0 | 432485 | 4654.76 | 383 | 372 | 92.8 |
| D | 12 | 227 | 338612 | 3643.55 | 383 | 372 | 92.8 |
| D | 1 | 47 | 307799 | 3311.63 | 383 | 372 | 92.8 |
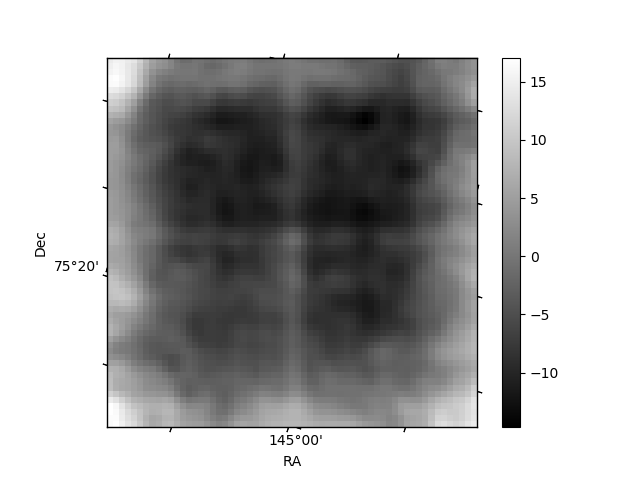
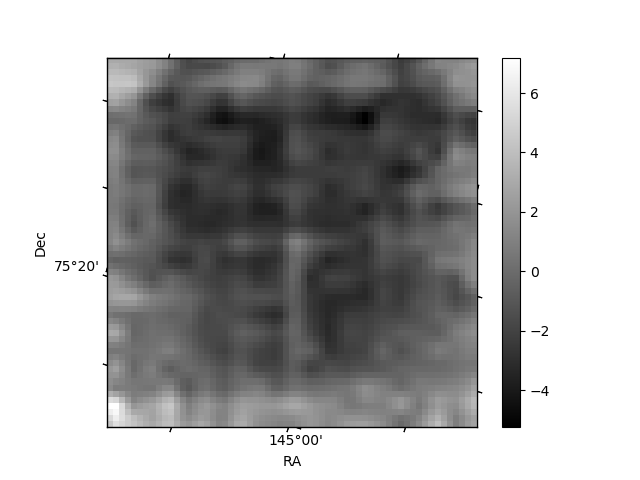
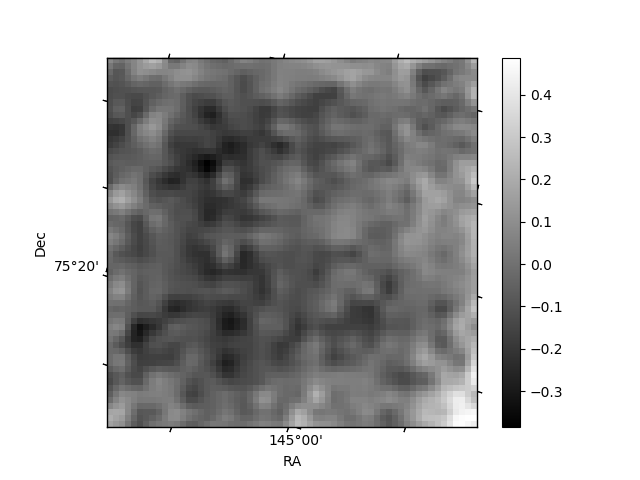
Histogram calculated using DETX and DETY for each event in the final _common_clean file
| Quadrant A | 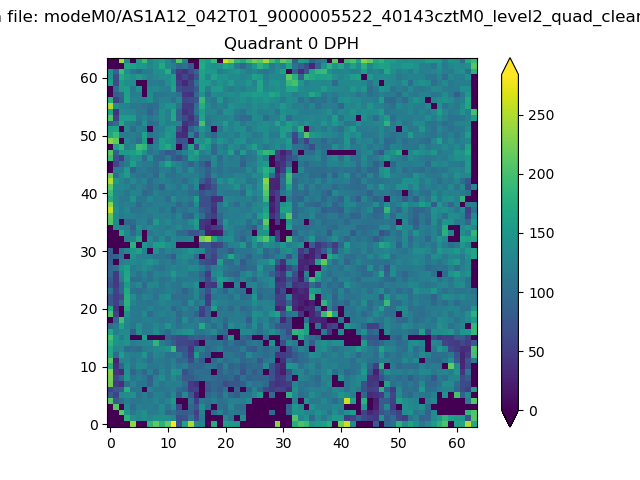 |
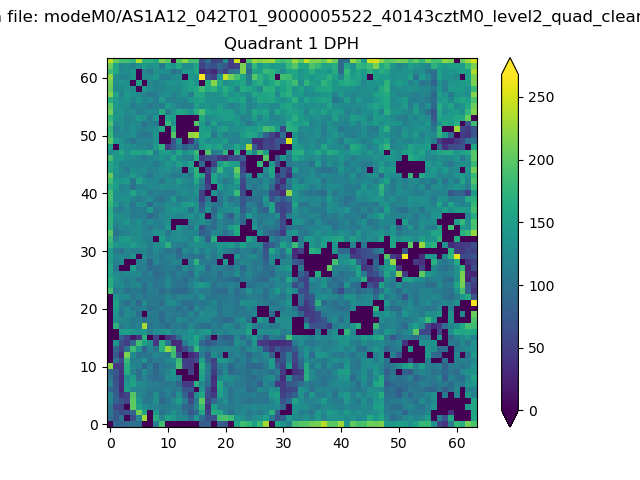 |
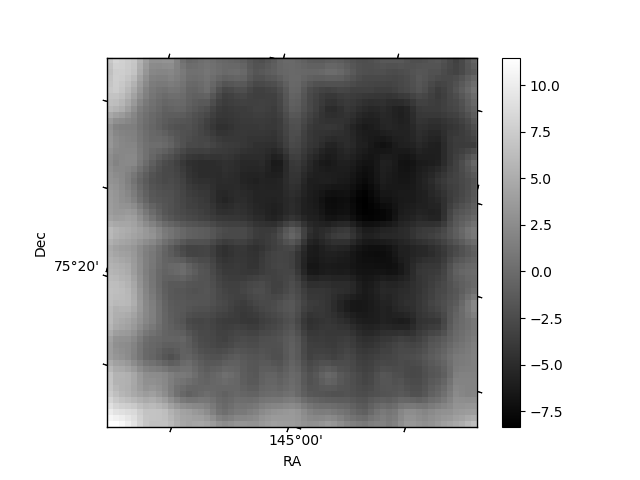
Quadrant B |
|---|---|---|---|
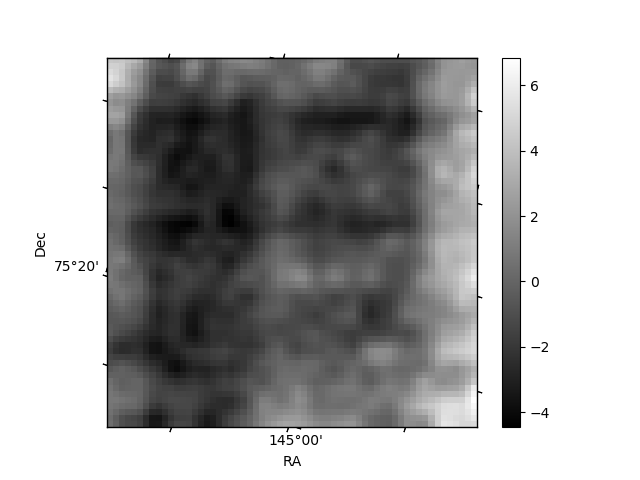
| Quadrant D | 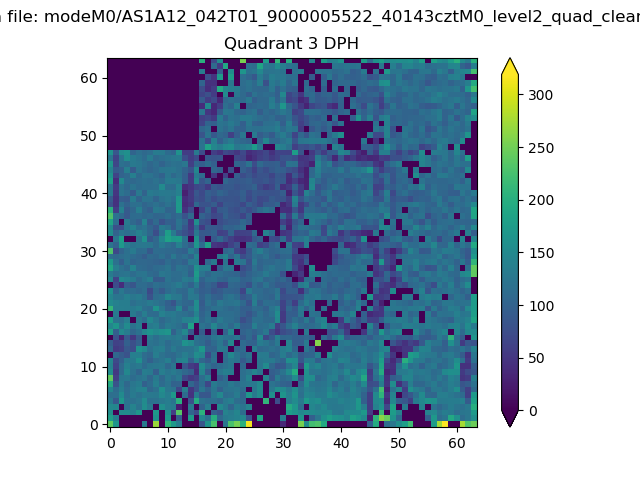 |
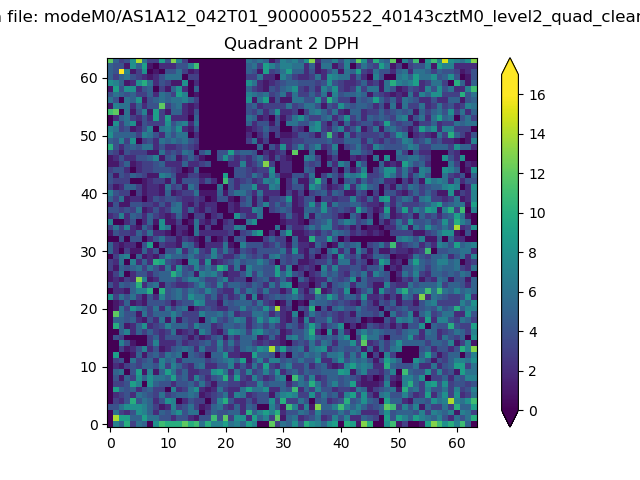 |
Quadrant C |
| Plot type | Count rate plots | Images |
|---|---|---|
| Comparison with Poisson distribution Blue bars denote a histogram of data divided into 1 sec bins. Red curve is a Poisson curve with rate = median count rate of data. |
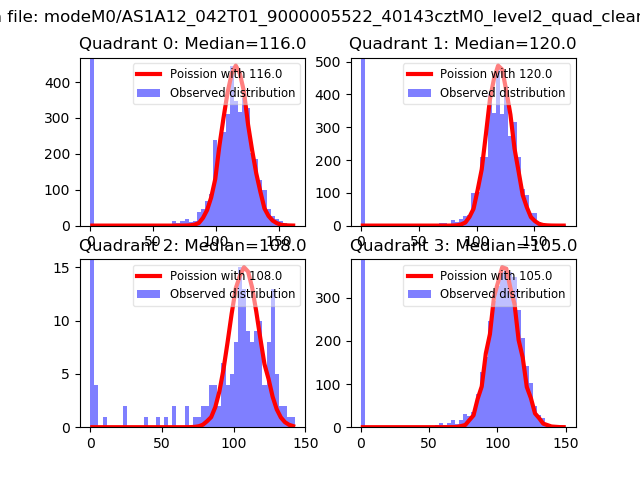 |
 |
| Quadrant-wise count rates Data is divided into 100 sec bins |
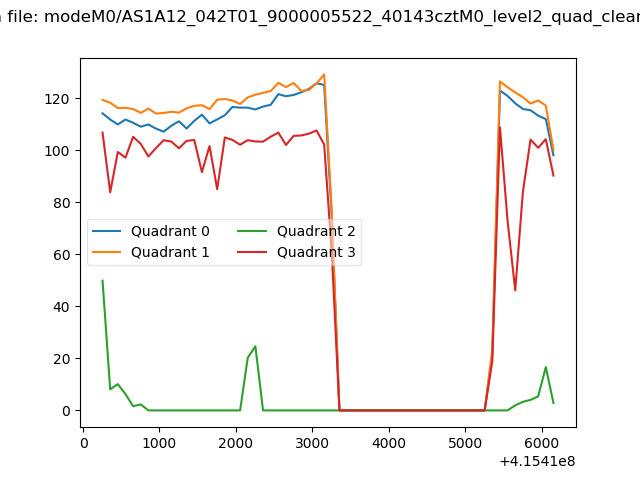 |
|
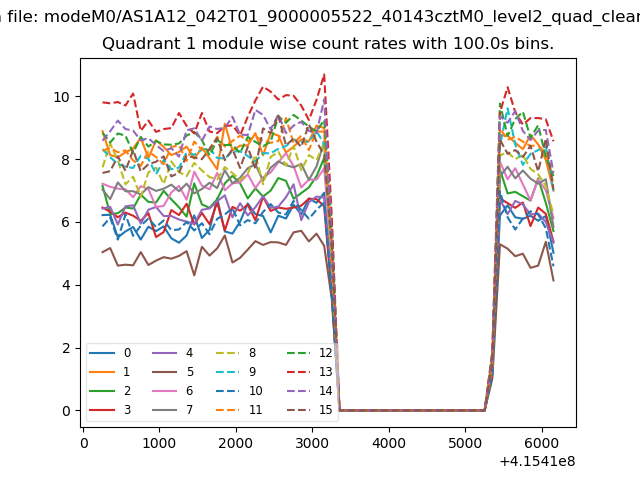
| Module-wise count rates for Quadrant A Data is divided into 100 sec bins |
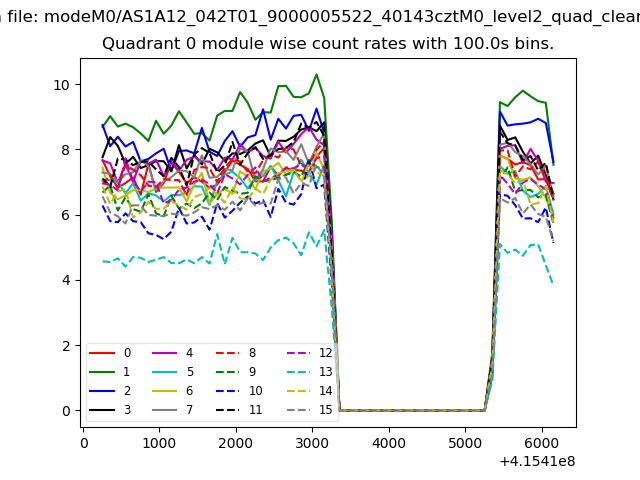 |
 |
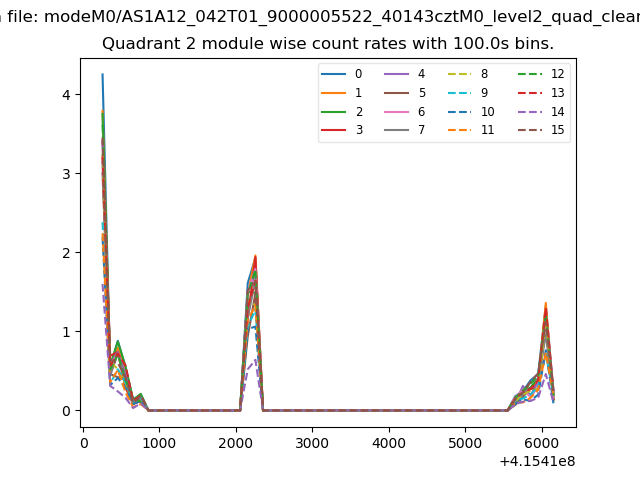
| Module-wise count rates for Quadrant B Data is divided into 100 sec bins |
 |
 |
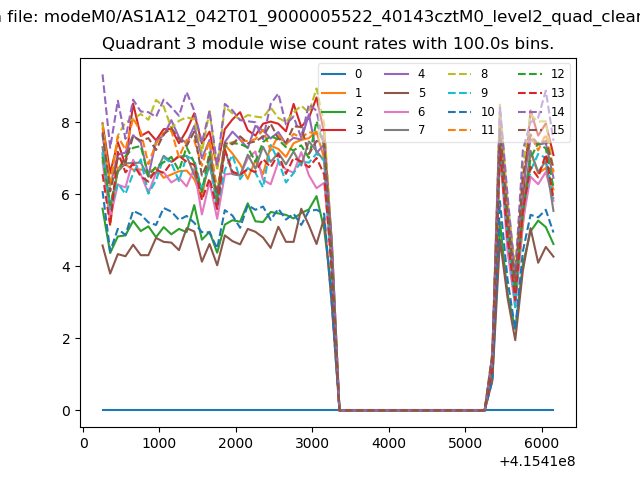
| Module-wise count rates for Quadrant C Data is divided into 100 sec bins |
 |
 |
| Module-wise count rates for Quadrant D Data is divided into 100 sec bins |
 |
 |
| Parameter | Plot |
|---|---|
| CZT HV Monitor | 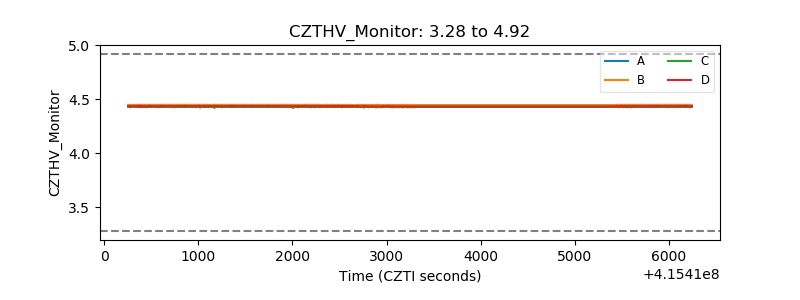 |
| D_VDD | 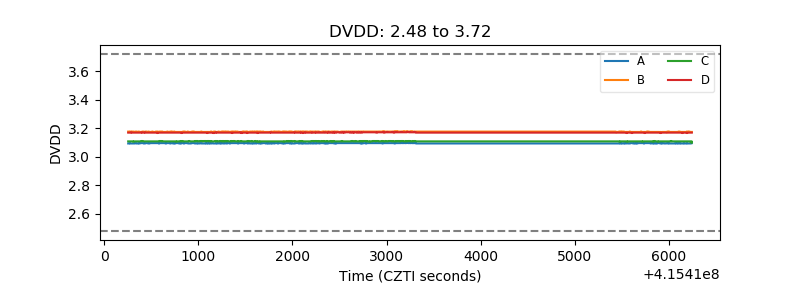 |
| Temperature 1 | 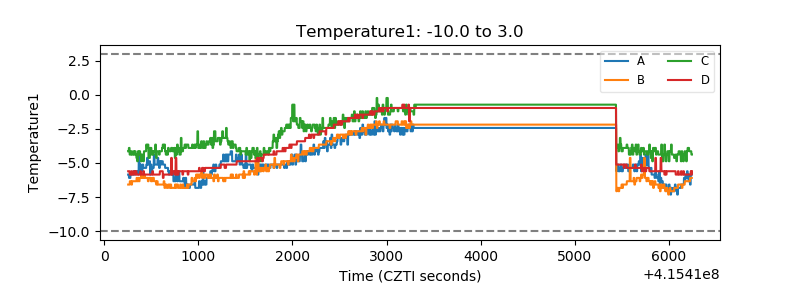 |
| Veto HV Monitor | 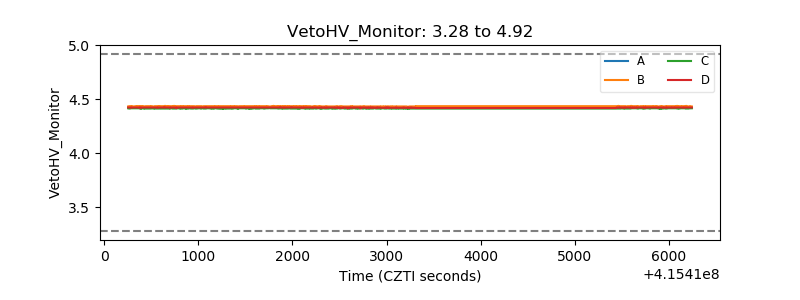 |
| Veto LLD | 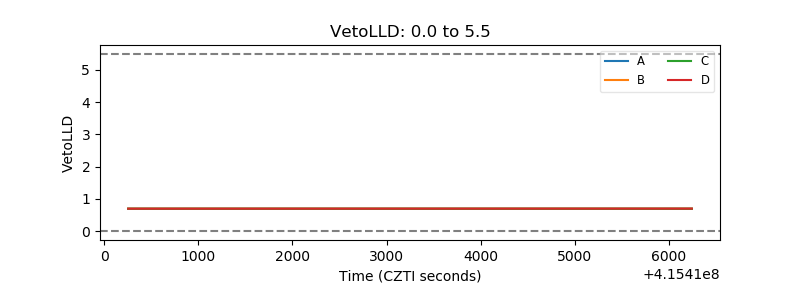 |
| Alpha Counter | 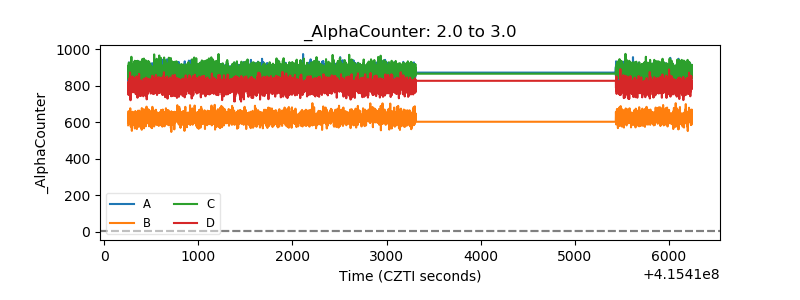 |
| _CPM_Rate | 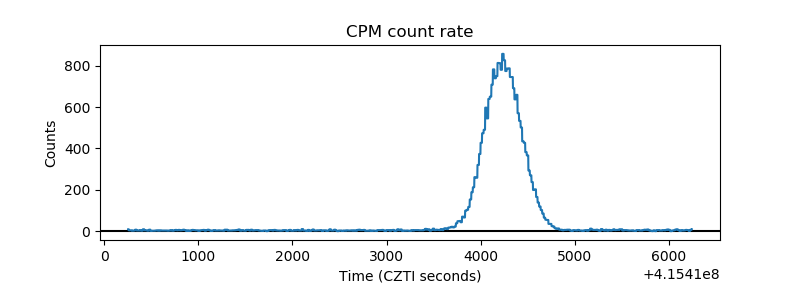 |
| CZT Counter | 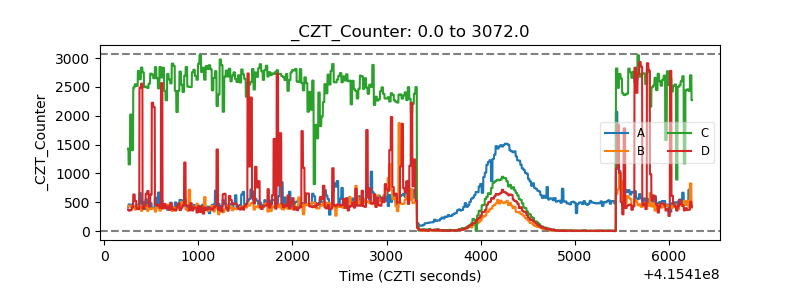 |
| +2.5 Volts monitor | 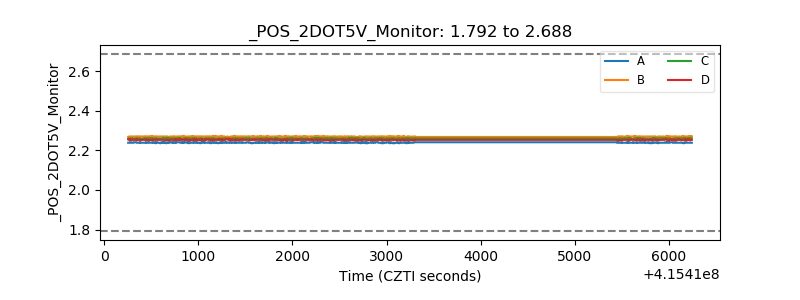 |
| +5 Volts monitor | 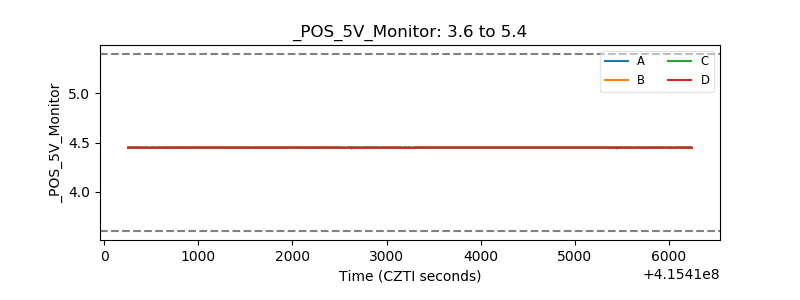 |
| _ROLL_ROT | 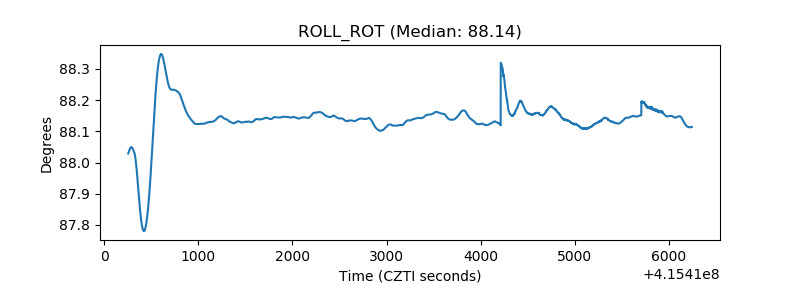 |
| _Roll_DEC | 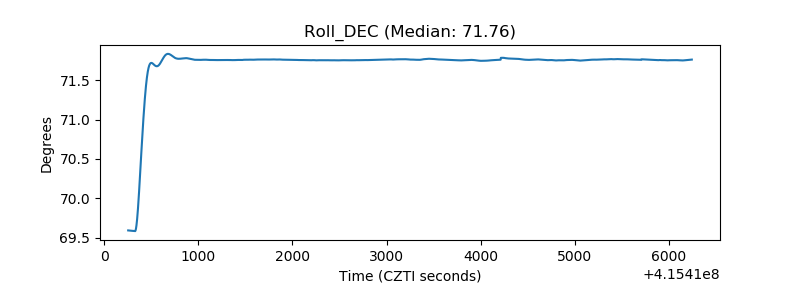 |
| _Roll_RA | 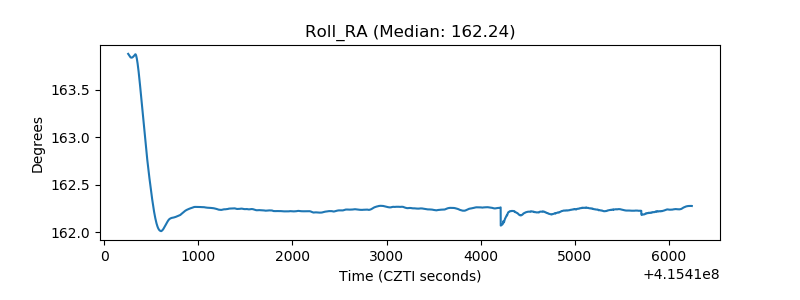 |
| Veto Counter | 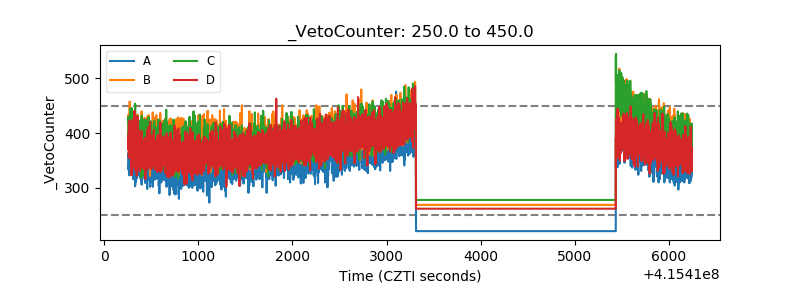 |