| Param | Original file | Final file |
|---|---|---|
| Filename | modeM0/AS1A12_042T01_9000005522_40144cztM0_level2.fits | modeM0/AS1A12_042T01_9000005522_40144cztM0_level2_quad_clean.evt |
| Size (bytes) | 600,753,600 | 69,912,000 |
| Size | 572.9 MB | 66.7 MB |
| Events in quadrant A | 2,705,035 | 588,347 |
| Events in quadrant B | 2,422,962 | 607,644 |
| Events in quadrant C | 13,010,793 | 48,131 |
| Events in quadrant D | 3,689,179 | 504,353 |
| Mode SS | |||
|---|---|---|---|
| Quadrant | BADHDUFLAG | Total packets | Discarded packets |
| A | 0 | 108 | 0 |
| B | 0 | 108 | 0 |
| C | 0 | 108 | 0 |
| D | 0 | 108 | 0 |
| Mode M0 | |||
|---|---|---|---|
| Quadrant | BADHDUFLAG | Total packets | Discarded packets |
| A | 0 | 11317 | 3 |
| B | 0 | 11025 | 2 |
| C | 0 | 42281 | 2 |
| D | 0 | 14800 | 2 |
| Mode M9 | |||
|---|---|---|---|
| Quadrant | BADHDUFLAG | Total packets | Discarded packets |
| A | 0 | 38 | 0 |
| B | 0 | 38 | 0 |
| C | 0 | 38 | 0 |
| D | 0 | 39 | 0 |
| Quadrant | Total seconds | Saturated seconds | Saturation percentage |
|---|---|---|---|
| A | 5258 | 13 | 0.247242% |
| B | 5258 | 21 | 0.399391% |
| C | 5258 | 4899 | 93.172309% |
| D | 5258 | 371 | 7.055915% |
Noise dominated data is calculated using 1-second bins in cleaned event files. If a bin has >2000 counts, and if more than 50% of those come from <1% of pixels, then it is considered to be noise-dominated and hence unusable.
| Quadrant | # 1 sec bins | Bins with >0 counts | Bins with >2000 counts | High rate bins dominated by noise | Noise dominated (total time) | Noise dominated (detector-on time) | Marked lightcurve |
|---|---|---|---|---|---|---|---|
| A | 7321 | 5259 | 11 | 11 | 0.15% | 0.21% | 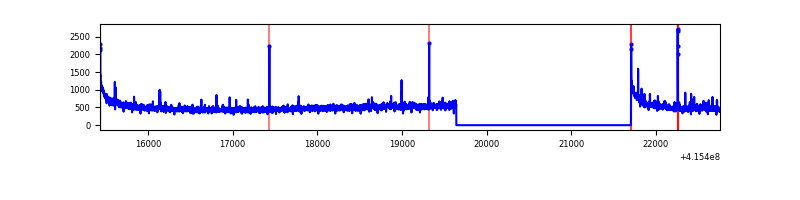 |
| B | 7321 | 5259 | 12 | 12 | 0.16% | 0.23% | 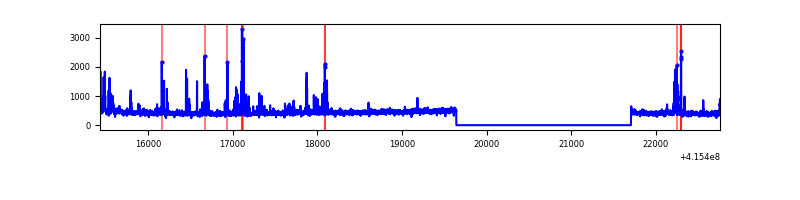 |
| C | 7320 | 5257 | 4874 | 4874 | 66.58% | 92.71% | 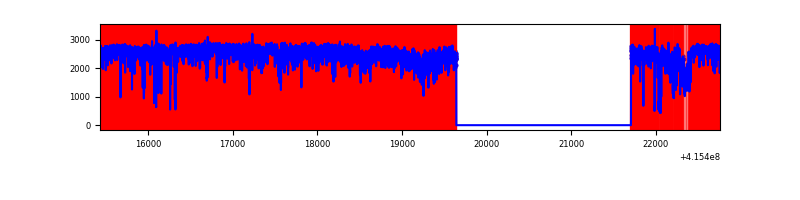 |
| D | 7321 | 5259 | 390 | 390 | 5.33% | 7.42% | 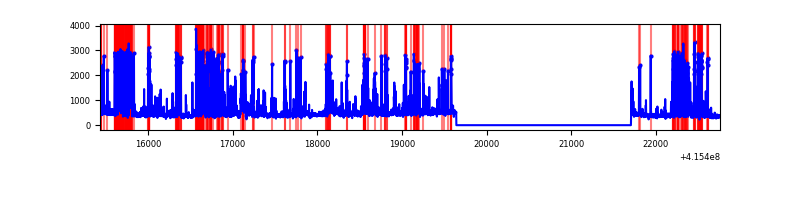 |
Top three noisy pixels from each quadrant. If the there are fewer than three noisy pixels in the level2.evt file, extra rows are filled as -1
| Pixel properties | Quadrant properties | ||||||
|---|---|---|---|---|---|---|---|
| Quadrant | DetID | PixID | Counts | Sigma | Mean | Median | Sigma |
| A | 10 | 83 | 458755 | 4079.36 | 553 | 542 | 112.3 |
| A | 12 | 189 | 59832 | 527.84 | 553 | 542 | 112.3 |
| A | 2 | 79 | 35271 | 309.18 | 553 | 542 | 112.3 |
| B | 4 | 171 | 215503 | 2032.03 | 553 | 538 | 105.8 |
| B | 0 | 190 | 16996 | 155.58 | 553 | 538 | 105.8 |
| B | 12 | 111 | 13233 | 120.0 | 553 | 538 | 105.8 |
| C | 9 | 187 | 11879029 | 200066.21 | 254 | 255 | 59.4 |
| C | 15 | 214 | 107300 | 1802.89 | 254 | 255 | 59.4 |
| C | 14 | 254 | 9210 | 150.82 | 254 | 255 | 59.4 |
| D | 12 | 227 | 973533 | 7775.59 | 514 | 499 | 125.1 |
| D | 12 | 0 | 487589 | 3892.38 | 514 | 499 | 125.1 |
| D | 13 | 249 | 109963 | 874.74 | 514 | 499 | 125.1 |
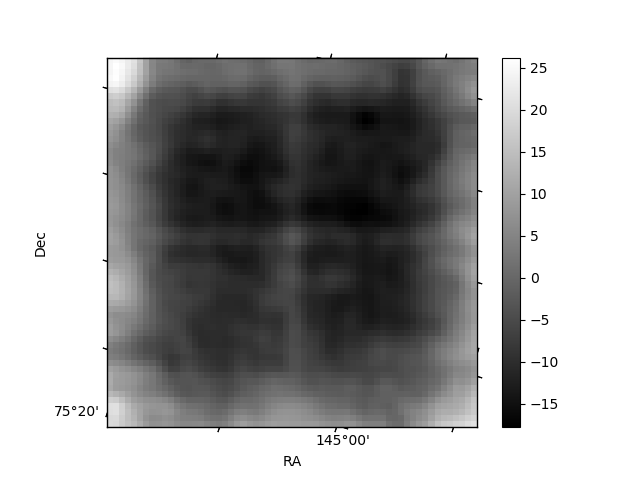
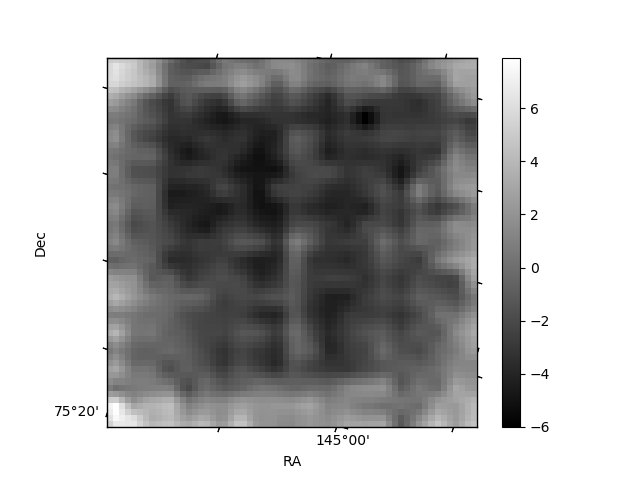
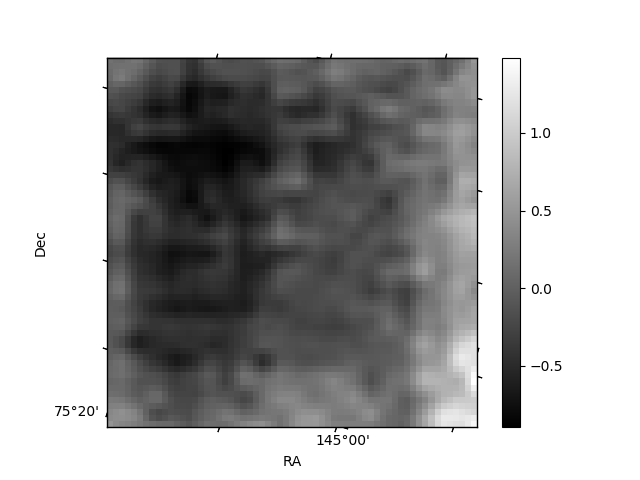
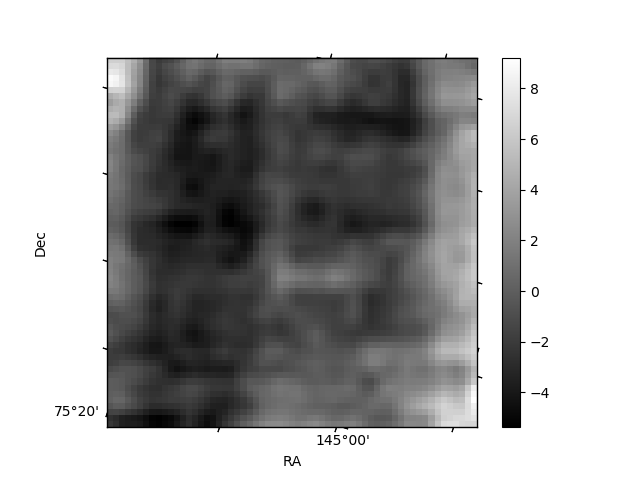
Histogram calculated using DETX and DETY for each event in the final _common_clean file
| Quadrant A | 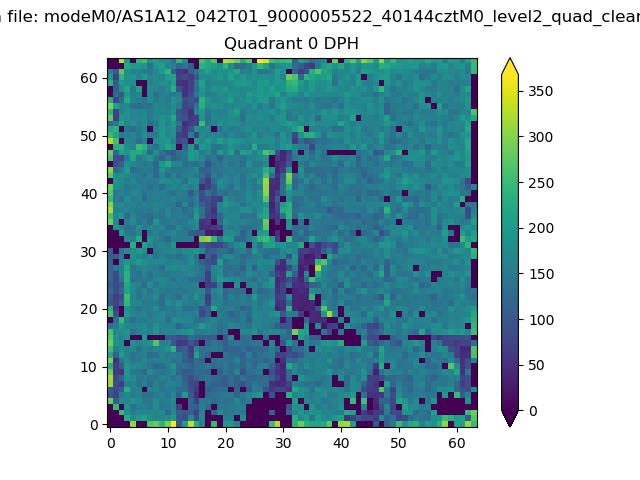 |
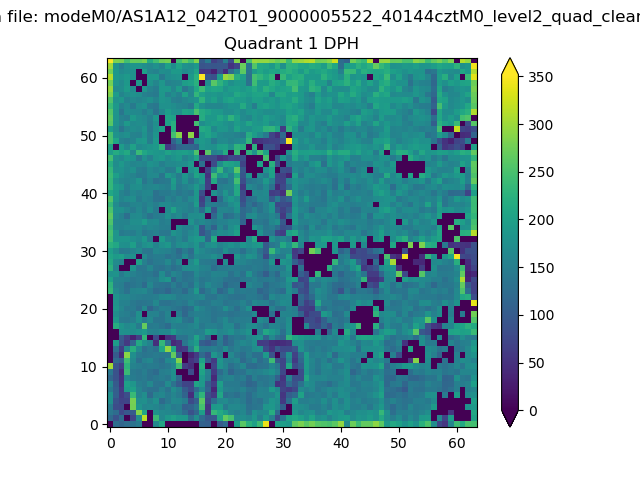 |
Quadrant B |
|---|---|---|---|
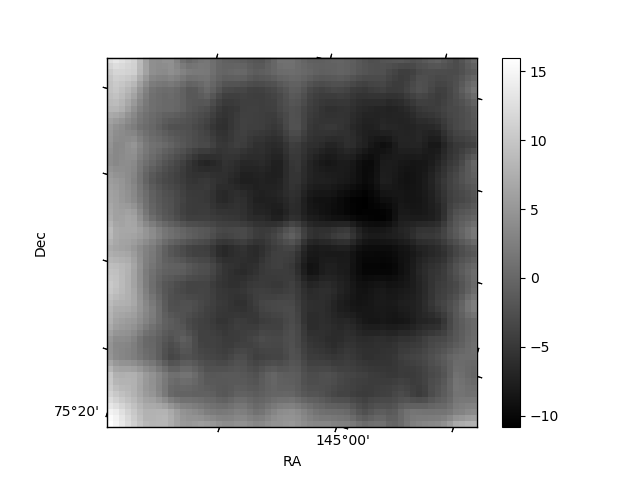
| Quadrant D | 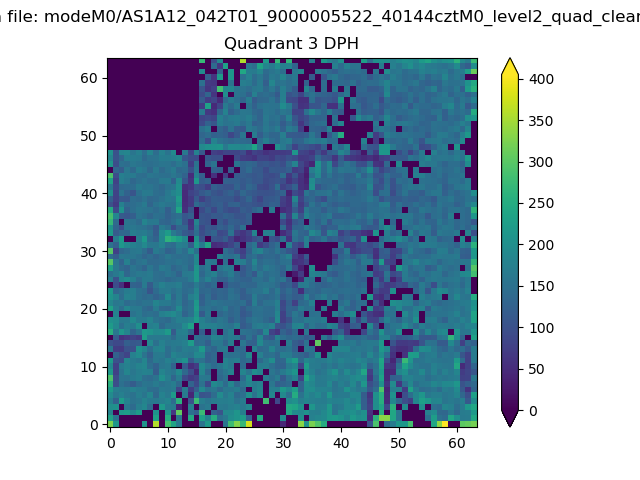 |
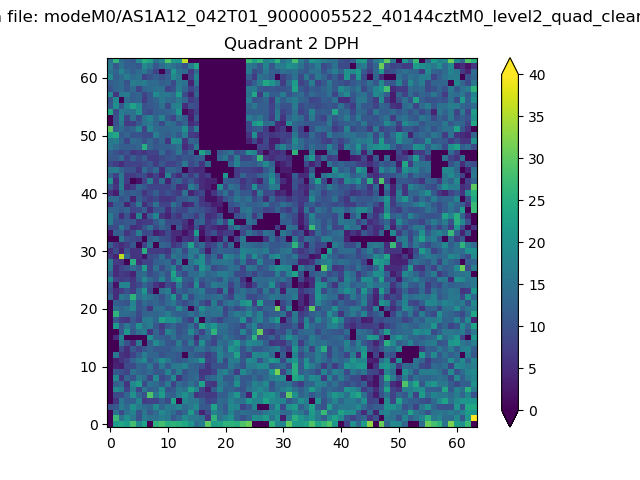 |
Quadrant C |
| Plot type | Count rate plots | Images |
|---|---|---|
| Comparison with Poisson distribution Blue bars denote a histogram of data divided into 1 sec bins. Red curve is a Poisson curve with rate = median count rate of data. |
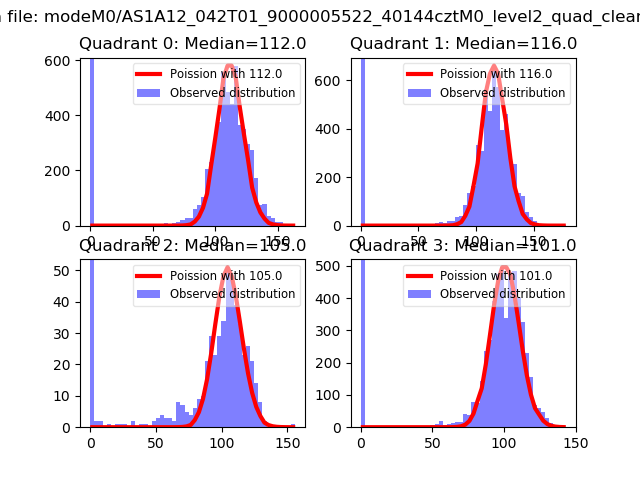 |
 |
| Quadrant-wise count rates Data is divided into 100 sec bins |
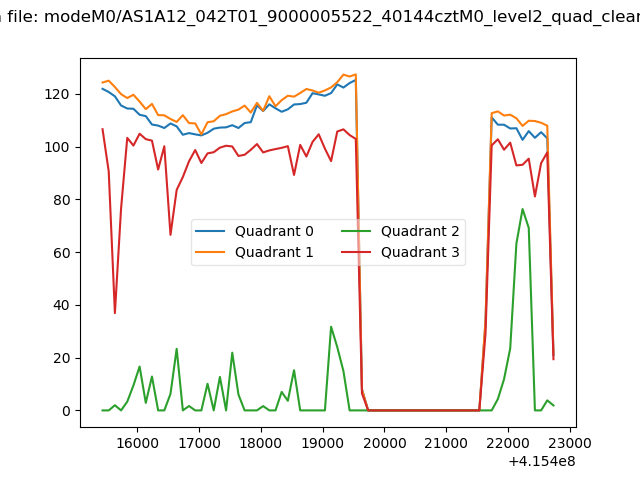 |
|
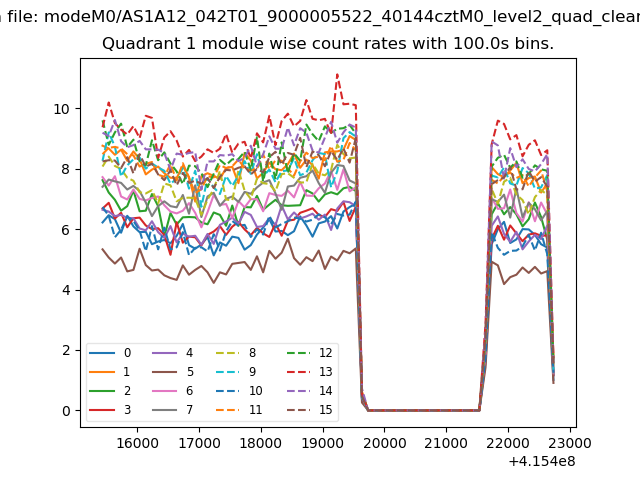
| Module-wise count rates for Quadrant A Data is divided into 100 sec bins |
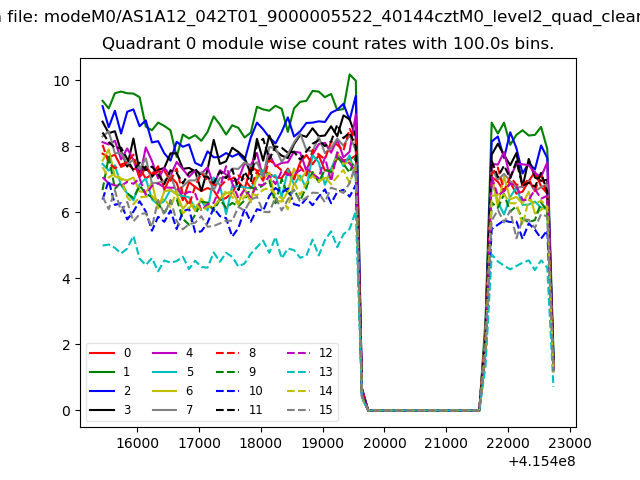 |
 |
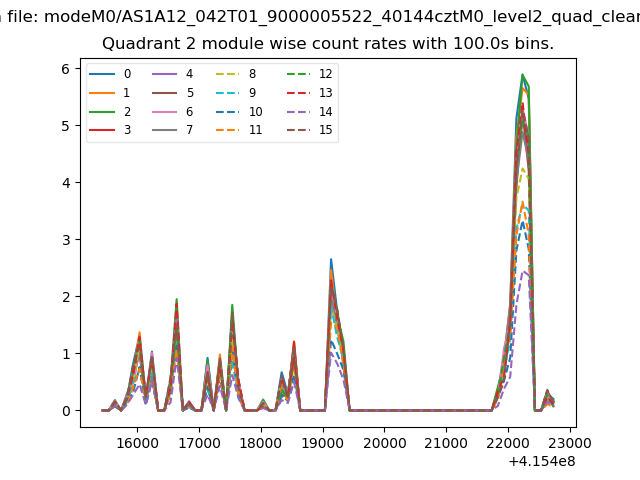
| Module-wise count rates for Quadrant B Data is divided into 100 sec bins |
 |
 |
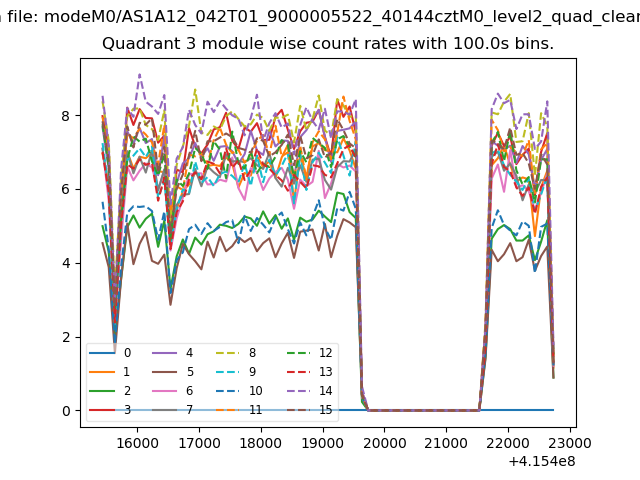
| Module-wise count rates for Quadrant C Data is divided into 100 sec bins |
 |
 |
| Module-wise count rates for Quadrant D Data is divided into 100 sec bins |
 |
 |
| Parameter | Plot |
|---|---|
| CZT HV Monitor | 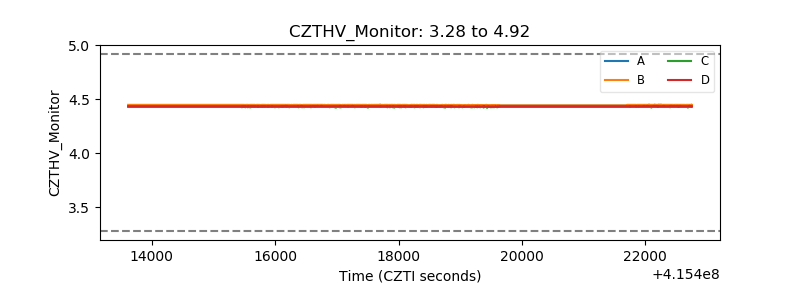 |
| D_VDD | 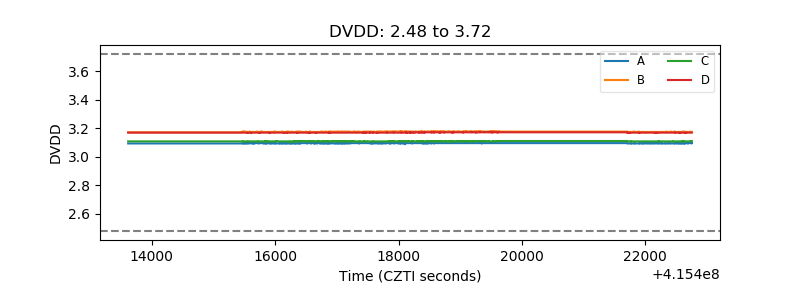 |
| Temperature 1 | 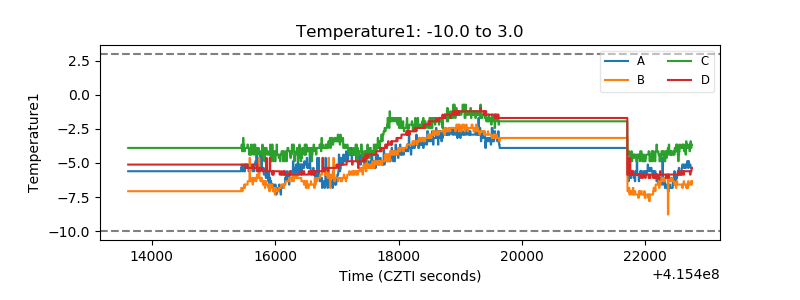 |
| Veto HV Monitor |  |
| Veto LLD | 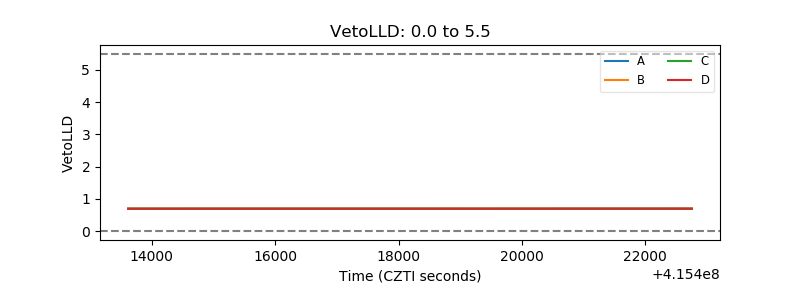 |
| Alpha Counter | 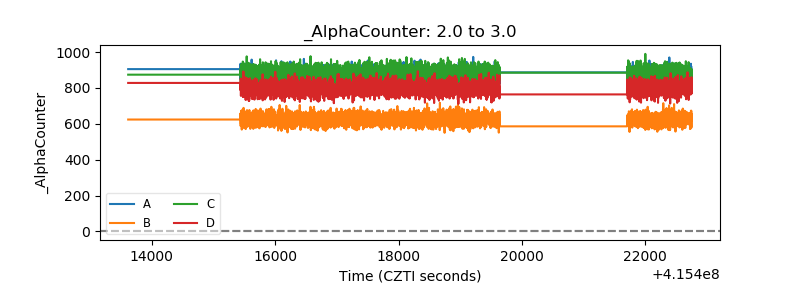 |
| _CPM_Rate | 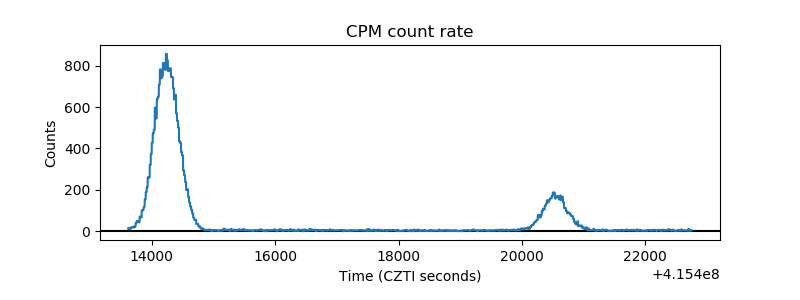 |
| CZT Counter | 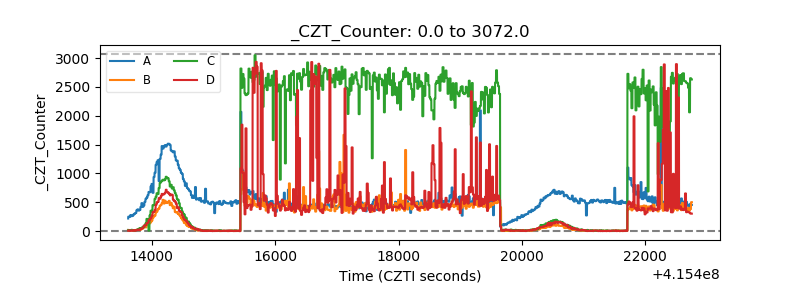 |
| +2.5 Volts monitor | 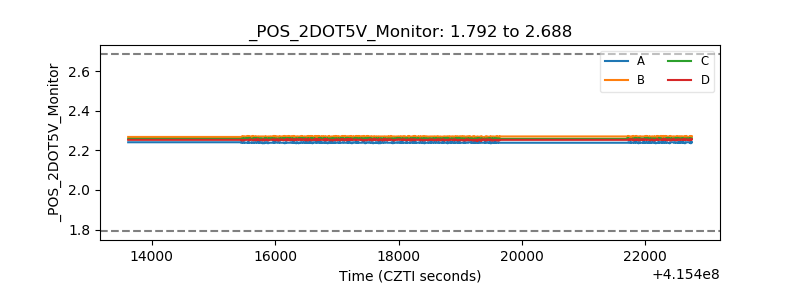 |
| +5 Volts monitor | 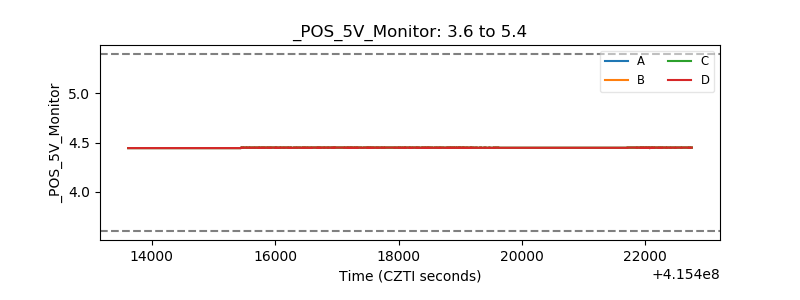 |
| _ROLL_ROT | 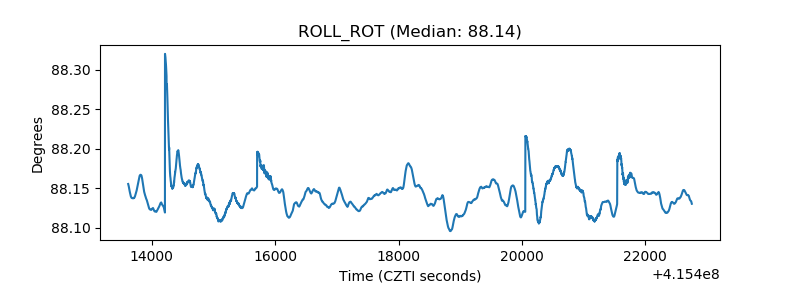 |
| _Roll_DEC | 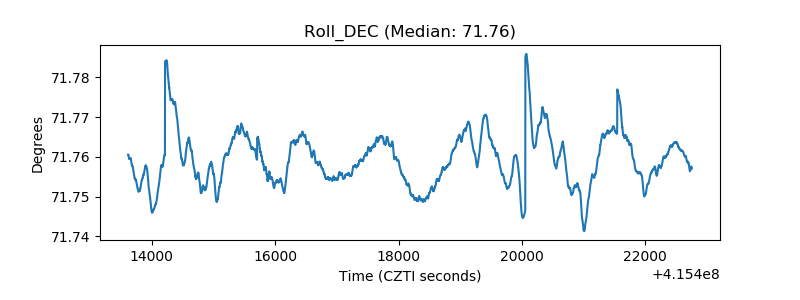 |
| _Roll_RA | 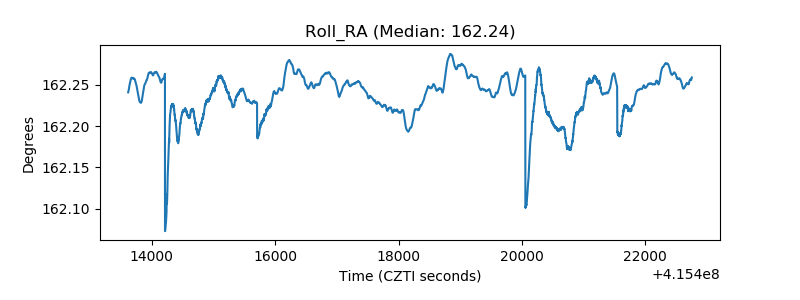 |
| Veto Counter | 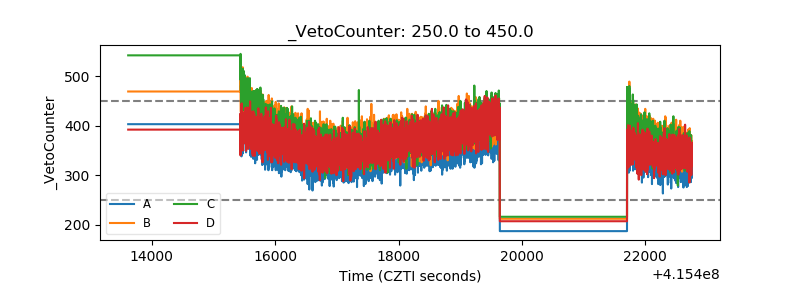 |