| Param | Original file | Final file |
|---|---|---|
| Filename | modeM0/AS1A12_042T01_9000005522_40145cztM0_level2.fits | modeM0/AS1A12_042T01_9000005522_40145cztM0_level2_quad_clean.evt |
| Size (bytes) | 634,803,840 | 71,706,240 |
| Size | 605.4 MB | 68.4 MB |
| Events in quadrant A | 2,995,321 | 593,062 |
| Events in quadrant B | 2,898,709 | 612,028 |
| Events in quadrant C | 13,173,674 | 74,460 |
| Events in quadrant D | 4,004,001 | 507,998 |
| Mode SS | |||
|---|---|---|---|
| Quadrant | BADHDUFLAG | Total packets | Discarded packets |
| A | 0 | 112 | 0 |
| B | 0 | 112 | 0 |
| C | 0 | 112 | 0 |
| D | 0 | 112 | 0 |
| Mode M0 | |||
|---|---|---|---|
| Quadrant | BADHDUFLAG | Total packets | Discarded packets |
| A | 0 | 12211 | 3 |
| B | 0 | 12707 | 2 |
| C | 0 | 42862 | 2 |
| D | 0 | 15859 | 2 |
| Mode M9 | |||
|---|---|---|---|
| Quadrant | BADHDUFLAG | Total packets | Discarded packets |
| A | 0 | 26 | 0 |
| B | 0 | 26 | 0 |
| C | 0 | 26 | 0 |
| D | 0 | 27 | 0 |
| Quadrant | Total seconds | Saturated seconds | Saturation percentage |
|---|---|---|---|
| A | 5480 | 56 | 1.021898% |
| B | 5480 | 60 | 1.094891% |
| C | 5480 | 4898 | 89.379562% |
| D | 5480 | 415 | 7.572993% |
Noise dominated data is calculated using 1-second bins in cleaned event files. If a bin has >2000 counts, and if more than 50% of those come from <1% of pixels, then it is considered to be noise-dominated and hence unusable.
| Quadrant | # 1 sec bins | Bins with >0 counts | Bins with >2000 counts | High rate bins dominated by noise | Noise dominated (total time) | Noise dominated (detector-on time) | Marked lightcurve |
|---|---|---|---|---|---|---|---|
| A | 7273 | 5481 | 57 | 57 | 0.78% | 1.04% | 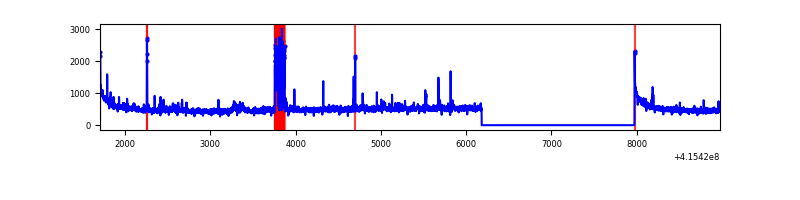 |
| B | 7273 | 5481 | 15 | 15 | 0.21% | 0.27% | 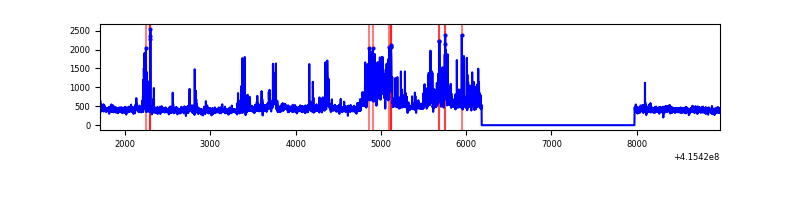 |
| C | 7272 | 5479 | 4853 | 4853 | 66.74% | 88.57% | 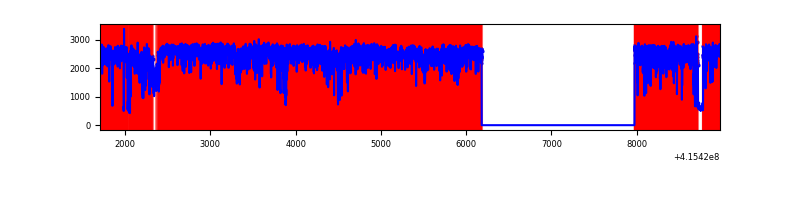 |
| D | 7273 | 5481 | 443 | 443 | 6.09% | 8.08% | 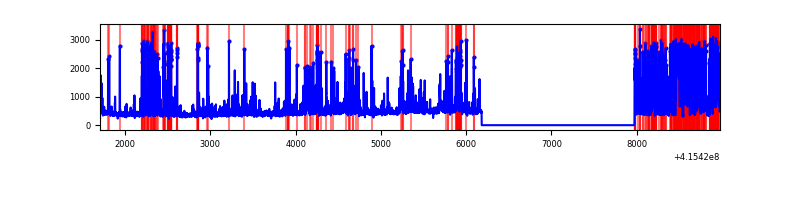 |
Top three noisy pixels from each quadrant. If the there are fewer than three noisy pixels in the level2.evt file, extra rows are filled as -1
| Pixel properties | Quadrant properties | ||||||
|---|---|---|---|---|---|---|---|
| Quadrant | DetID | PixID | Counts | Sigma | Mean | Median | Sigma |
| A | 10 | 83 | 459211 | 3914.61 | 575 | 563 | 117.2 |
| A | 2 | 79 | 195403 | 1662.98 | 575 | 563 | 117.2 |
| A | 12 | 189 | 98062 | 832.16 | 575 | 563 | 117.2 |
| B | 4 | 170 | 416622 | 3762.11 | 572 | 555 | 110.6 |
| B | 0 | 190 | 127442 | 1147.32 | 572 | 555 | 110.6 |
| B | 4 | 171 | 85832 | 771.08 | 572 | 555 | 110.6 |
| C | 9 | 187 | 12050076 | 202788.45 | 252 | 253 | 59.4 |
| C | 15 | 214 | 110497 | 1855.31 | 252 | 253 | 59.4 |
| C | 14 | 254 | 11110 | 182.71 | 252 | 253 | 59.4 |
| D | 12 | 0 | 1455300 | 11053.02 | 540 | 524 | 131.6 |
| D | 12 | 227 | 233080 | 1766.9 | 540 | 524 | 131.6 |
| D | 13 | 249 | 65047 | 490.23 | 540 | 524 | 131.6 |
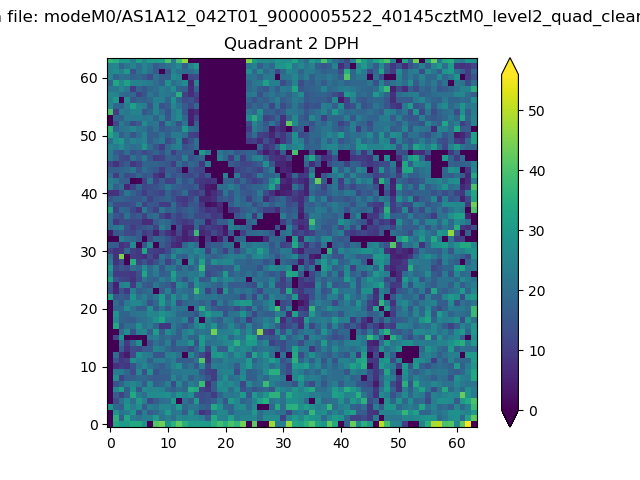
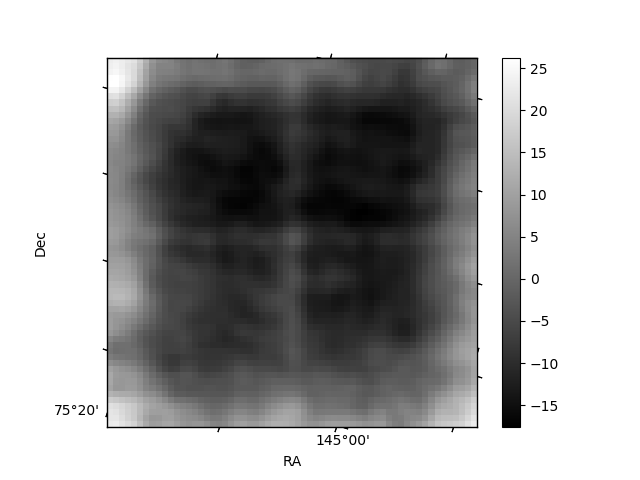
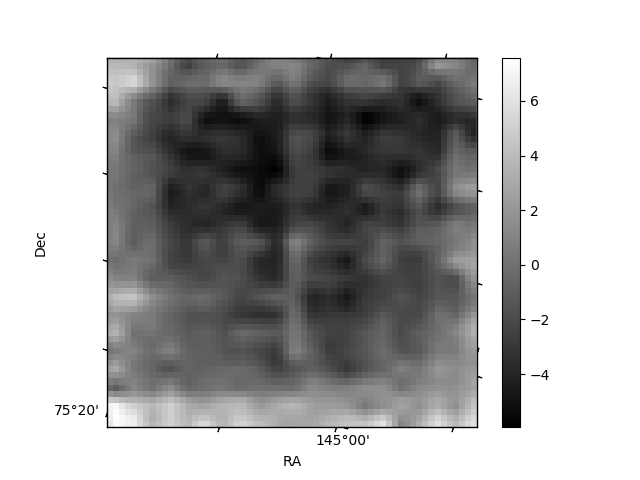
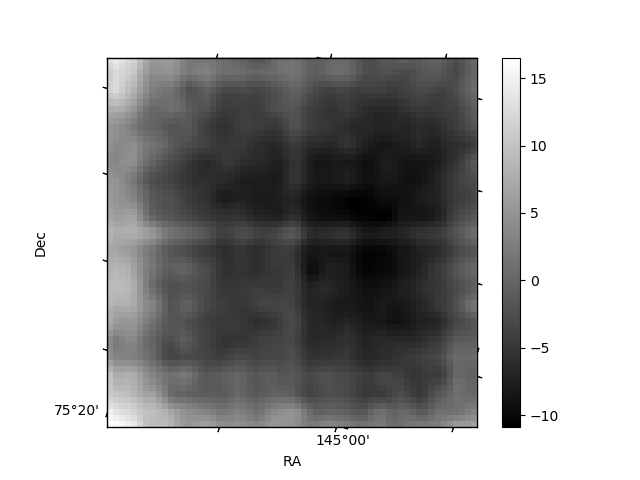
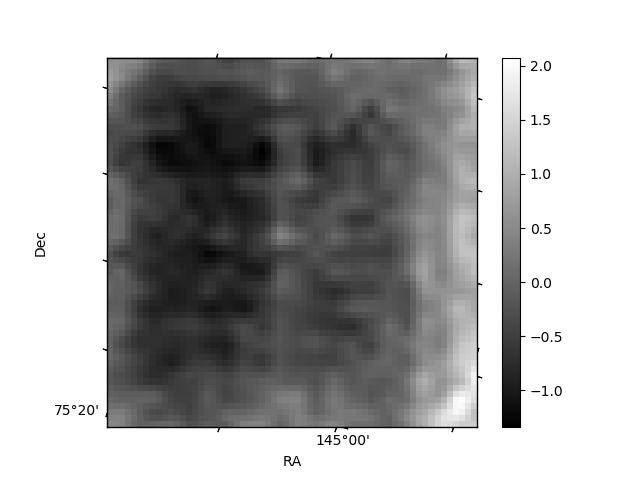
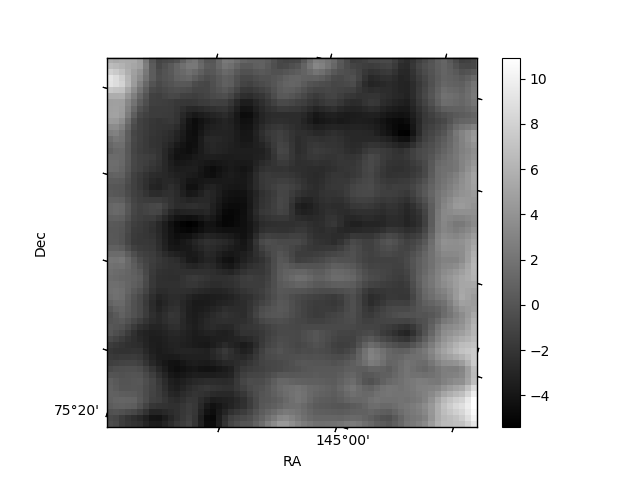
Histogram calculated using DETX and DETY for each event in the final _common_clean file
| Quadrant A | 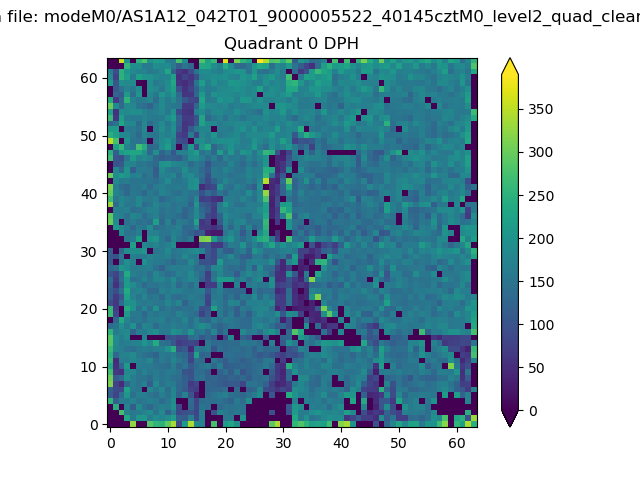 |
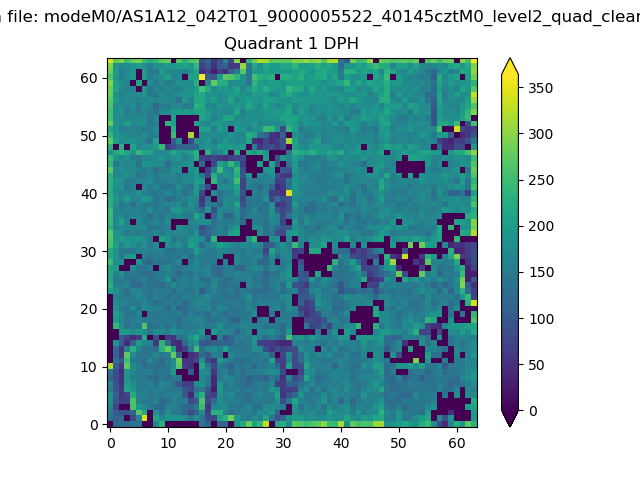 |
Quadrant B |
|---|---|---|---|
| Quadrant D | 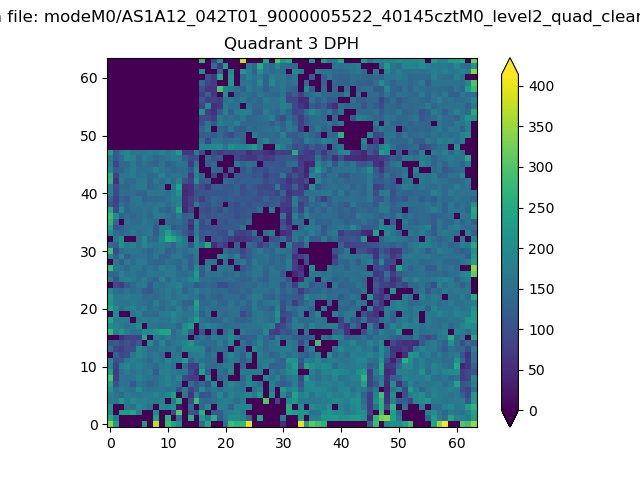 |
 |
Quadrant C |
| Plot type | Count rate plots | Images |
|---|---|---|
| Comparison with Poisson distribution Blue bars denote a histogram of data divided into 1 sec bins. Red curve is a Poisson curve with rate = median count rate of data. |
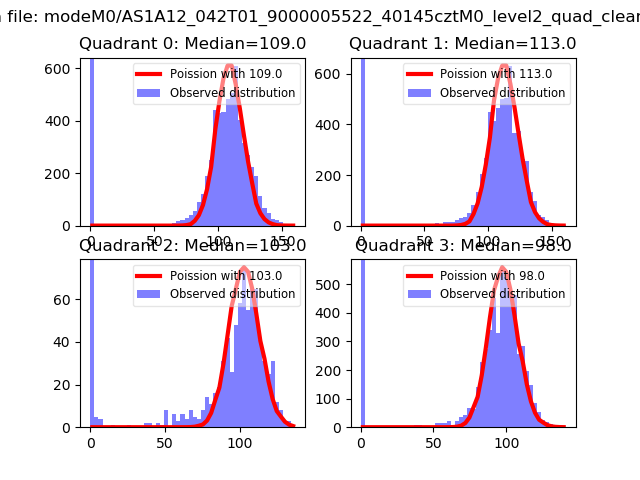 |
 |
| Quadrant-wise count rates Data is divided into 100 sec bins |
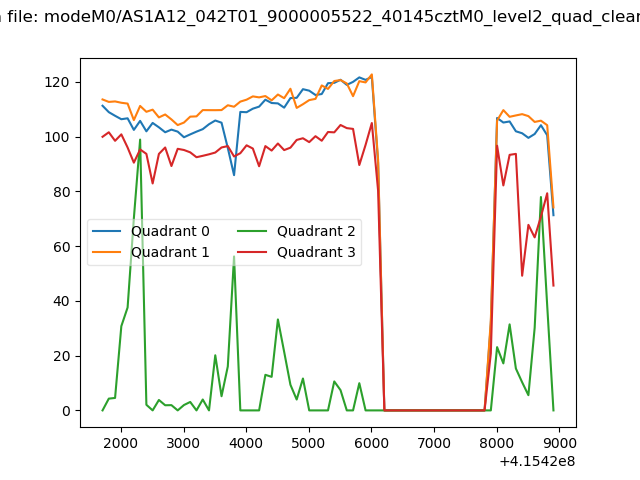 |
|
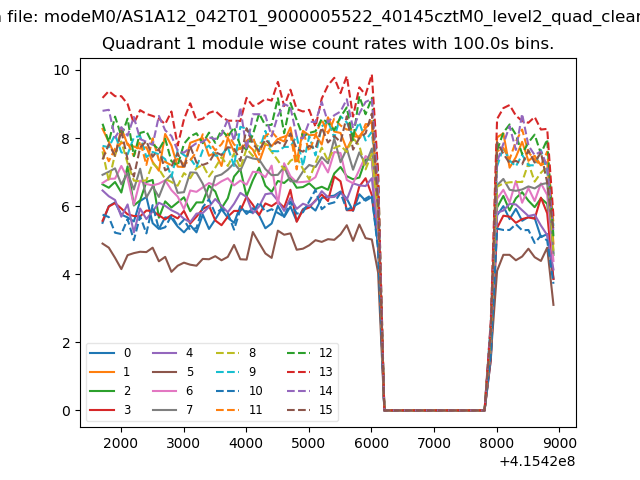
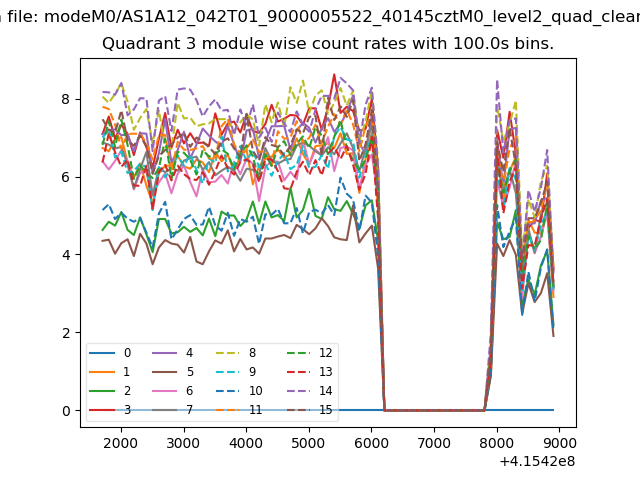
| Module-wise count rates for Quadrant A Data is divided into 100 sec bins |
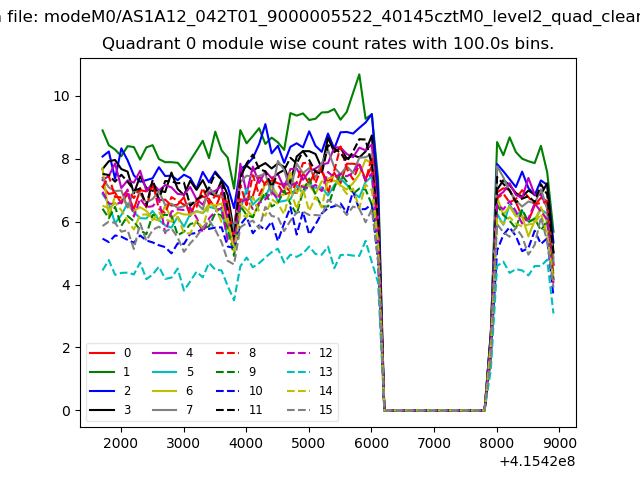 |
 |
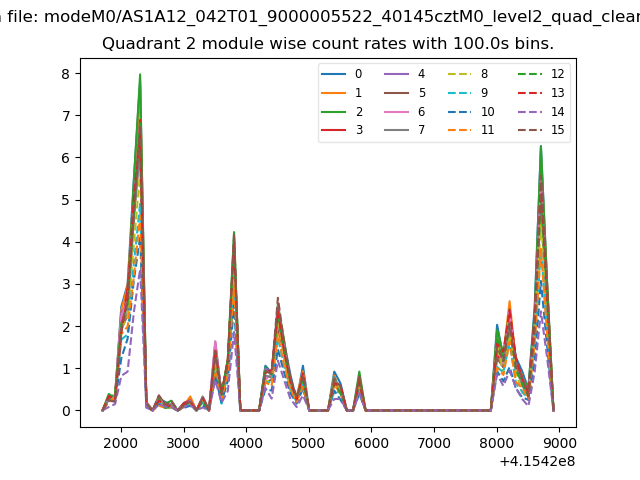
| Module-wise count rates for Quadrant B Data is divided into 100 sec bins |
 |
 |
| Module-wise count rates for Quadrant C Data is divided into 100 sec bins |
 |
 |
| Module-wise count rates for Quadrant D Data is divided into 100 sec bins |
 |
 |
| Parameter | Plot |
|---|---|
| CZT HV Monitor | 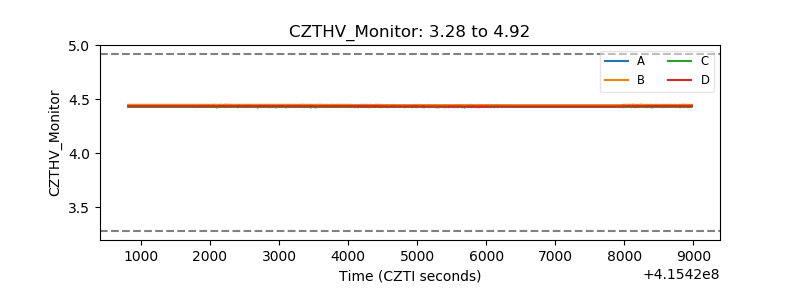 |
| D_VDD | 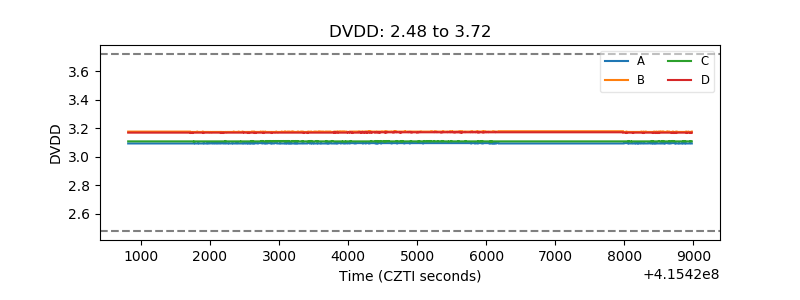 |
| Temperature 1 | 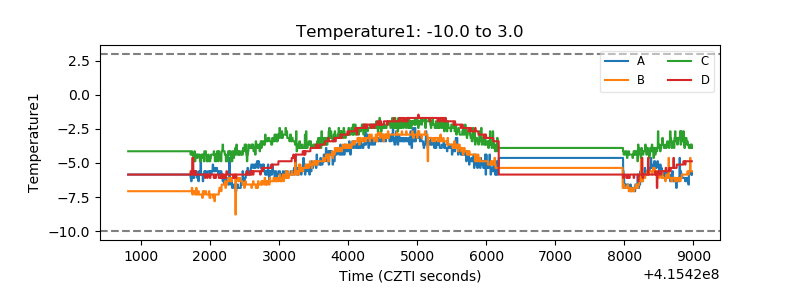 |
| Veto HV Monitor | 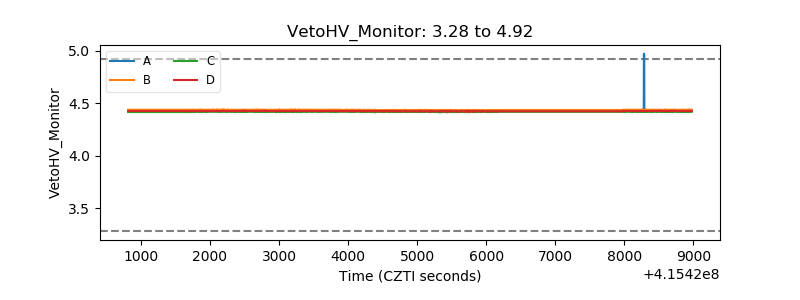 |
| Veto LLD | 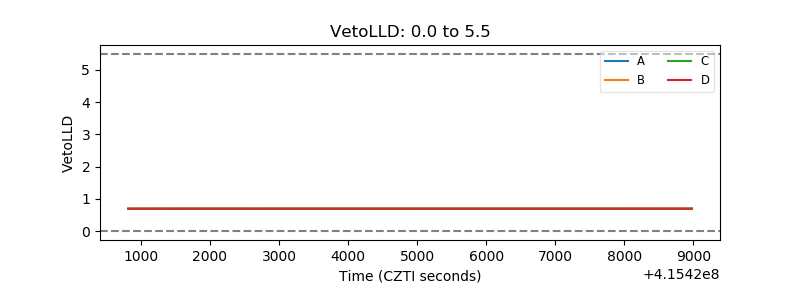 |
| Alpha Counter | 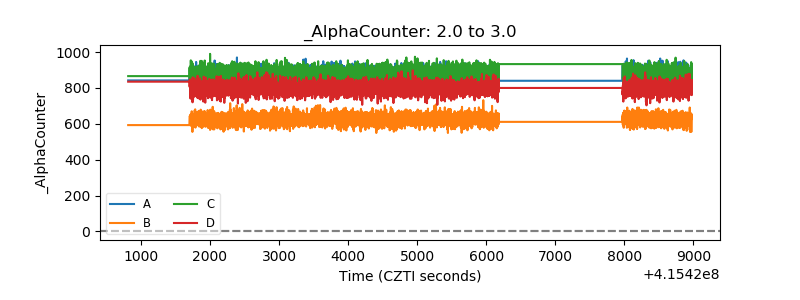 |
| _CPM_Rate | 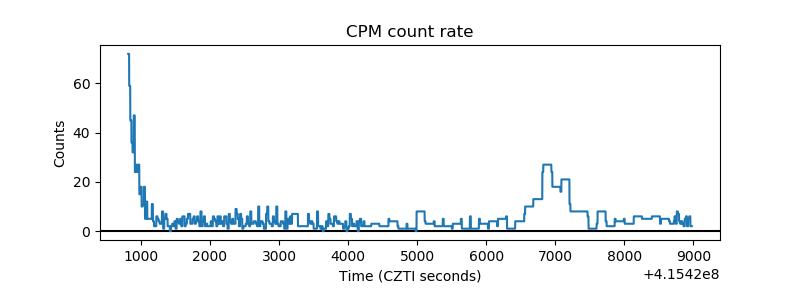 |
| CZT Counter | 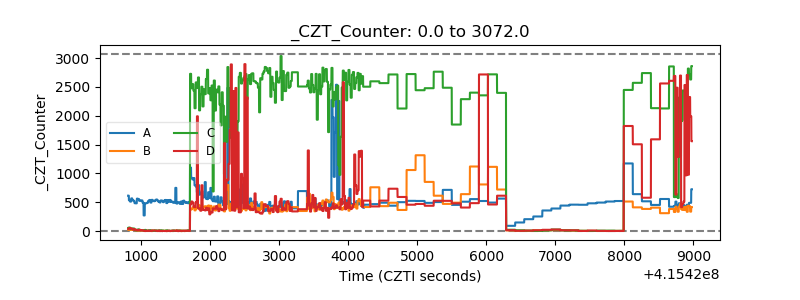 |
| +2.5 Volts monitor | 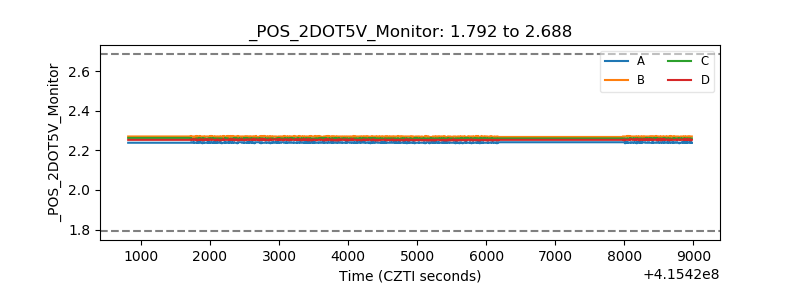 |
| +5 Volts monitor | 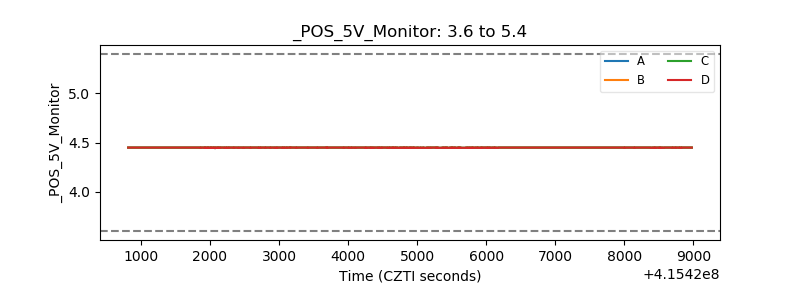 |
| _ROLL_ROT | 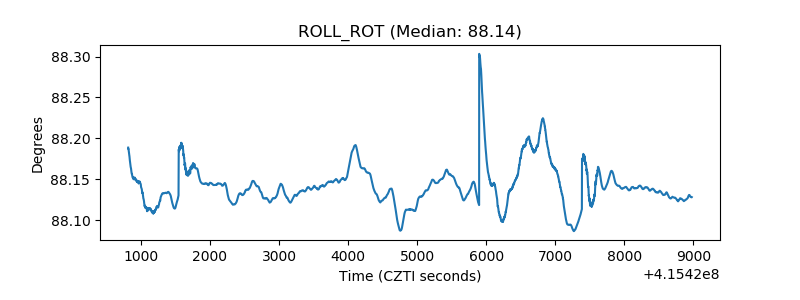 |
| _Roll_DEC | 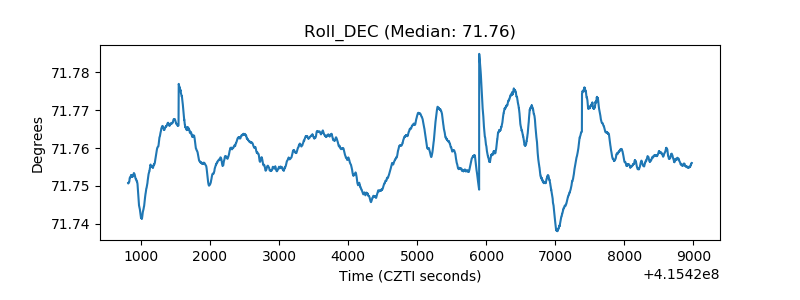 |
| _Roll_RA | 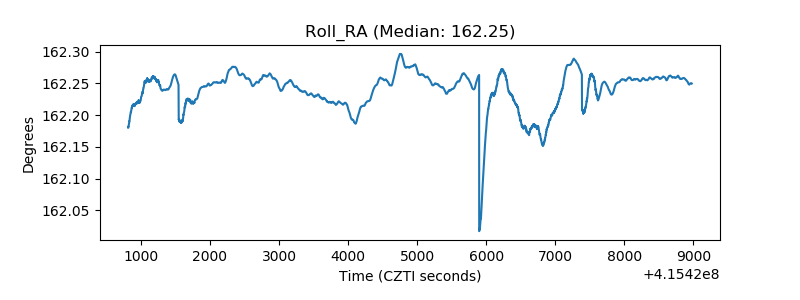 |
| Veto Counter | 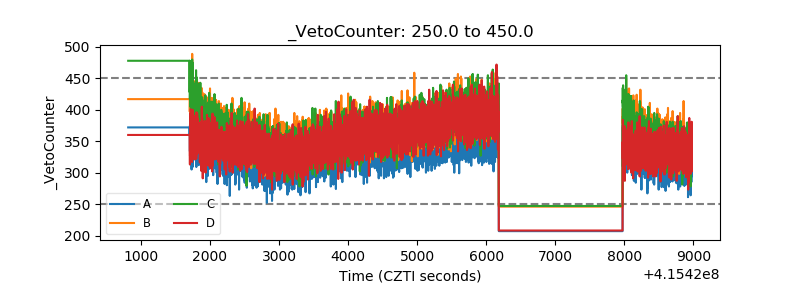 |