| Param | Original file | Final file |
|---|---|---|
| Filename | modeM0/AS1A12_042T01_9000005522_40146cztM0_level2.fits | modeM0/AS1A12_042T01_9000005522_40146cztM0_level2_quad_clean.evt |
| Size (bytes) | 672,148,800 | 71,729,280 |
| Size | 641.0 MB | 68.4 MB |
| Events in quadrant A | 2,918,937 | 609,038 |
| Events in quadrant B | 2,380,889 | 626,481 |
| Events in quadrant C | 13,747,236 | 59,802 |
| Events in quadrant D | 5,397,648 | 484,301 |
| Mode SS | |||
|---|---|---|---|
| Quadrant | BADHDUFLAG | Total packets | Discarded packets |
| A | 0 | 114 | 0 |
| B | 0 | 114 | 0 |
| C | 0 | 114 | 0 |
| D | 0 | 114 | 0 |
| Mode M0 | |||
|---|---|---|---|
| Quadrant | BADHDUFLAG | Total packets | Discarded packets |
| A | 0 | 12070 | 2 |
| B | 0 | 11240 | 1 |
| C | 0 | 44586 | 1 |
| D | 0 | 19912 | 1 |
| Mode M9 | |||
|---|---|---|---|
| Quadrant | BADHDUFLAG | Total packets | Discarded packets |
| A | 0 | 15 | 0 |
| B | 0 | 15 | 0 |
| C | 0 | 15 | 0 |
| D | 0 | 15 | 0 |
| Quadrant | Total seconds | Saturated seconds | Saturation percentage |
|---|---|---|---|
| A | 5606 | 6 | 0.107028% |
| B | 5606 | 5 | 0.089190% |
| C | 5606 | 5120 | 91.330717% |
| D | 5606 | 816 | 14.555833% |
Noise dominated data is calculated using 1-second bins in cleaned event files. If a bin has >2000 counts, and if more than 50% of those come from <1% of pixels, then it is considered to be noise-dominated and hence unusable.
| Quadrant | # 1 sec bins | Bins with >0 counts | Bins with >2000 counts | High rate bins dominated by noise | Noise dominated (total time) | Noise dominated (detector-on time) | Marked lightcurve |
|---|---|---|---|---|---|---|---|
| A | 7069 | 5607 | 2 | 2 | 0.03% | 0.04% | 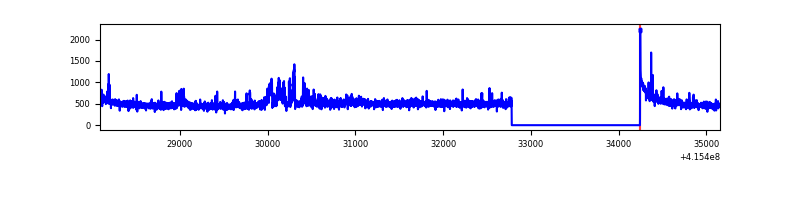 |
| B | 7069 | 5607 | 0 | 0 | 0.00% | 0.00% | 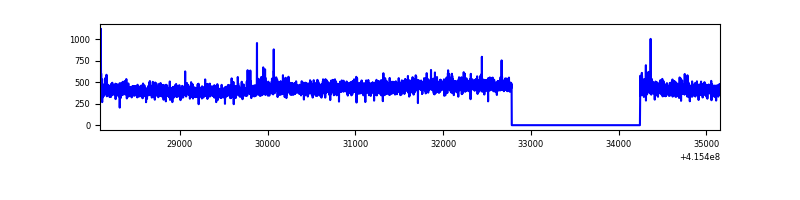 |
| C | 7068 | 5605 | 5085 | 5085 | 71.94% | 90.72% | 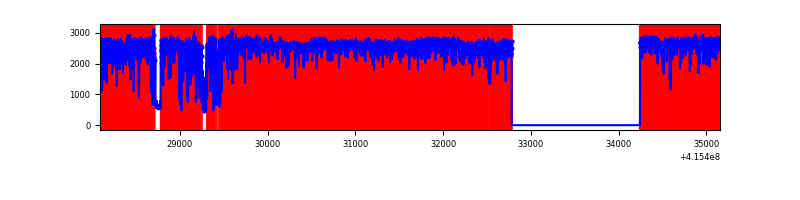 |
| D | 7069 | 5607 | 827 | 827 | 11.70% | 14.75% | 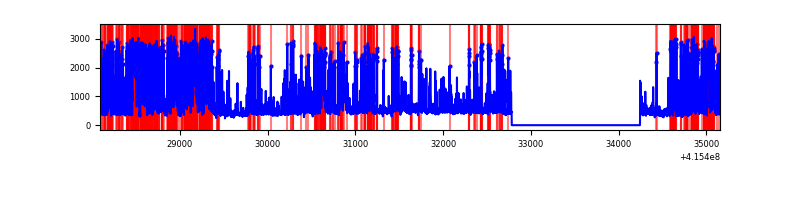 |
Top three noisy pixels from each quadrant. If the there are fewer than three noisy pixels in the level2.evt file, extra rows are filled as -1
| Pixel properties | Quadrant properties | ||||||
|---|---|---|---|---|---|---|---|
| Quadrant | DetID | PixID | Counts | Sigma | Mean | Median | Sigma |
| A | 10 | 83 | 419048 | 3422.29 | 595 | 583 | 122.3 |
| A | 12 | 189 | 176974 | 1442.56 | 595 | 583 | 122.3 |
| A | 2 | 79 | 13915 | 109.03 | 595 | 583 | 122.3 |
| B | 0 | 190 | 20339 | 174.12 | 591 | 573 | 113.5 |
| B | 0 | 230 | 18930 | 161.71 | 591 | 573 | 113.5 |
| B | 12 | 111 | 14456 | 122.3 | 591 | 573 | 113.5 |
| C | 9 | 187 | 12787978 | 250338.38 | 216 | 217 | 51.1 |
| C | 15 | 214 | 95508 | 1865.46 | 216 | 217 | 51.1 |
| C | 9 | 203 | 5793 | 109.16 | 216 | 217 | 51.1 |
| D | 12 | 0 | 2279909 | 17225.61 | 541 | 525 | 132.3 |
| D | 13 | 249 | 463992 | 3502.48 | 541 | 525 | 132.3 |
| D | 12 | 227 | 200046 | 1507.81 | 541 | 525 | 132.3 |
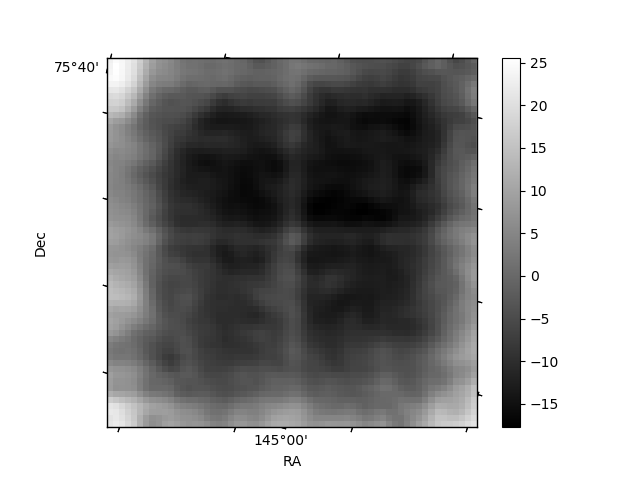
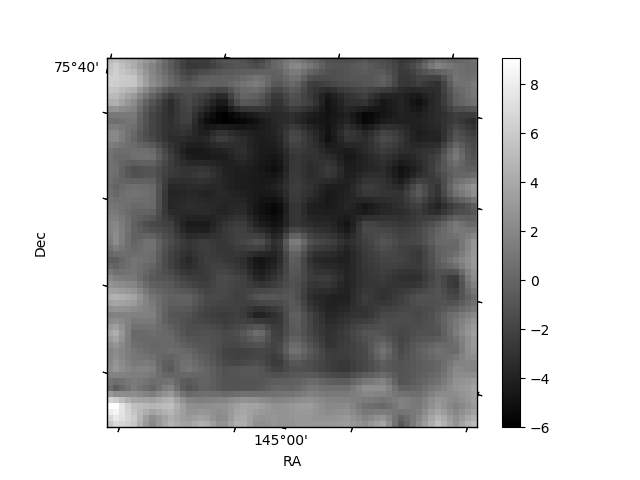
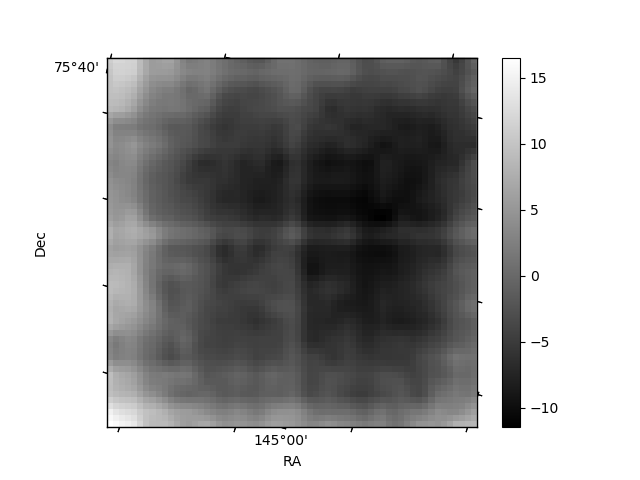
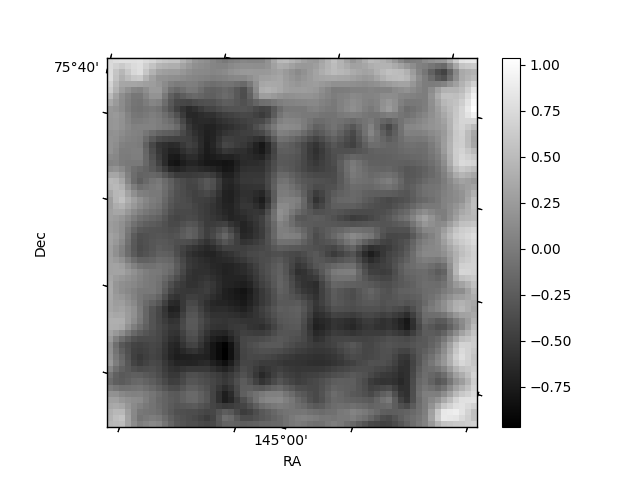
Histogram calculated using DETX and DETY for each event in the final _common_clean file
| Quadrant A | 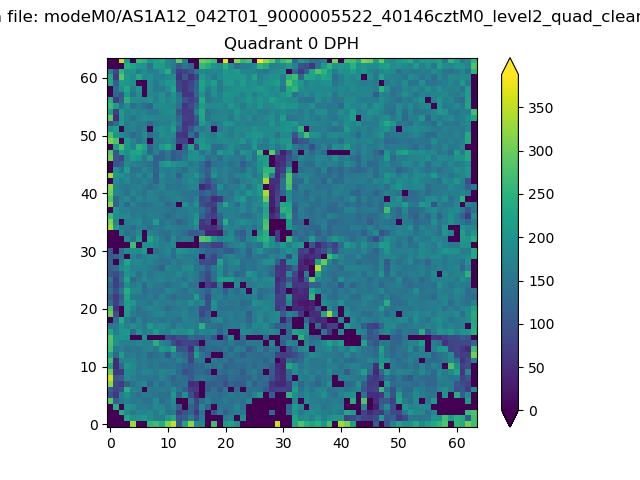 |
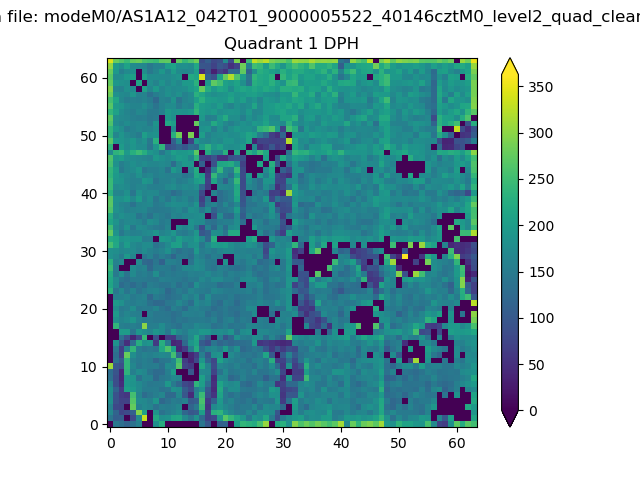 |
Quadrant B |
|---|---|---|---|
| Quadrant D | 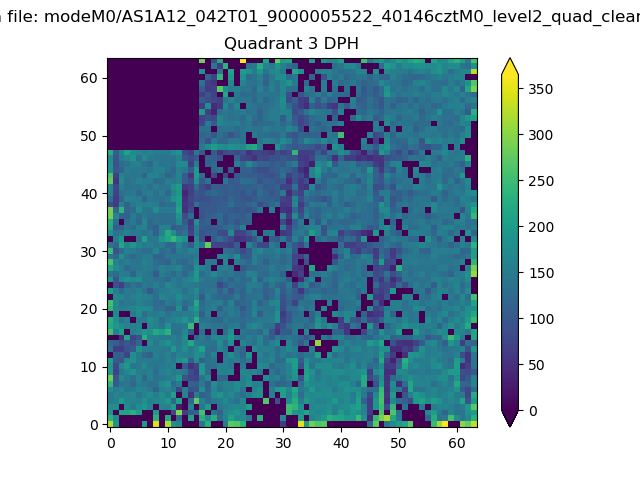 |
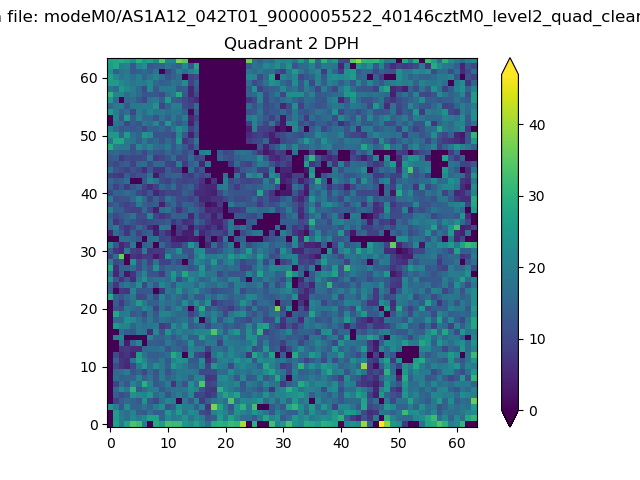 |
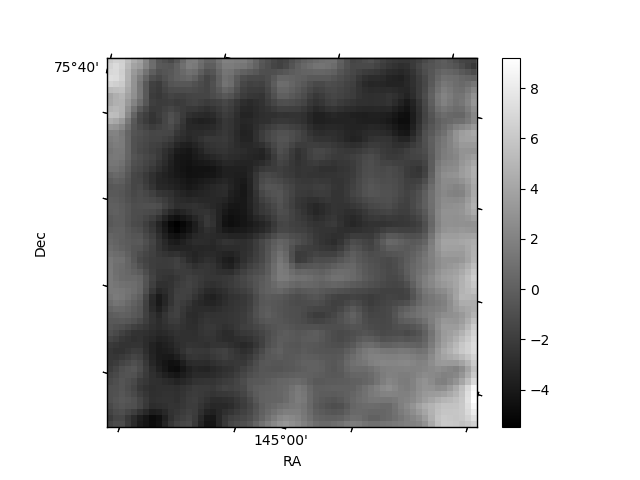
Quadrant C |
| Plot type | Count rate plots | Images |
|---|---|---|
| Comparison with Poisson distribution Blue bars denote a histogram of data divided into 1 sec bins. Red curve is a Poisson curve with rate = median count rate of data. |
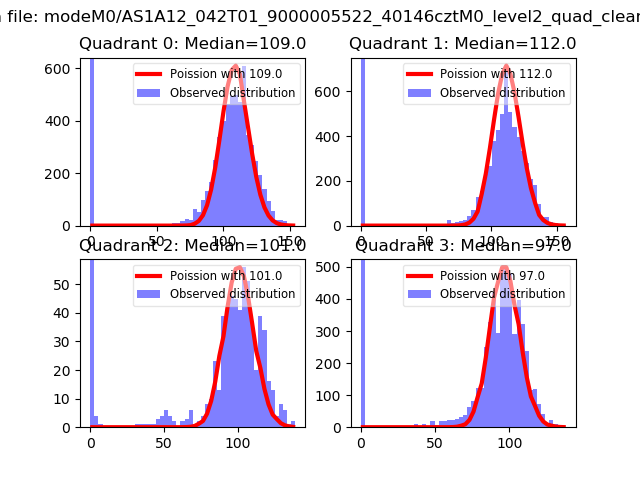 |
 |
| Quadrant-wise count rates Data is divided into 100 sec bins |
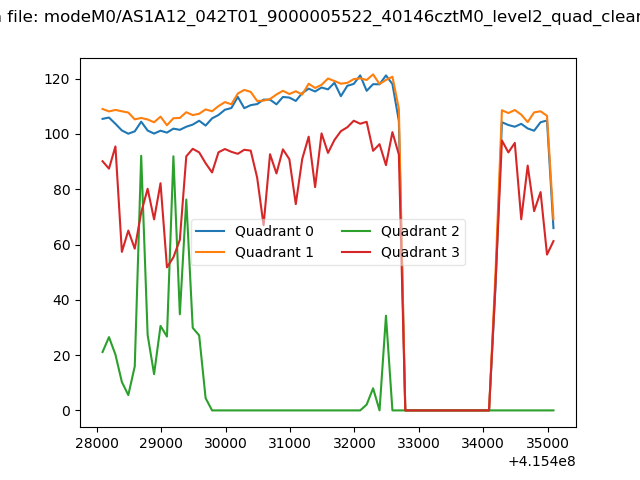 |
|
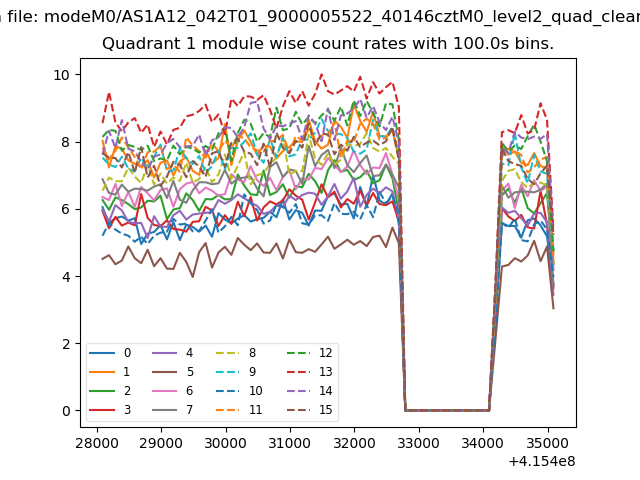
| Module-wise count rates for Quadrant A Data is divided into 100 sec bins |
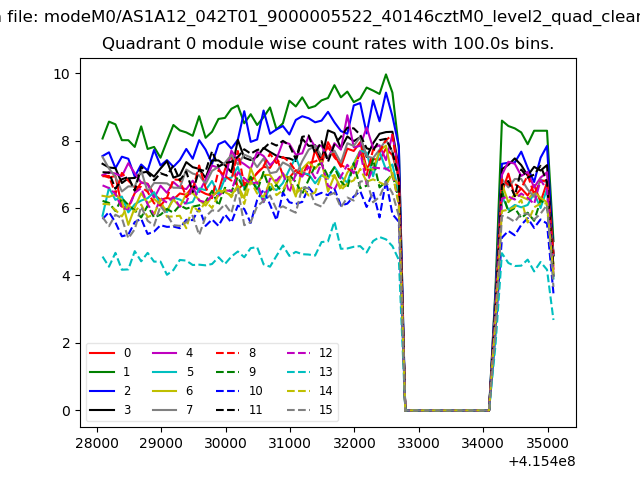 |
 |
| Module-wise count rates for Quadrant B Data is divided into 100 sec bins |
 |
 |
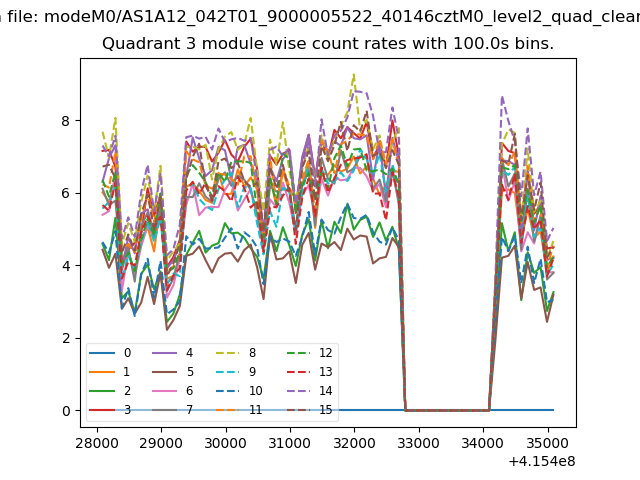
| Module-wise count rates for Quadrant C Data is divided into 100 sec bins |
 |
 |
| Module-wise count rates for Quadrant D Data is divided into 100 sec bins |
 |
 |
| Parameter | Plot |
|---|---|
| CZT HV Monitor | 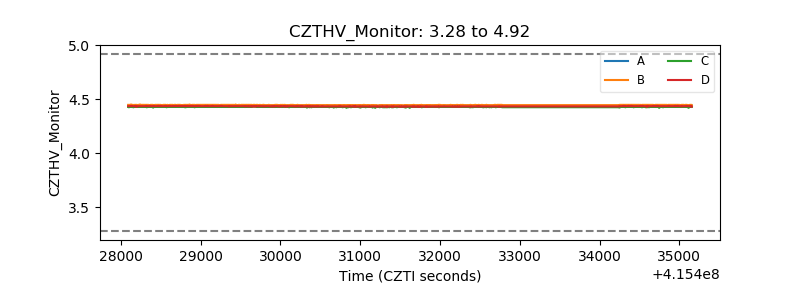 |
| D_VDD | 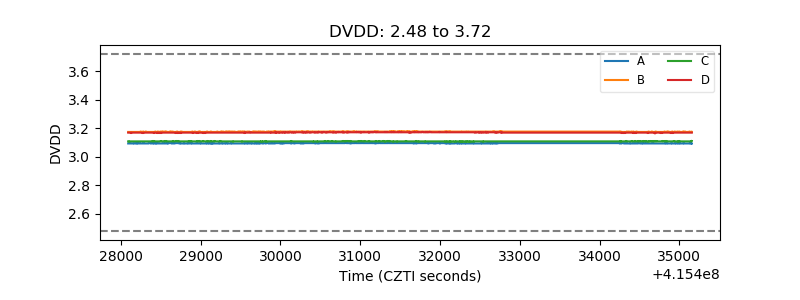 |
| Temperature 1 | 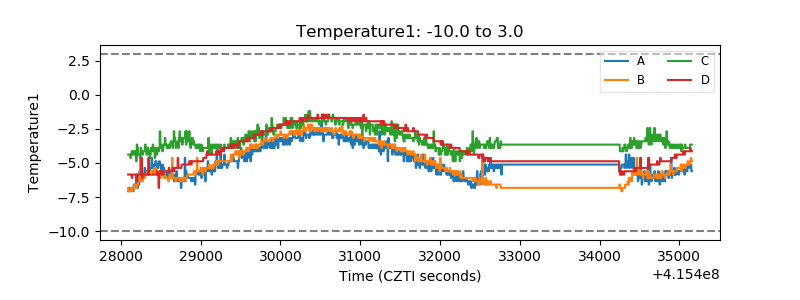 |
| Veto HV Monitor | 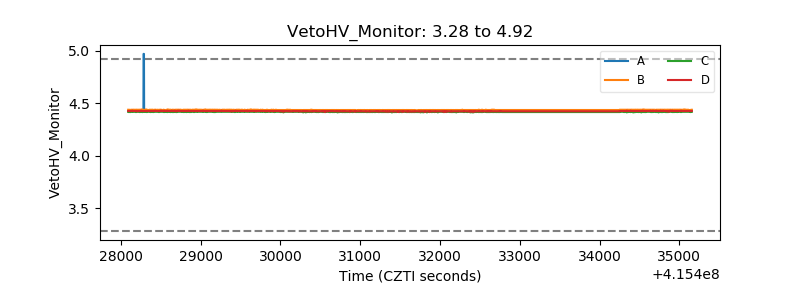 |
| Veto LLD | 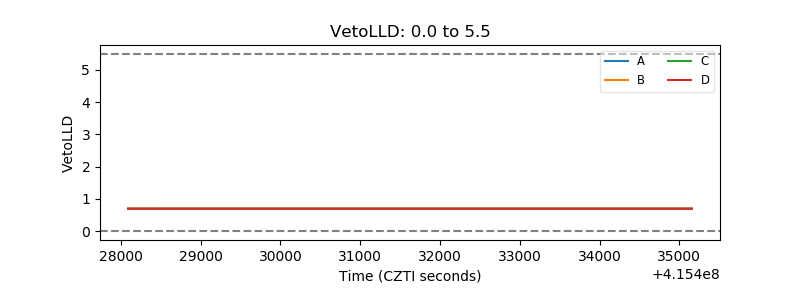 |
| Alpha Counter | 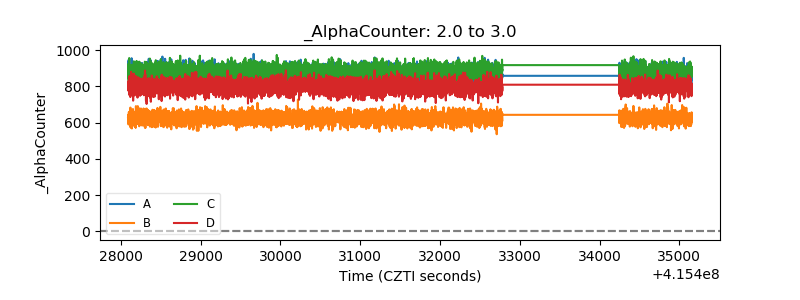 |
| _CPM_Rate | 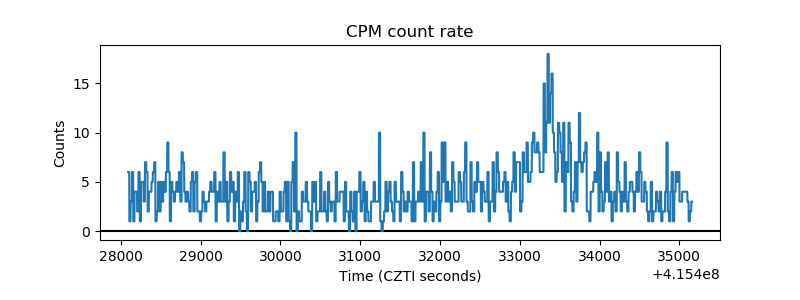 |
| CZT Counter | 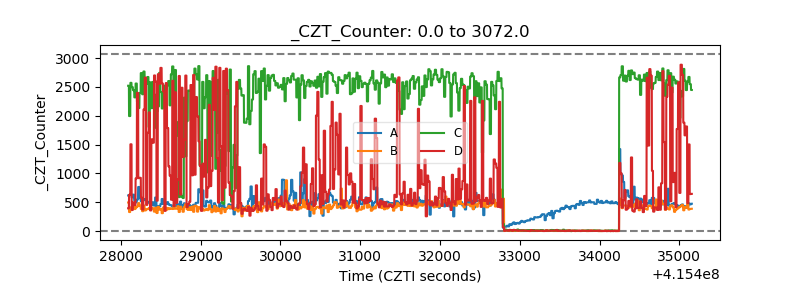 |
| +2.5 Volts monitor | 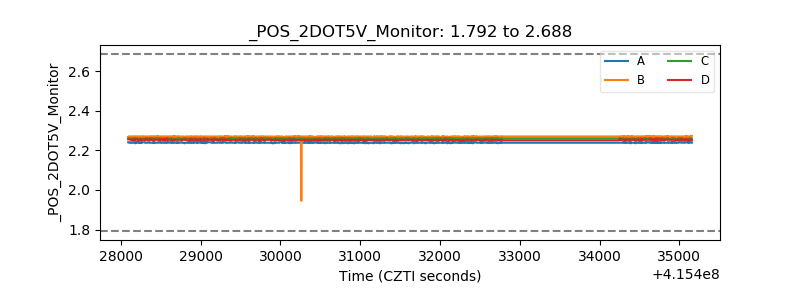 |
| +5 Volts monitor | 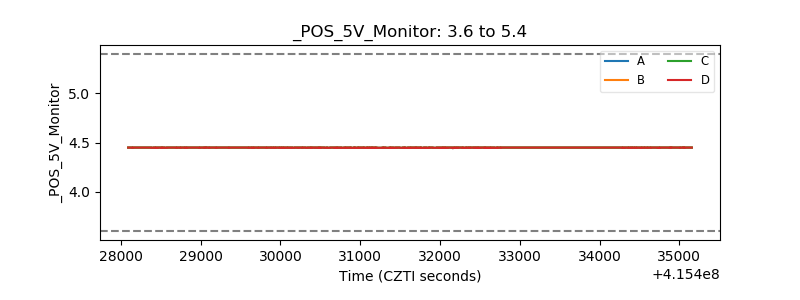 |
| _ROLL_ROT | 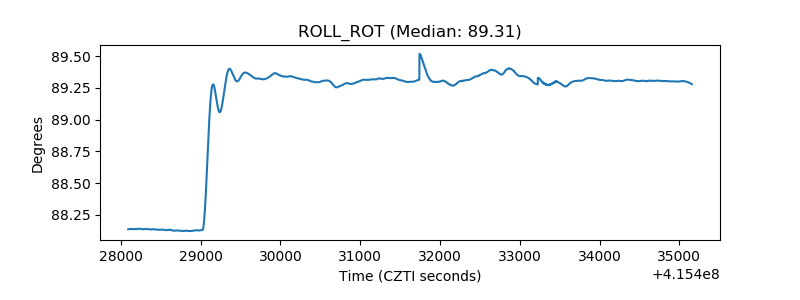 |
| _Roll_DEC | 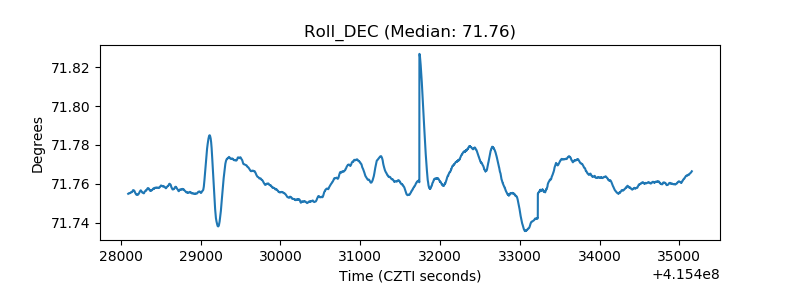 |
| _Roll_RA | 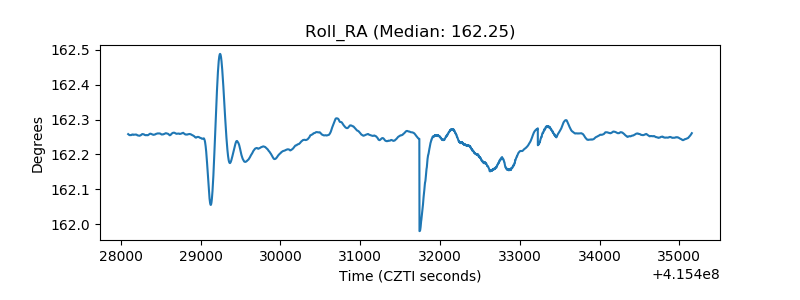 |
| Veto Counter | 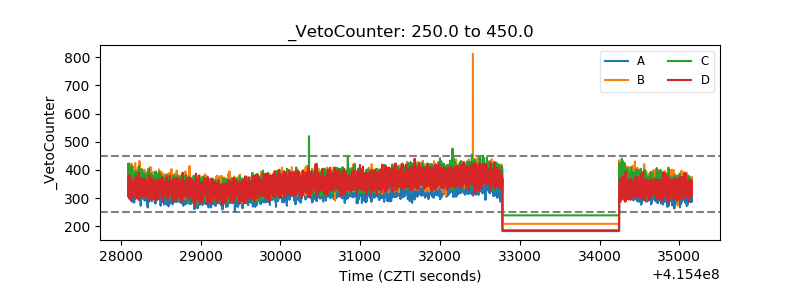 |