| Param | Original file | Final file |
|---|---|---|
| Filename | modeM0/AS1A12_042T01_9000005522_40147cztM0_level2.fits | modeM0/AS1A12_042T01_9000005522_40147cztM0_level2_quad_clean.evt |
| Size (bytes) | 686,675,520 | 74,197,440 |
| Size | 654.9 MB | 70.8 MB |
| Events in quadrant A | 3,102,783 | 633,851 |
| Events in quadrant B | 2,699,433 | 649,066 |
| Events in quadrant C | 14,571,909 | 23,064 |
| Events in quadrant D | 4,591,328 | 534,356 |
| Mode SS | |||
|---|---|---|---|
| Quadrant | BADHDUFLAG | Total packets | Discarded packets |
| A | 0 | 116 | 0 |
| B | 0 | 116 | 0 |
| C | 0 | 116 | 0 |
| D | 0 | 116 | 0 |
| Mode M0 | |||
|---|---|---|---|
| Quadrant | BADHDUFLAG | Total packets | Discarded packets |
| A | 0 | 12721 | 2 |
| B | 0 | 12110 | 1 |
| C | 0 | 47206 | 1 |
| D | 0 | 17621 | 1 |
| Mode M9 | |||
|---|---|---|---|
| Quadrant | BADHDUFLAG | Total packets | Discarded packets |
| A | 0 | 14 | 0 |
| B | 0 | 14 | 0 |
| C | 0 | 14 | 0 |
| D | 0 | 14 | 0 |
| Quadrant | Total seconds | Saturated seconds | Saturation percentage |
|---|---|---|---|
| A | 5821 | 6 | 0.103075% |
| B | 5821 | 11 | 0.188971% |
| C | 5821 | 5672 | 97.440302% |
| D | 5821 | 452 | 7.764989% |
Noise dominated data is calculated using 1-second bins in cleaned event files. If a bin has >2000 counts, and if more than 50% of those come from <1% of pixels, then it is considered to be noise-dominated and hence unusable.
| Quadrant | # 1 sec bins | Bins with >0 counts | Bins with >2000 counts | High rate bins dominated by noise | Noise dominated (total time) | Noise dominated (detector-on time) | Marked lightcurve |
|---|---|---|---|---|---|---|---|
| A | 7134 | 5822 | 6 | 6 | 0.08% | 0.10% | 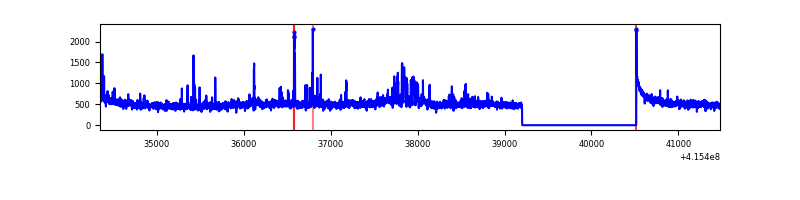 |
| B | 7134 | 5822 | 3 | 3 | 0.04% | 0.05% | 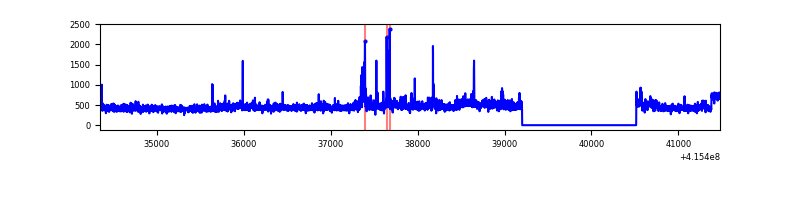 |
| C | 7133 | 5820 | 5613 | 5613 | 78.69% | 96.44% | 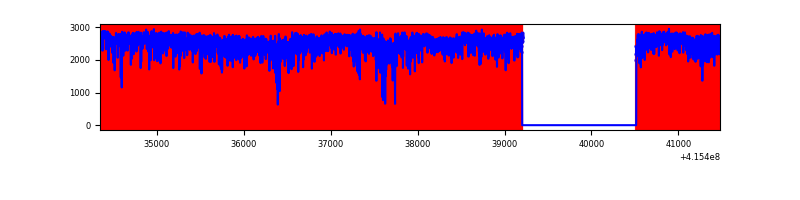 |
| D | 7134 | 5822 | 453 | 453 | 6.35% | 7.78% | 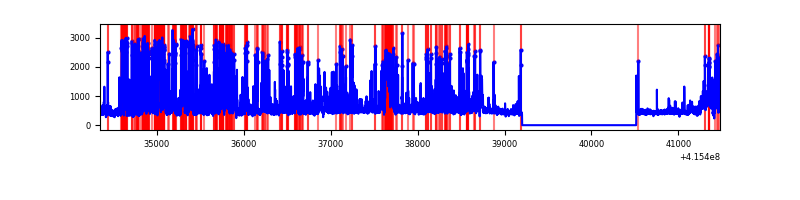 |
Top three noisy pixels from each quadrant. If the there are fewer than three noisy pixels in the level2.evt file, extra rows are filled as -1
| Pixel properties | Quadrant properties | ||||||
|---|---|---|---|---|---|---|---|
| Quadrant | DetID | PixID | Counts | Sigma | Mean | Median | Sigma |
| A | 10 | 83 | 435840 | 3417.28 | 622 | 609 | 127.4 |
| A | 12 | 189 | 199493 | 1561.57 | 622 | 609 | 127.4 |
| A | 2 | 79 | 50794 | 394.04 | 622 | 609 | 127.4 |
| B | 4 | 251 | 120388 | 988.03 | 619 | 600 | 121.2 |
| B | 0 | 190 | 48639 | 396.23 | 619 | 600 | 121.2 |
| B | 4 | 171 | 45394 | 369.47 | 619 | 600 | 121.2 |
| C | 9 | 187 | 13336739 | 206101.19 | 275 | 277 | 64.7 |
| C | 15 | 214 | 115724 | 1784.11 | 275 | 277 | 64.7 |
| C | 9 | 203 | 20396 | 310.92 | 275 | 277 | 64.7 |
| D | 12 | 0 | 1362639 | 9369.32 | 588 | 571 | 145.4 |
| D | 12 | 227 | 369845 | 2540.14 | 588 | 571 | 145.4 |
| D | 13 | 249 | 330556 | 2269.88 | 588 | 571 | 145.4 |
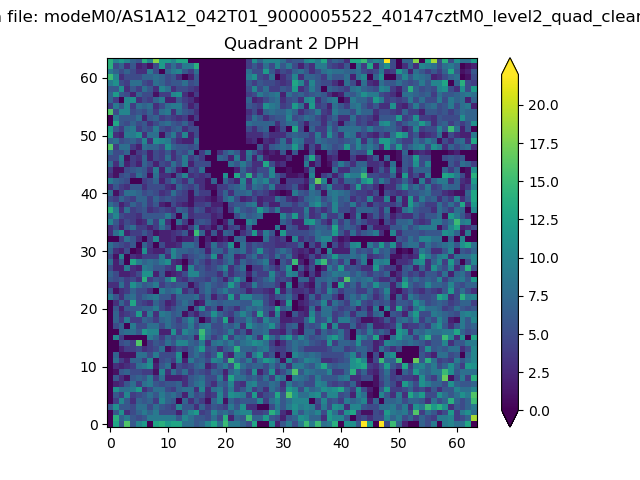
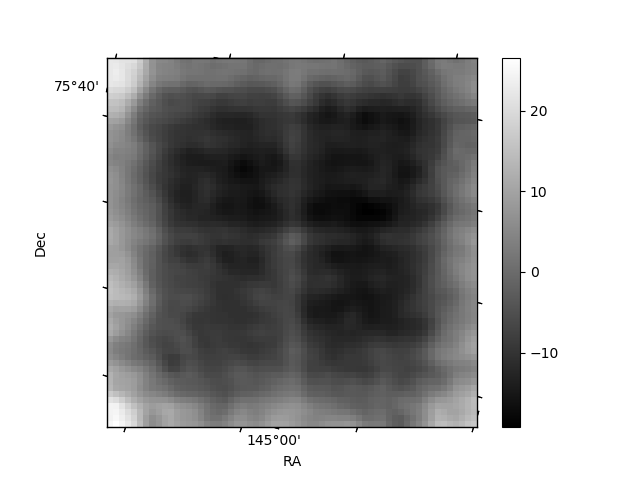
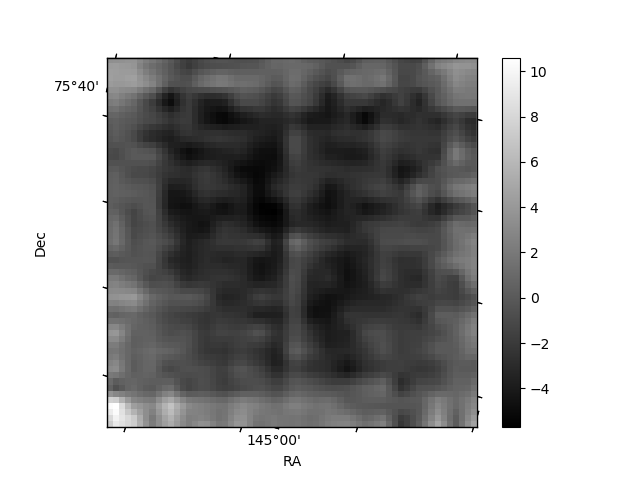
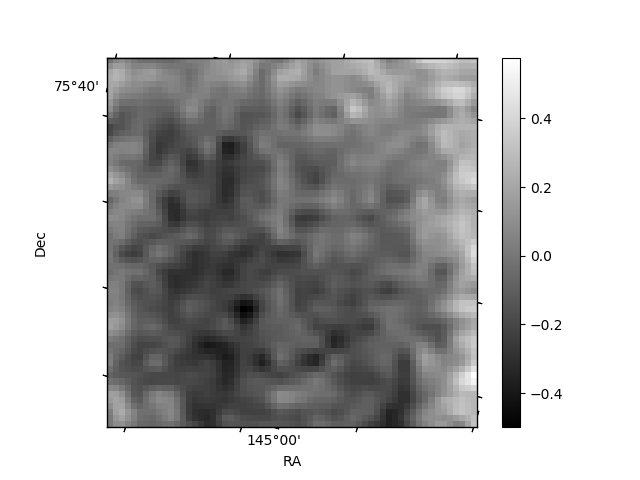
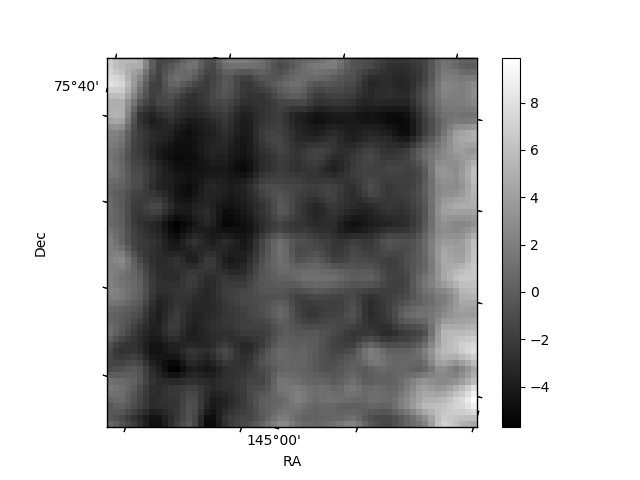
Histogram calculated using DETX and DETY for each event in the final _common_clean file
| Quadrant A | 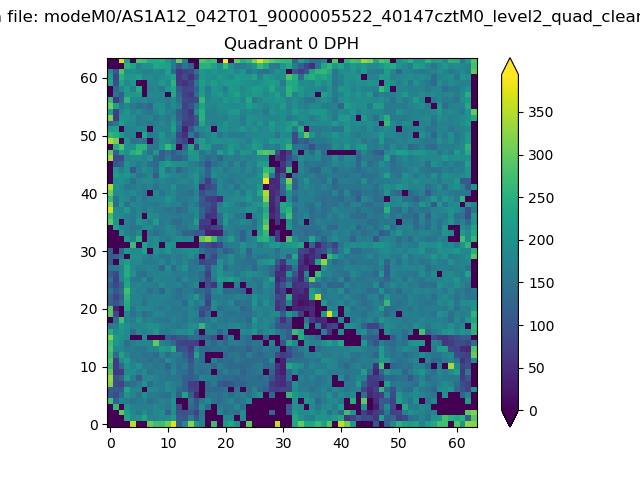 |
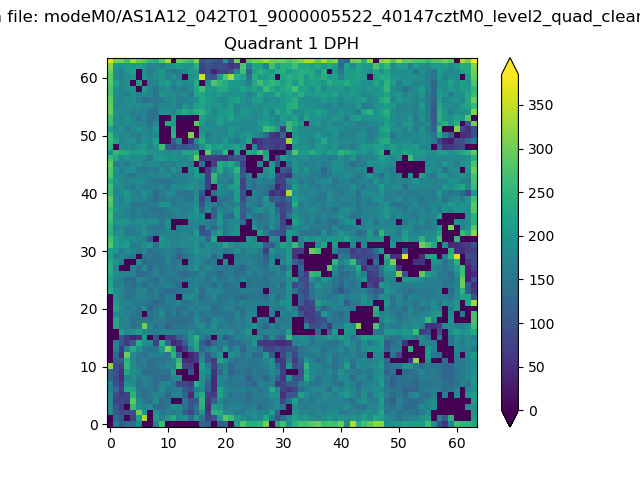 |
Quadrant B |
|---|---|---|---|
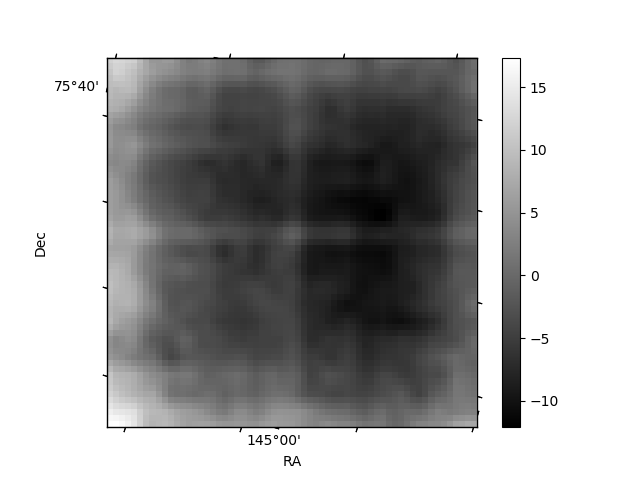
| Quadrant D | 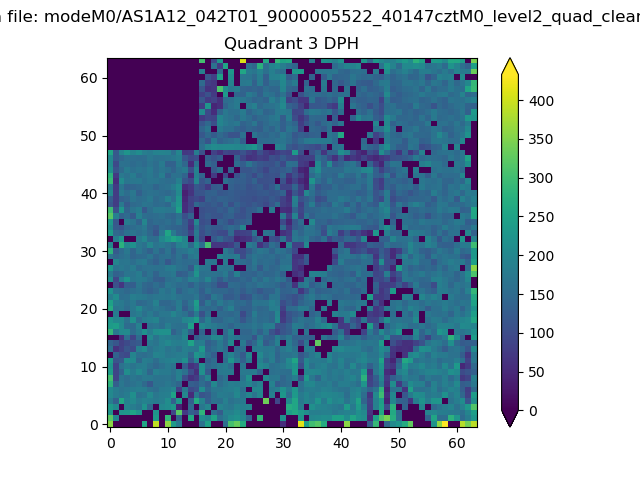 |
 |
Quadrant C |
| Plot type | Count rate plots | Images |
|---|---|---|
| Comparison with Poisson distribution Blue bars denote a histogram of data divided into 1 sec bins. Red curve is a Poisson curve with rate = median count rate of data. |
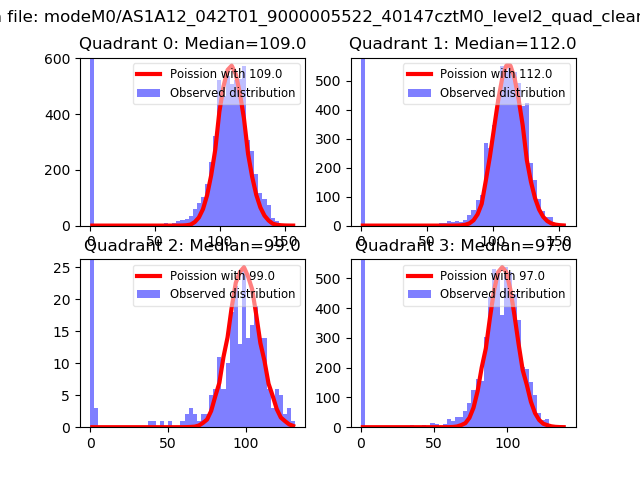 |
 |
| Quadrant-wise count rates Data is divided into 100 sec bins |
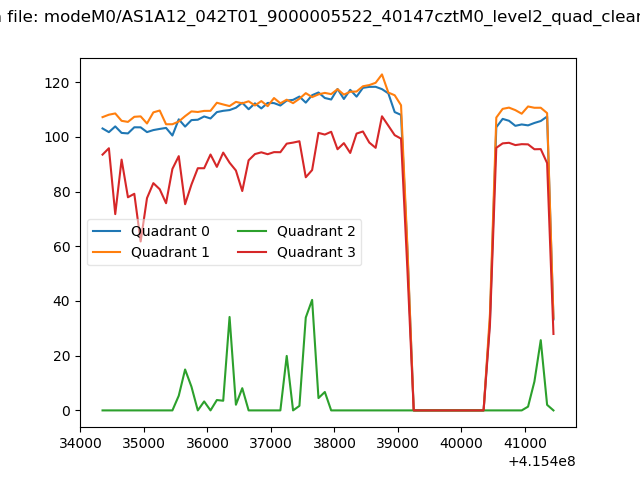 |
|
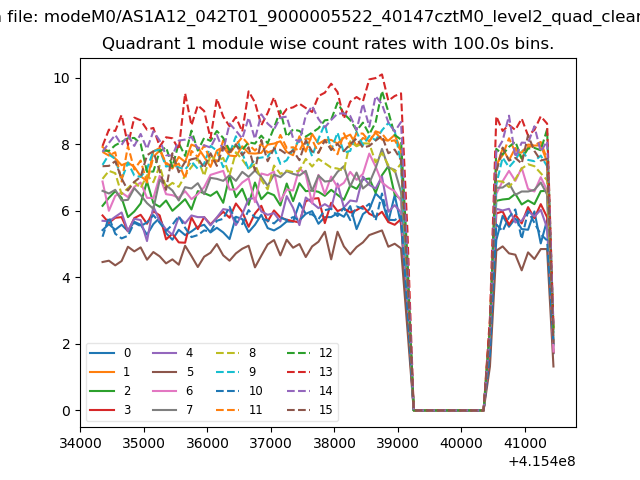
| Module-wise count rates for Quadrant A Data is divided into 100 sec bins |
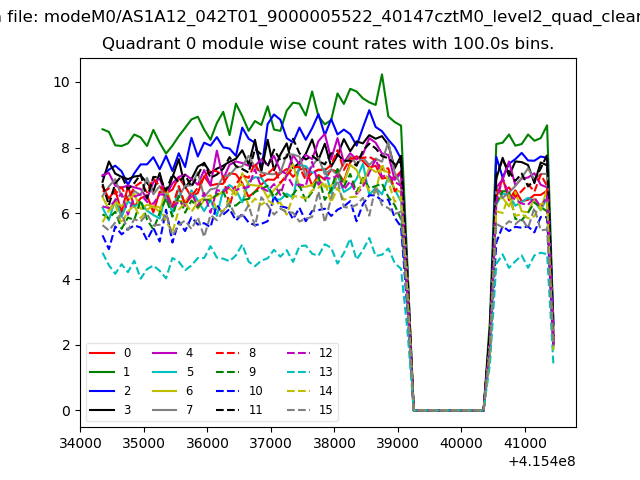 |
 |
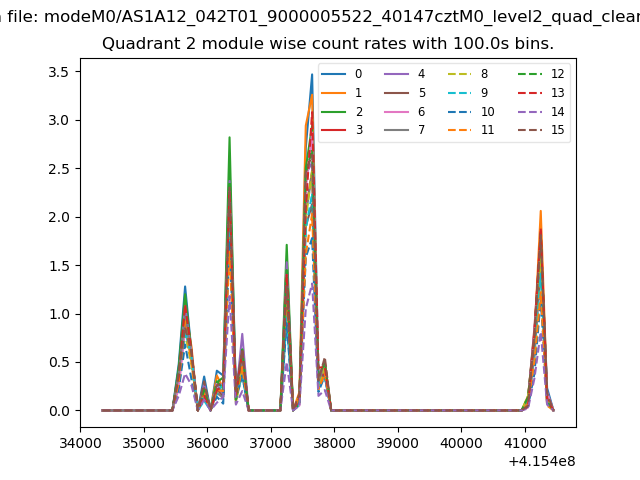
| Module-wise count rates for Quadrant B Data is divided into 100 sec bins |
 |
 |
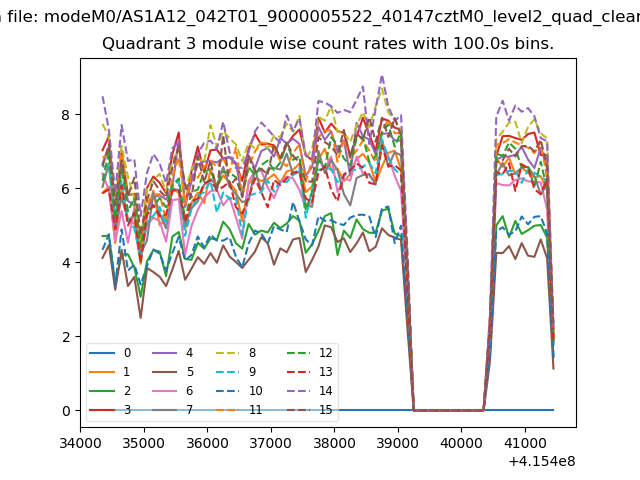
| Module-wise count rates for Quadrant C Data is divided into 100 sec bins |
 |
 |
| Module-wise count rates for Quadrant D Data is divided into 100 sec bins |
 |
 |
| Parameter | Plot |
|---|---|
| CZT HV Monitor | 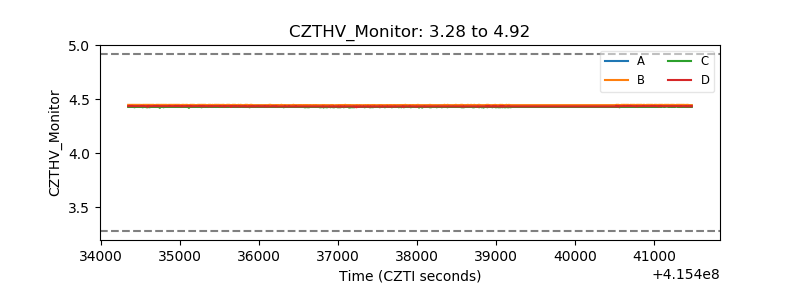 |
| D_VDD | 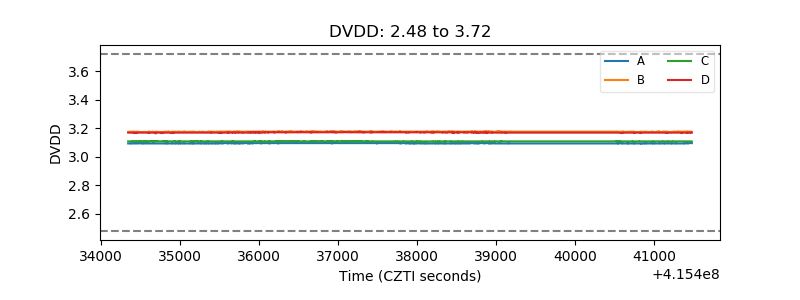 |
| Temperature 1 | 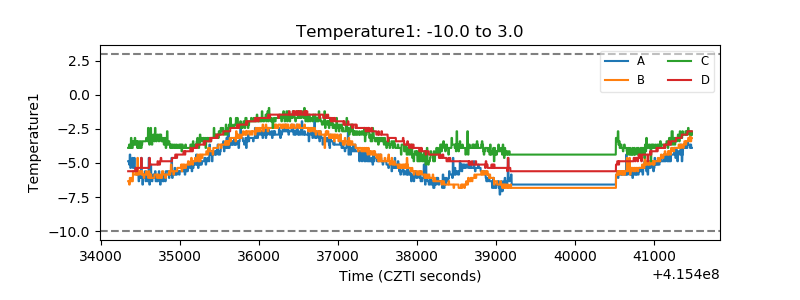 |
| Veto HV Monitor | 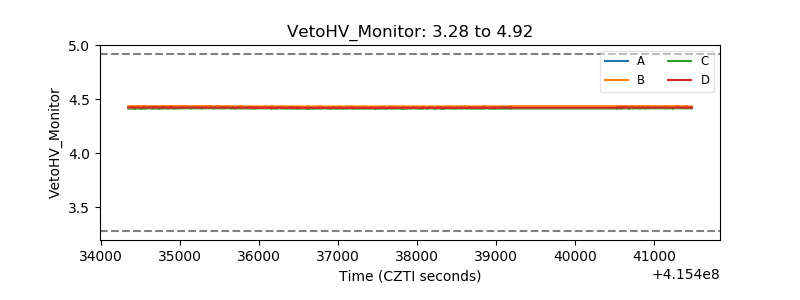 |
| Veto LLD | 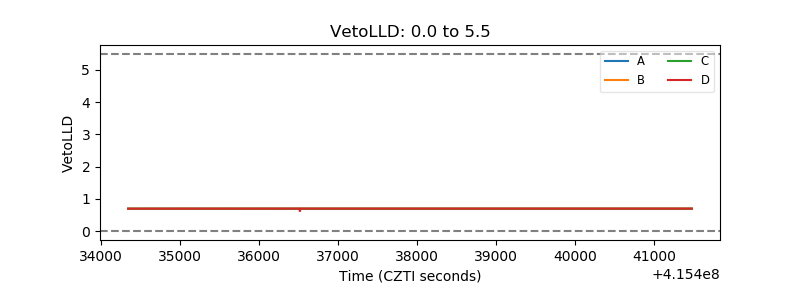 |
| Alpha Counter | 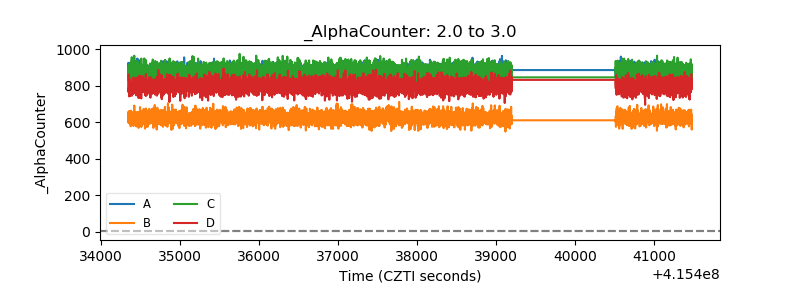 |
| _CPM_Rate | 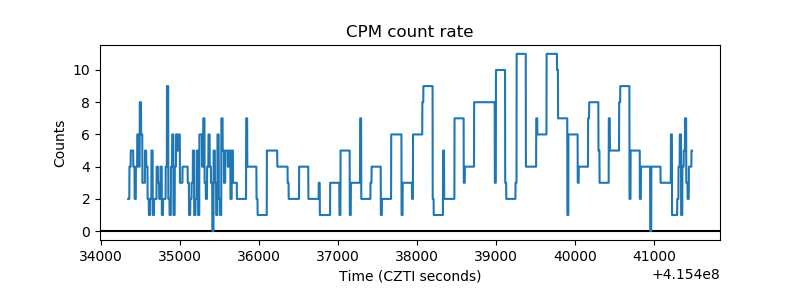 |
| CZT Counter | 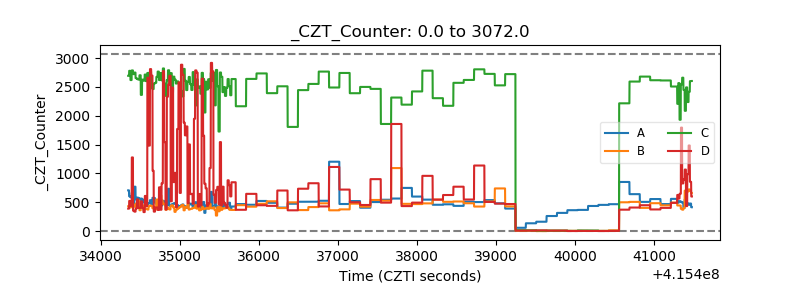 |
| +2.5 Volts monitor | 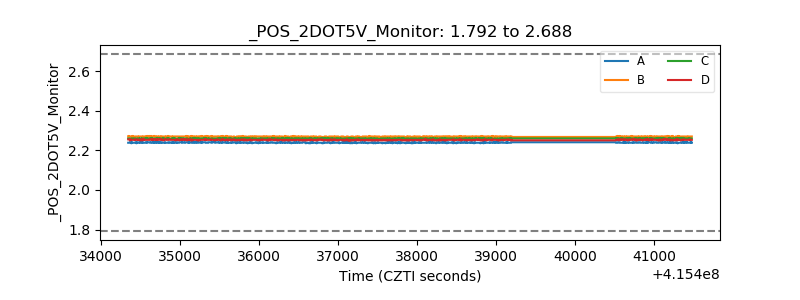 |
| +5 Volts monitor |  |
| _ROLL_ROT | 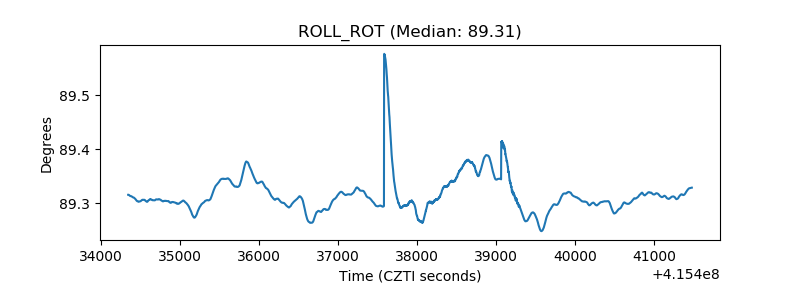 |
| _Roll_DEC | 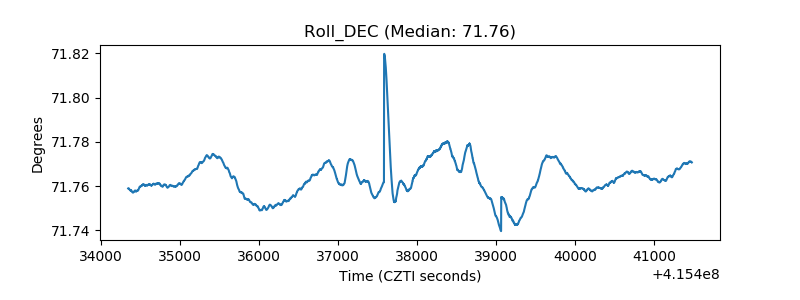 |
| _Roll_RA | 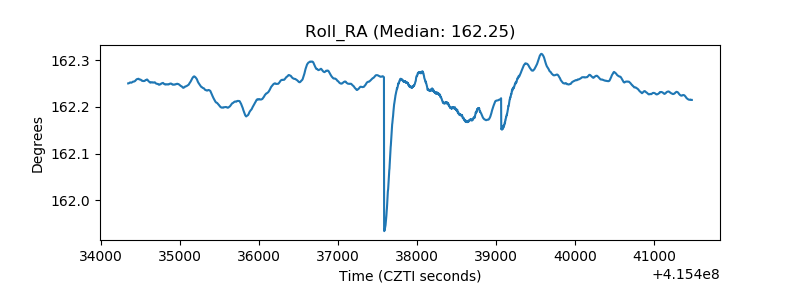 |
| Veto Counter | 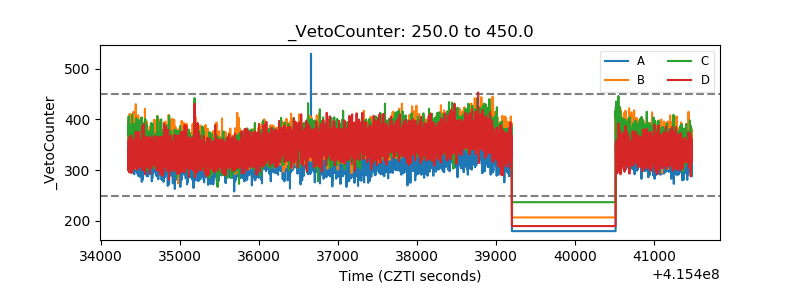 |