| Param | Original file | Final file |
|---|---|---|
| Filename | modeM0/AS1A12_042T01_9000005522_40150cztM0_level2.fits | modeM0/AS1A12_042T01_9000005522_40150cztM0_level2_quad_clean.evt |
| Size (bytes) | 1,511,424,000 | 155,088,000 |
| Size | 1.4 GB | 147.9 MB |
| Events in quadrant A | 6,262,290 | 1,345,423 |
| Events in quadrant B | 5,796,589 | 1,371,667 |
| Events in quadrant C | 31,107,558 | 57,060 |
| Events in quadrant D | 11,822,619 | 1,065,331 |
| Mode SS | |||
|---|---|---|---|
| Quadrant | BADHDUFLAG | Total packets | Discarded packets |
| A | 0 | 250 | 0 |
| B | 0 | 250 | 0 |
| C | 0 | 250 | 0 |
| D | 0 | 250 | 0 |
| Mode M0 | |||
|---|---|---|---|
| Quadrant | BADHDUFLAG | Total packets | Discarded packets |
| A | 0 | 26031 | 3 |
| B | 0 | 26016 | 3 |
| C | 0 | 100938 | 3 |
| D | 0 | 43593 | 3 |
| Mode M9 | |||
|---|---|---|---|
| Quadrant | BADHDUFLAG | Total packets | Discarded packets |
| A | 0 | 27 | 0 |
| B | 0 | 27 | 0 |
| C | 0 | 27 | 0 |
| D | 0 | 27 | 0 |
| Quadrant | Total seconds | Saturated seconds | Saturation percentage |
|---|---|---|---|
| A | 12383 | 22 | 0.177663% |
| B | 12383 | 31 | 0.250343% |
| C | 12383 | 11970 | 96.664782% |
| D | 12383 | 1454 | 11.741904% |
Noise dominated data is calculated using 1-second bins in cleaned event files. If a bin has >2000 counts, and if more than 50% of those come from <1% of pixels, then it is considered to be noise-dominated and hence unusable.
| Quadrant | # 1 sec bins | Bins with >0 counts | Bins with >2000 counts | High rate bins dominated by noise | Noise dominated (total time) | Noise dominated (detector-on time) | Marked lightcurve |
|---|---|---|---|---|---|---|---|
| A | 15039 | 12385 | 9 | 9 | 0.06% | 0.07% | 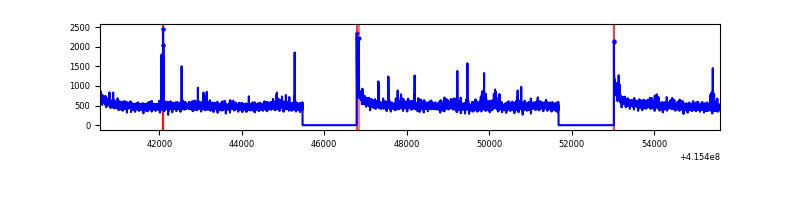 |
| B | 15039 | 12385 | 12 | 12 | 0.08% | 0.10% | 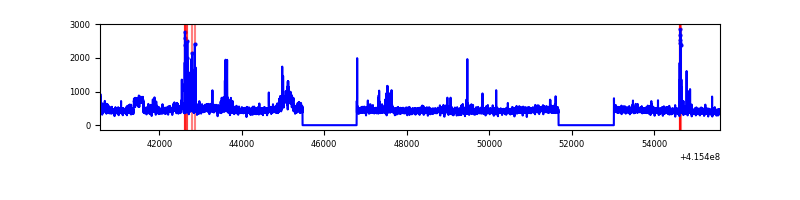 |
| C | 15038 | 12382 | 11906 | 11906 | 79.17% | 96.16% | 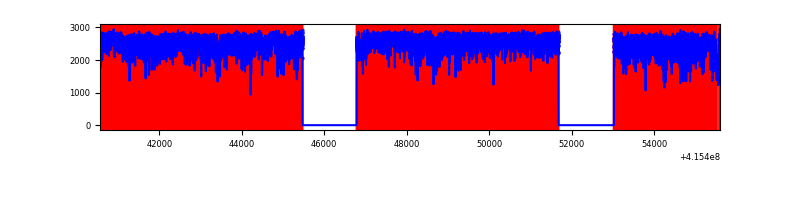 |
| D | 15038 | 12383 | 1547 | 1547 | 10.29% | 12.49% | 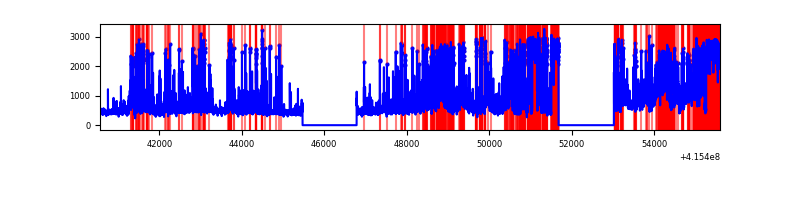 |
Top three noisy pixels from each quadrant. If the there are fewer than three noisy pixels in the level2.evt file, extra rows are filled as -1
| Pixel properties | Quadrant properties | ||||||
|---|---|---|---|---|---|---|---|
| Quadrant | DetID | PixID | Counts | Sigma | Mean | Median | Sigma |
| A | 10 | 83 | 919927 | 3383.18 | 1337 | 1308 | 271.5 |
| A | 12 | 189 | 71102 | 257.04 | 1337 | 1308 | 271.5 |
| A | 2 | 79 | 69956 | 252.82 | 1337 | 1308 | 271.5 |
| B | 4 | 251 | 292644 | 1151.38 | 1323 | 1289 | 253.0 |
| B | 5 | 255 | 82799 | 322.11 | 1323 | 1289 | 253.0 |
| B | 4 | 171 | 70423 | 273.2 | 1323 | 1289 | 253.0 |
| C | 9 | 187 | 28551470 | 217310.79 | 568 | 572 | 131.4 |
| C | 15 | 214 | 240730 | 1827.93 | 568 | 572 | 131.4 |
| C | 9 | 203 | 40247 | 301.98 | 568 | 572 | 131.4 |
| D | 12 | 227 | 5079184 | 16944.27 | 1229 | 1193 | 299.7 |
| D | 1 | 52 | 570138 | 1898.46 | 1229 | 1193 | 299.7 |
| D | 12 | 233 | 411855 | 1370.3 | 1229 | 1193 | 299.7 |
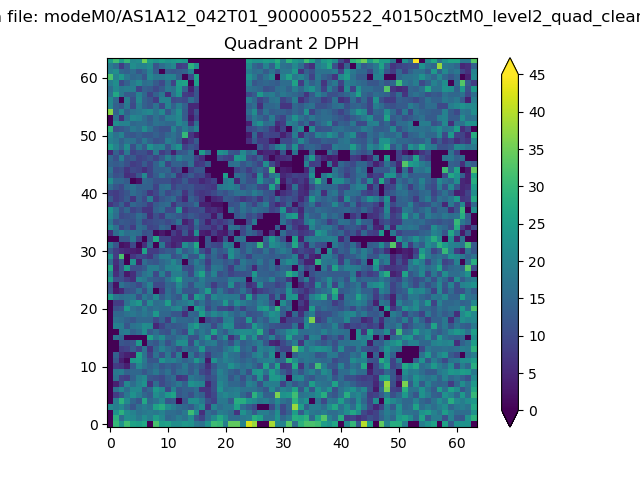
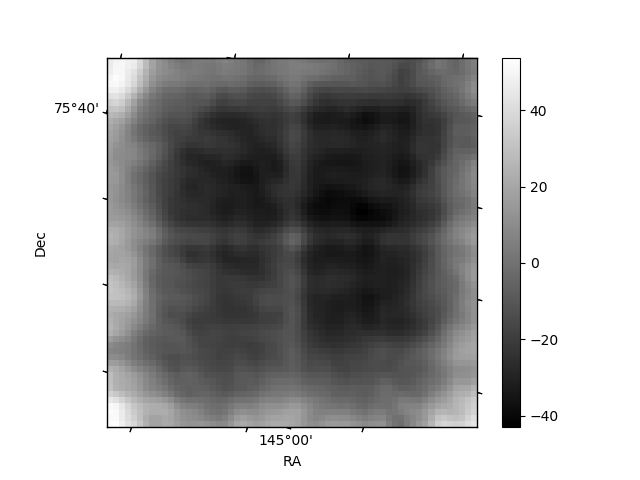
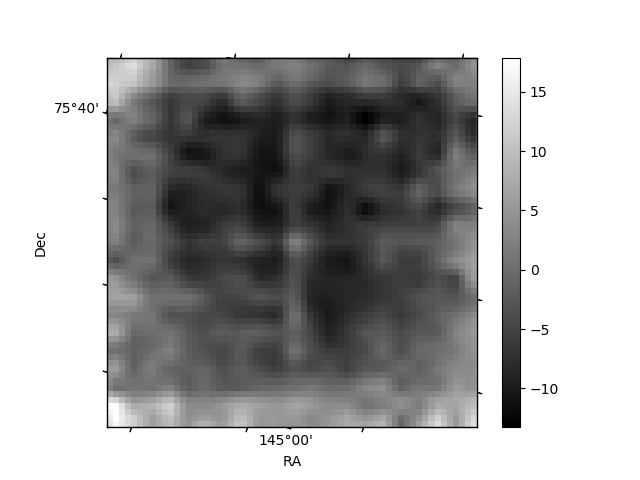
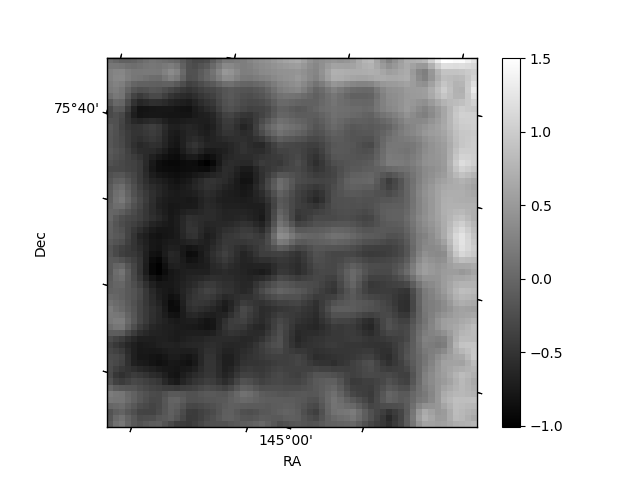
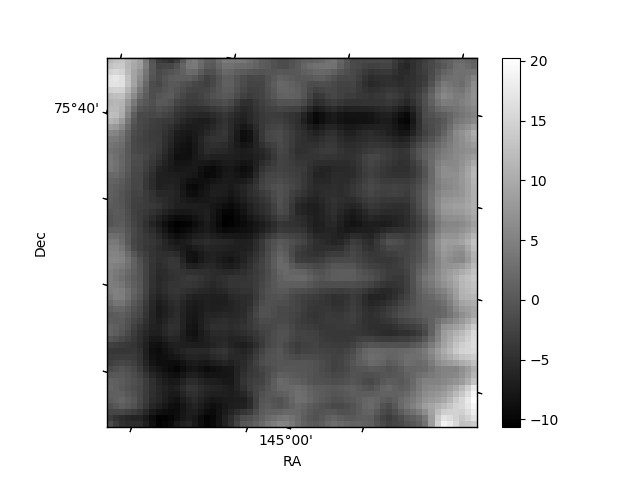
Histogram calculated using DETX and DETY for each event in the final _common_clean file
| Quadrant A | 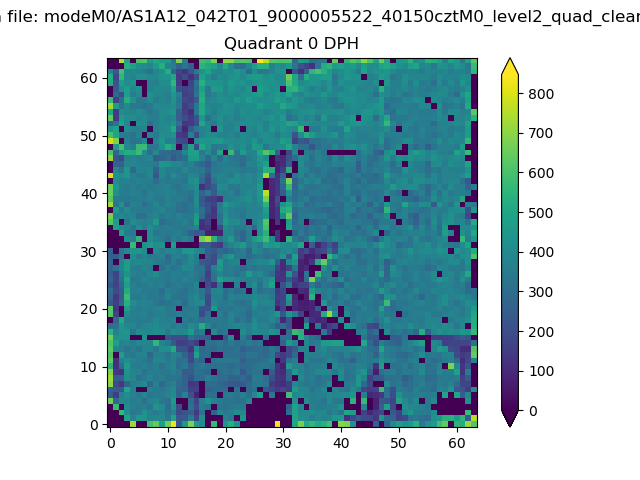 |
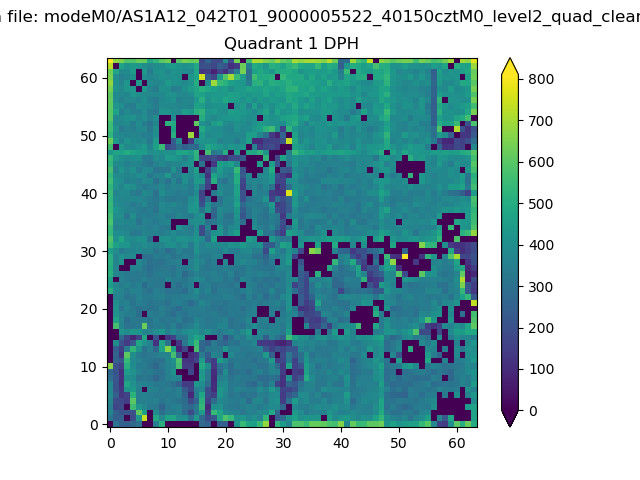 |
Quadrant B |
|---|---|---|---|
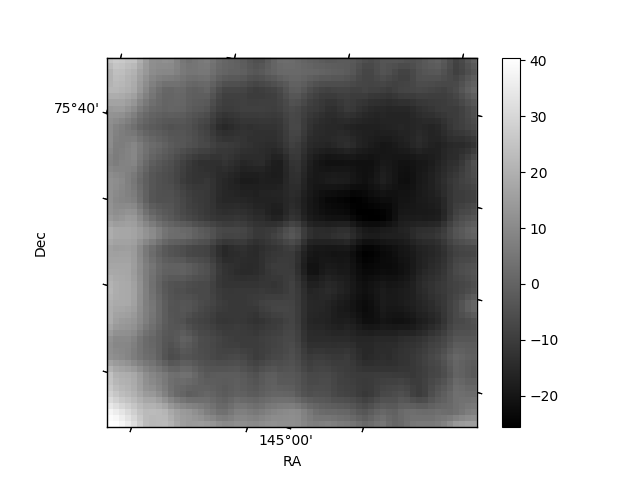
| Quadrant D | 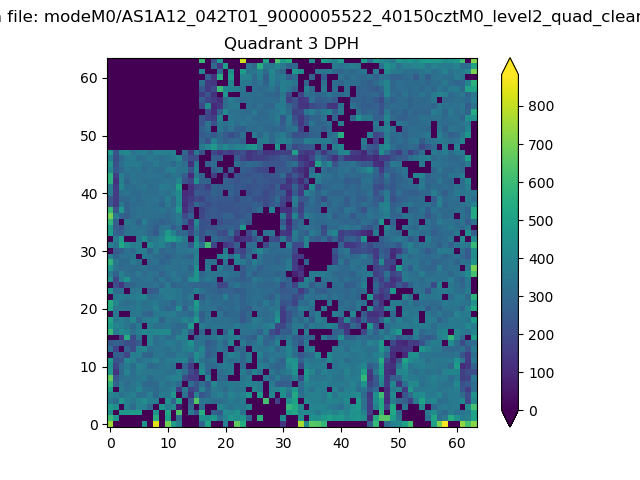 |
 |
Quadrant C |
| Plot type | Count rate plots | Images |
|---|---|---|
| Comparison with Poisson distribution Blue bars denote a histogram of data divided into 1 sec bins. Red curve is a Poisson curve with rate = median count rate of data. |
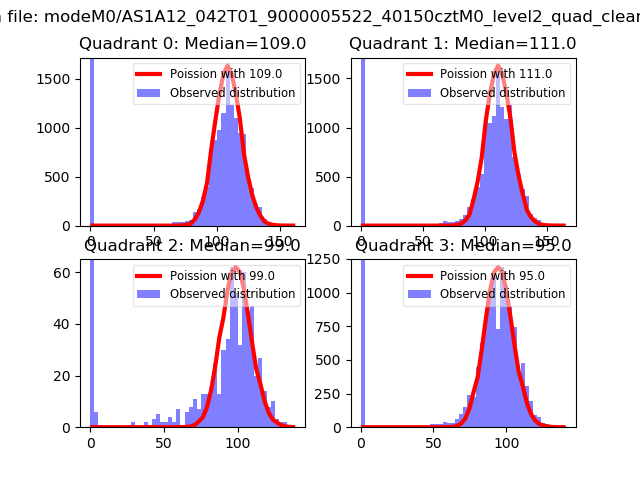 |
 |
| Quadrant-wise count rates Data is divided into 100 sec bins |
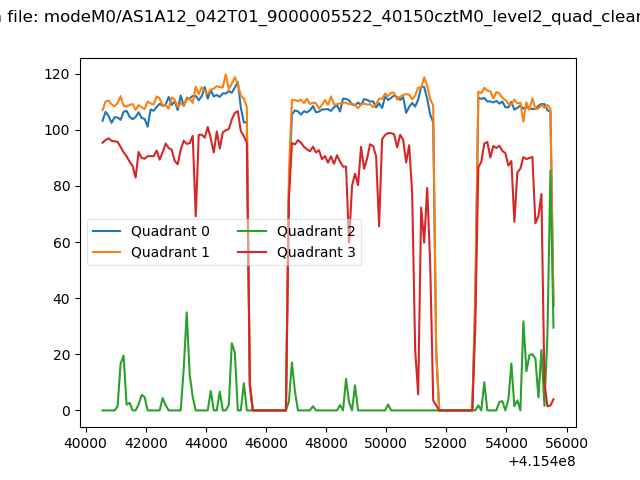 |
|
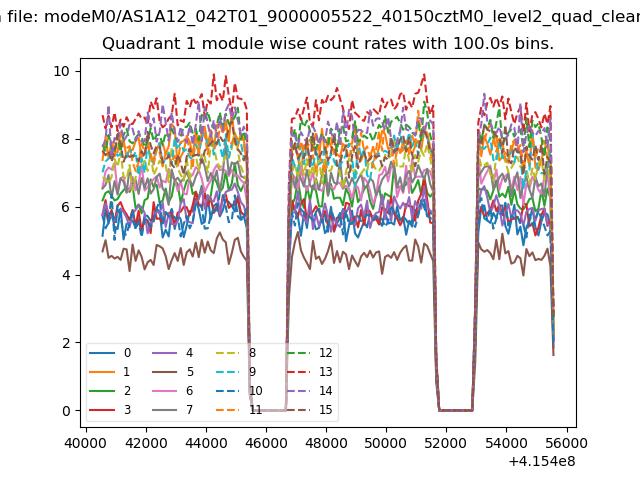
| Module-wise count rates for Quadrant A Data is divided into 100 sec bins |
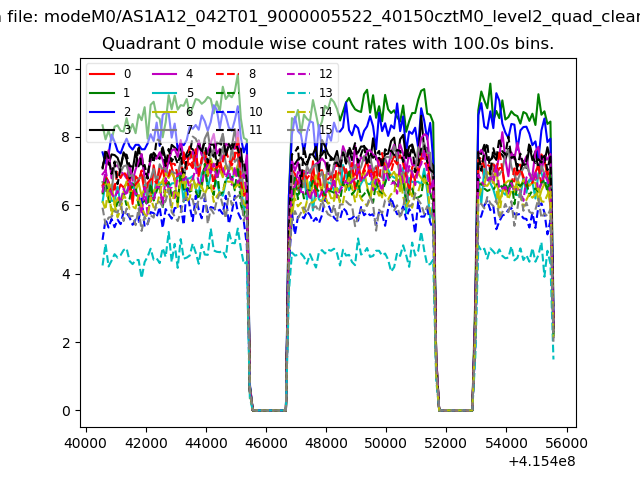 |
 |
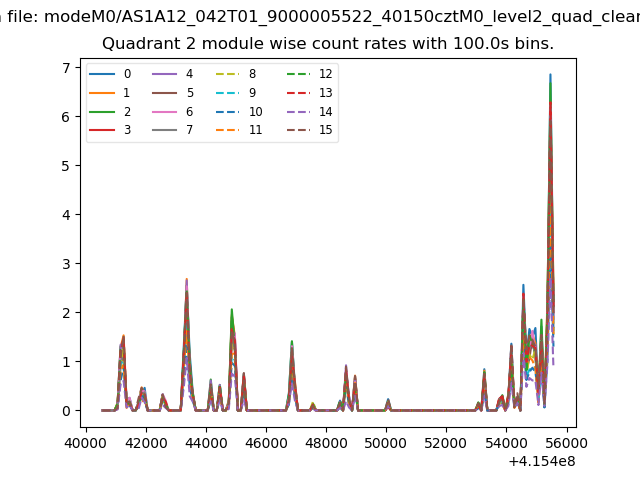
| Module-wise count rates for Quadrant B Data is divided into 100 sec bins |
 |
 |
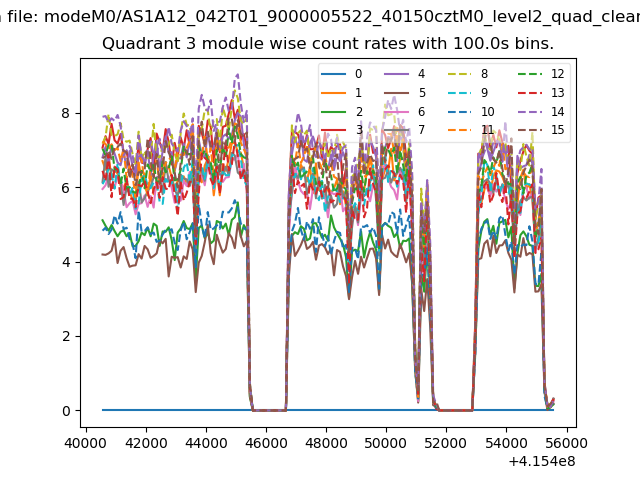
| Module-wise count rates for Quadrant C Data is divided into 100 sec bins |
 |
 |
| Module-wise count rates for Quadrant D Data is divided into 100 sec bins |
 |
 |
| Parameter | Plot |
|---|---|
| CZT HV Monitor | 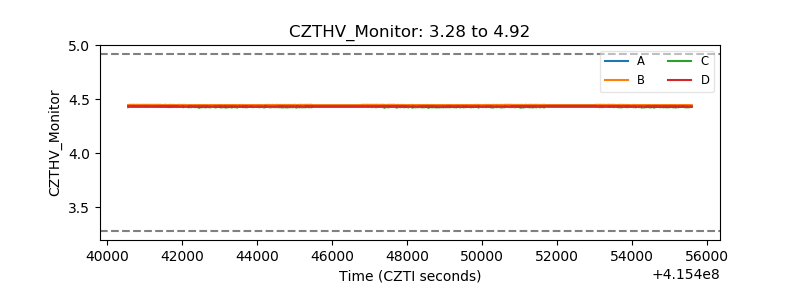 |
| D_VDD | 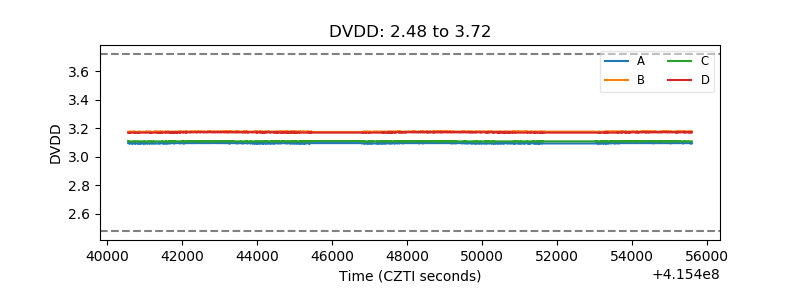 |
| Temperature 1 | 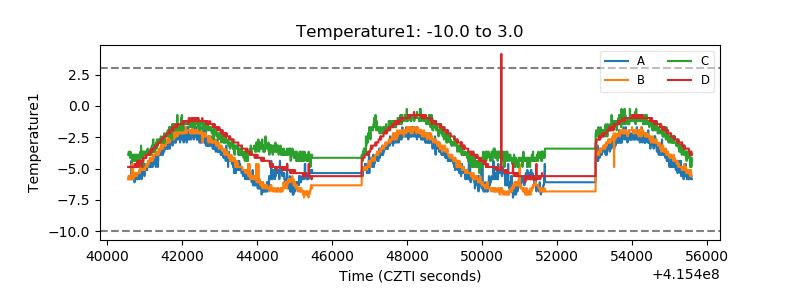 |
| Veto HV Monitor | 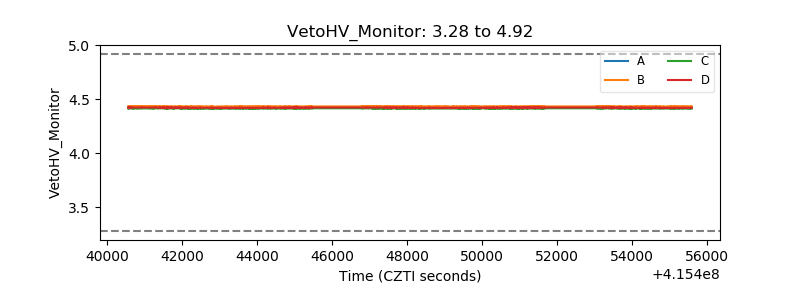 |
| Veto LLD | 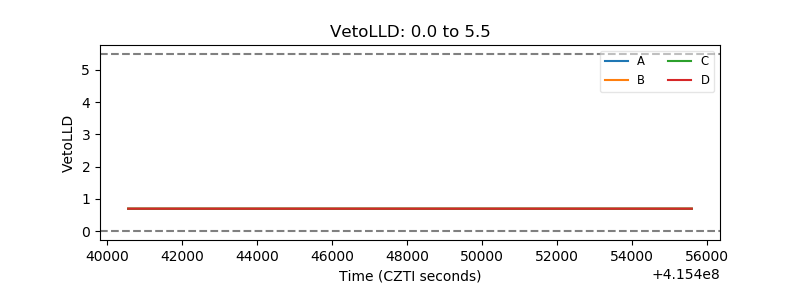 |
| Alpha Counter | 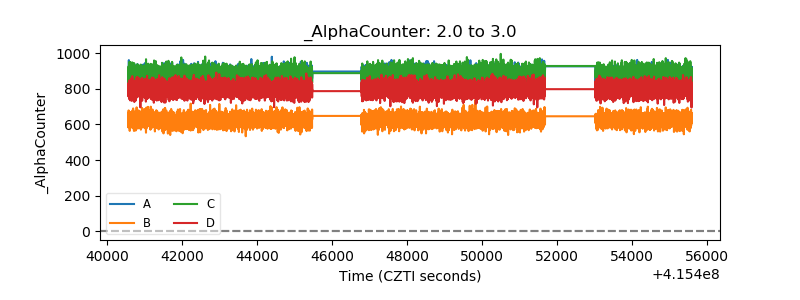 |
| _CPM_Rate | 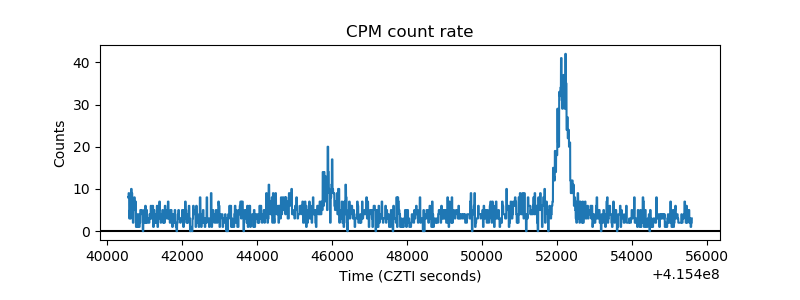 |
| CZT Counter | 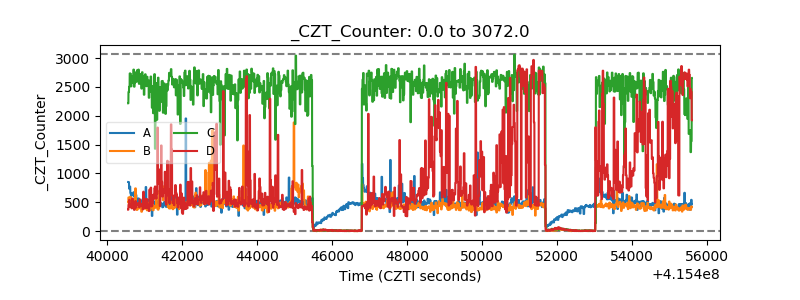 |
| +2.5 Volts monitor | 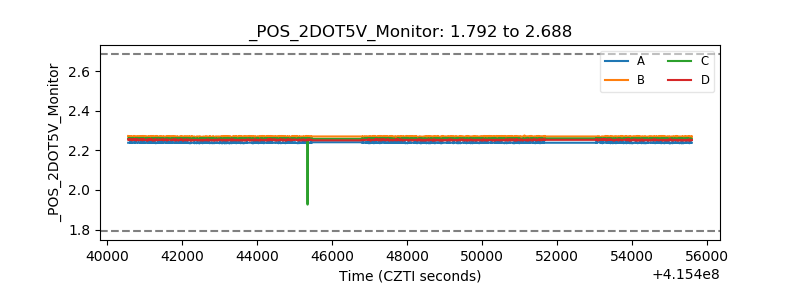 |
| +5 Volts monitor | 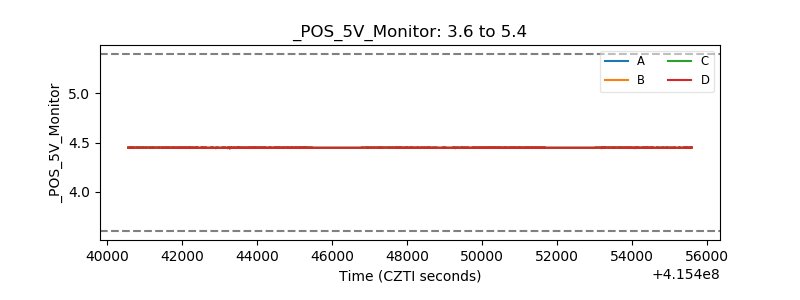 |
| _ROLL_ROT | 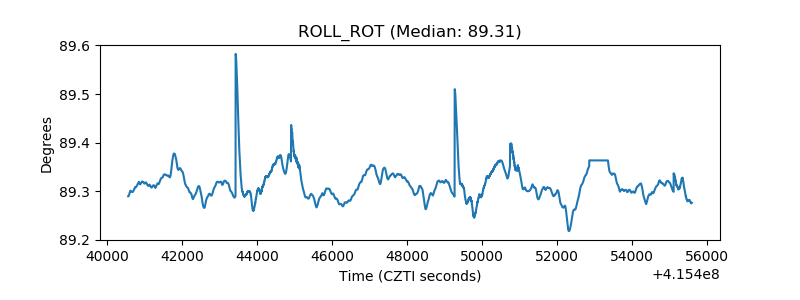 |
| _Roll_DEC | 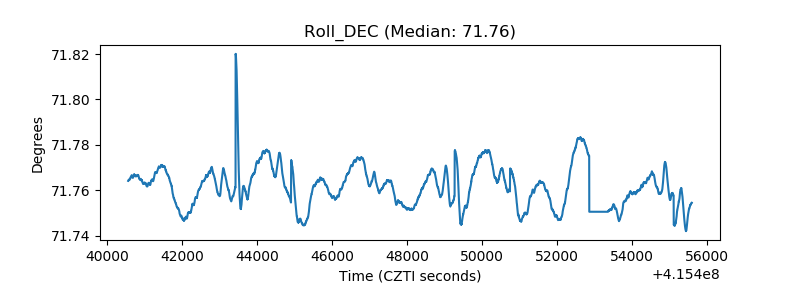 |
| _Roll_RA | 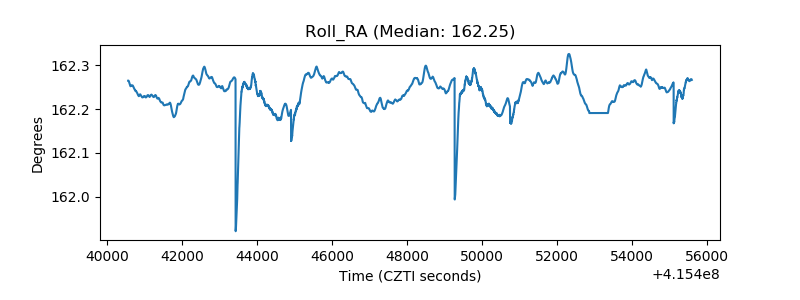 |
| Veto Counter | 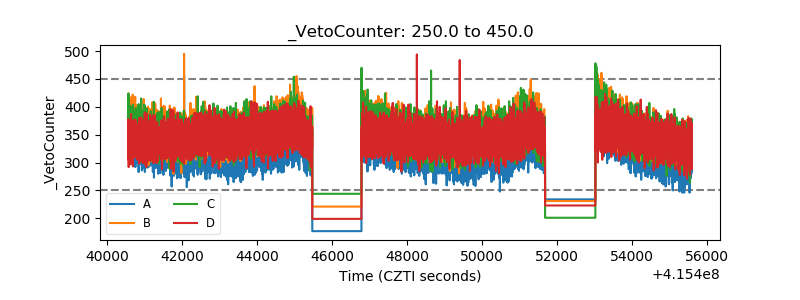 |