| Param | Original file | Final file |
|---|---|---|
| Filename | modeM0/AS1A12_068T02_9000005524_40150cztM0_level2.fits | modeM0/AS1A12_068T02_9000005524_40150cztM0_level2_quad_clean.evt |
| Size (bytes) | 299,243,520 | 36,725,760 |
| Size | 285.4 MB | 35.0 MB |
| Events in quadrant A | 1,407,025 | 288,898 |
| Events in quadrant B | 1,234,371 | 296,674 |
| Events in quadrant C | 5,485,708 | 104,281 |
| Events in quadrant D | 2,745,917 | 235,083 |
| Mode M9 | |||
|---|---|---|---|
| Quadrant | BADHDUFLAG | Total packets | Discarded packets |
| A | 0 | 14 | 0 |
| B | 0 | 14 | 0 |
| C | 0 | 14 | 0 |
| D | 0 | 14 | 0 |
| Mode SS | |||
|---|---|---|---|
| Quadrant | BADHDUFLAG | Total packets | Discarded packets |
| A | 0 | 56 | 0 |
| B | 0 | 56 | 0 |
| C | 0 | 56 | 0 |
| D | 0 | 56 | 0 |
| Mode M0 | |||
|---|---|---|---|
| Quadrant | BADHDUFLAG | Total packets | Discarded packets |
| A | 0 | 5819 | 2 |
| B | 0 | 5443 | 1 |
| C | 0 | 18079 | 1 |
| D | 0 | 10106 | 1 |
| Quadrant | Total seconds | Saturated seconds | Saturation percentage |
|---|---|---|---|
| A | 2603 | 10 | 0.384172% |
| B | 2603 | 8 | 0.307338% |
| C | 2603 | 1721 | 66.116020% |
| D | 2603 | 318 | 12.216673% |
Noise dominated data is calculated using 1-second bins in cleaned event files. If a bin has >2000 counts, and if more than 50% of those come from <1% of pixels, then it is considered to be noise-dominated and hence unusable.
| Quadrant | # 1 sec bins | Bins with >0 counts | Bins with >2000 counts | High rate bins dominated by noise | Noise dominated (total time) | Noise dominated (detector-on time) | Marked lightcurve |
|---|---|---|---|---|---|---|---|
| A | 4066 | 2604 | 2 | 2 | 0.05% | 0.08% | 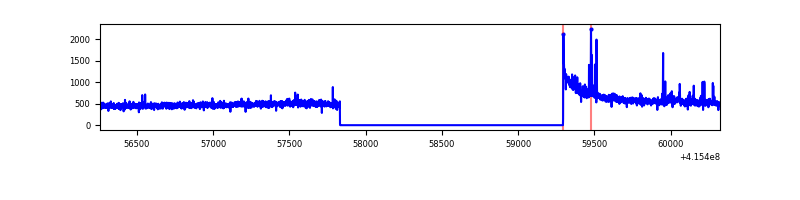 |
| B | 4066 | 2604 | 6 | 6 | 0.15% | 0.23% | 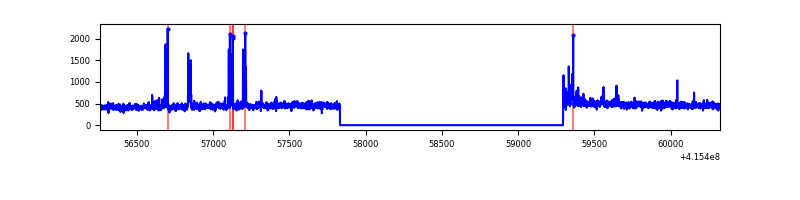 |
| C | 4066 | 2603 | 1746 | 1746 | 42.94% | 67.08% | 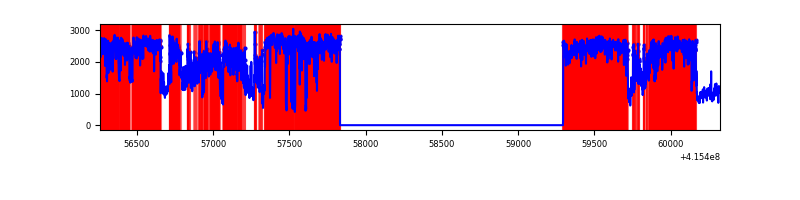 |
| D | 4066 | 2604 | 377 | 377 | 9.27% | 14.48% | 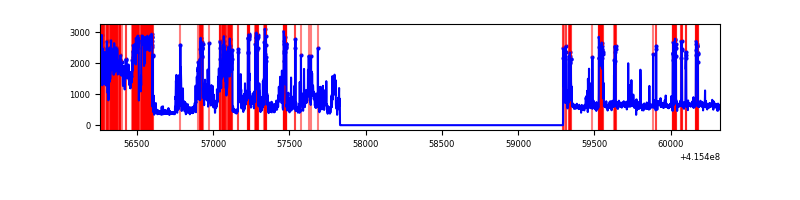 |
Top three noisy pixels from each quadrant. If the there are fewer than three noisy pixels in the level2.evt file, extra rows are filled as -1
| Pixel properties | Quadrant properties | ||||||
|---|---|---|---|---|---|---|---|
| Quadrant | DetID | PixID | Counts | Sigma | Mean | Median | Sigma |
| A | 10 | 83 | 233819 | 3796.19 | 293 | 287 | 61.5 |
| A | 13 | 248 | 23672 | 380.14 | 293 | 287 | 61.5 |
| A | 9 | 143 | 7594 | 118.78 | 293 | 287 | 61.5 |
| B | 4 | 171 | 73851 | 1238.62 | 293 | 284 | 59.4 |
| B | 0 | 190 | 9174 | 149.68 | 293 | 284 | 59.4 |
| B | 12 | 111 | 7482 | 121.19 | 293 | 284 | 59.4 |
| C | 9 | 187 | 4686130 | 110634.74 | 174 | 174 | 42.4 |
| C | 15 | 214 | 67700 | 1594.28 | 174 | 174 | 42.4 |
| C | 9 | 203 | 23558 | 552.09 | 174 | 174 | 42.4 |
| D | 12 | 227 | 1413567 | 20863.72 | 271 | 263 | 67.7 |
| D | 1 | 52 | 166957 | 2460.8 | 271 | 263 | 67.7 |
| D | 13 | 249 | 33099 | 484.74 | 271 | 263 | 67.7 |
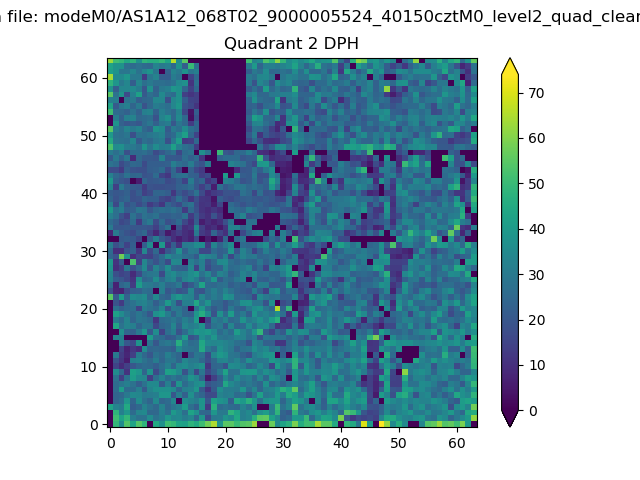
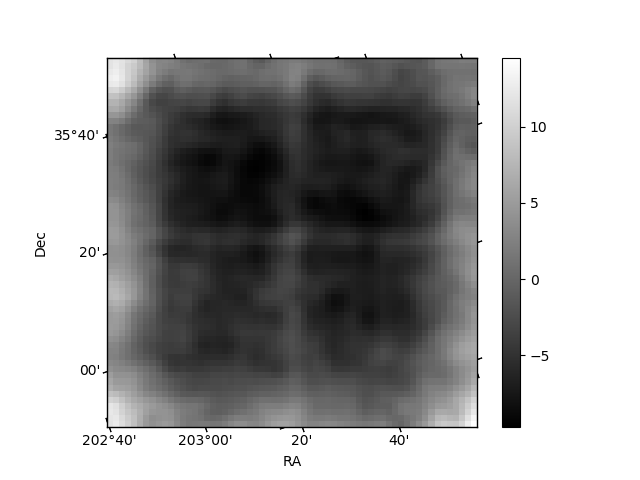
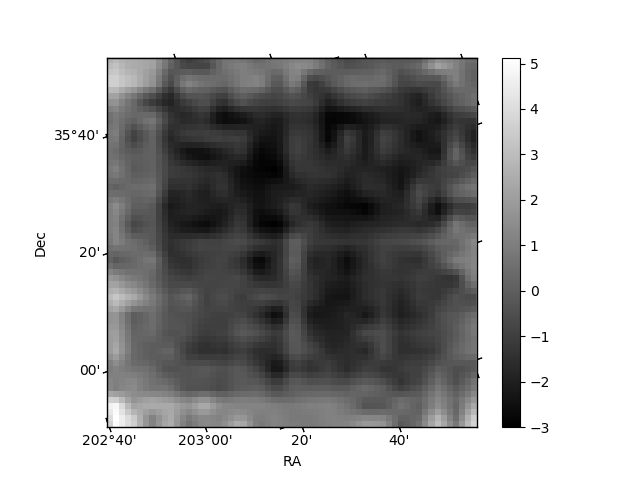
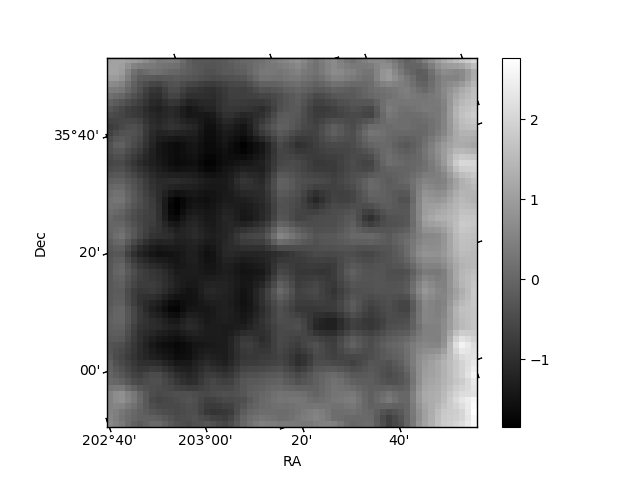
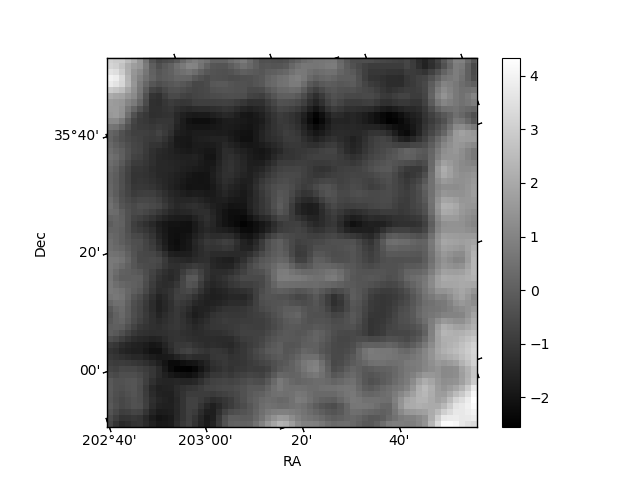
Histogram calculated using DETX and DETY for each event in the final _common_clean file
| Quadrant A | 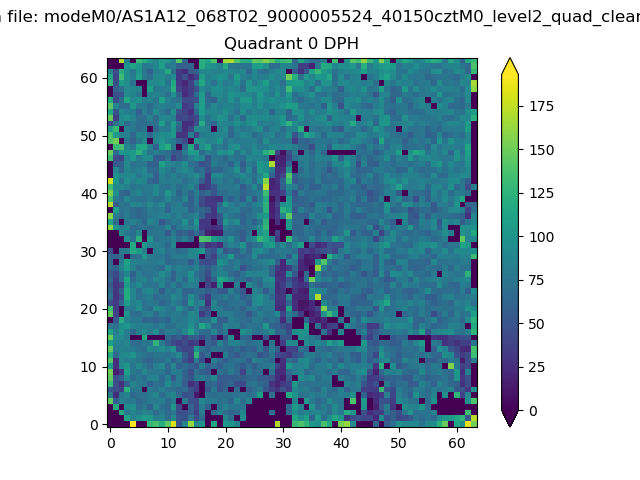 |
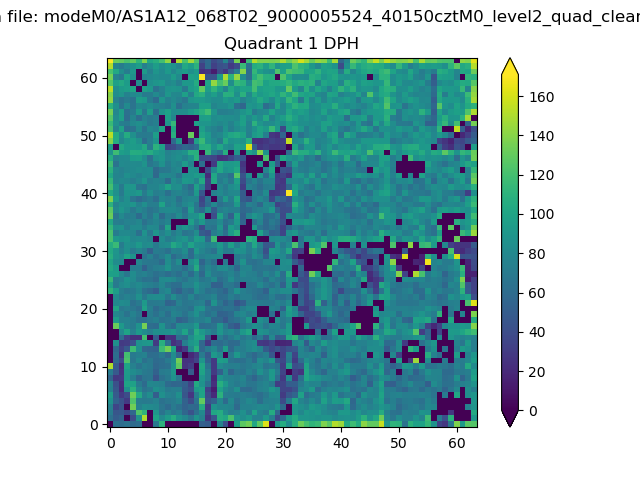 |
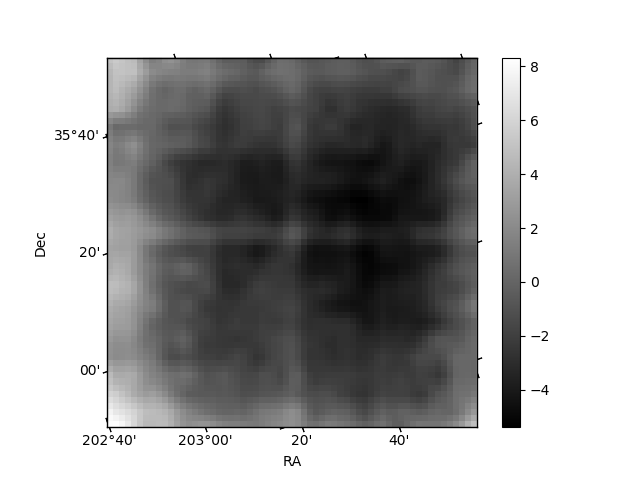
Quadrant B |
|---|---|---|---|
| Quadrant D | 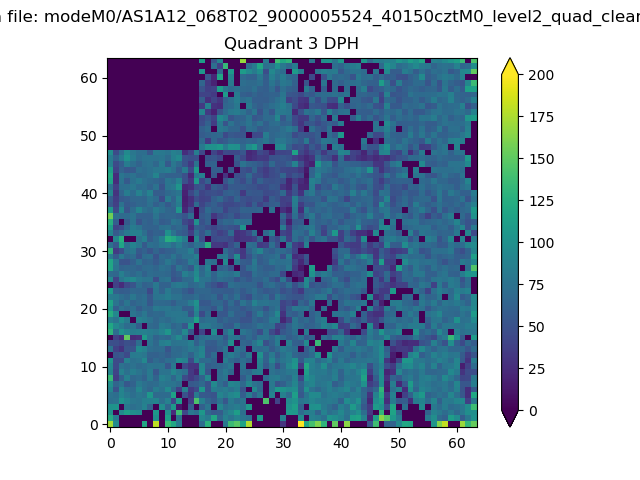 |
 |
Quadrant C |
| Plot type | Count rate plots | Images |
|---|---|---|
| Comparison with Poisson distribution Blue bars denote a histogram of data divided into 1 sec bins. Red curve is a Poisson curve with rate = median count rate of data. |
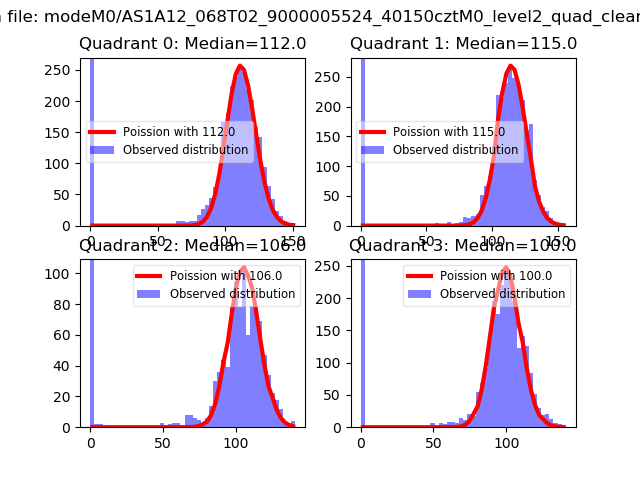 |
 |
| Quadrant-wise count rates Data is divided into 100 sec bins |
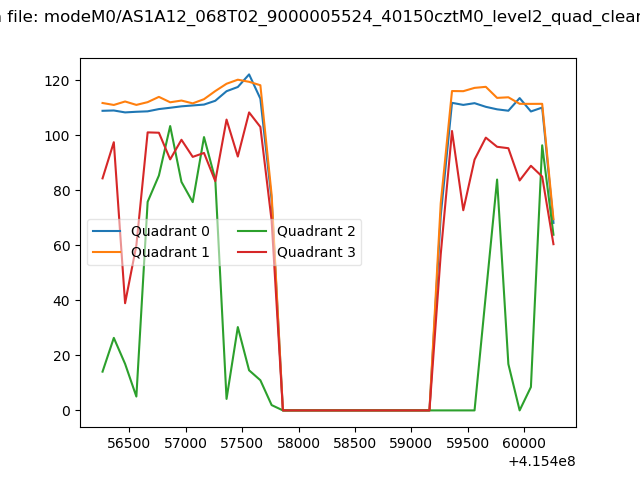 |
|
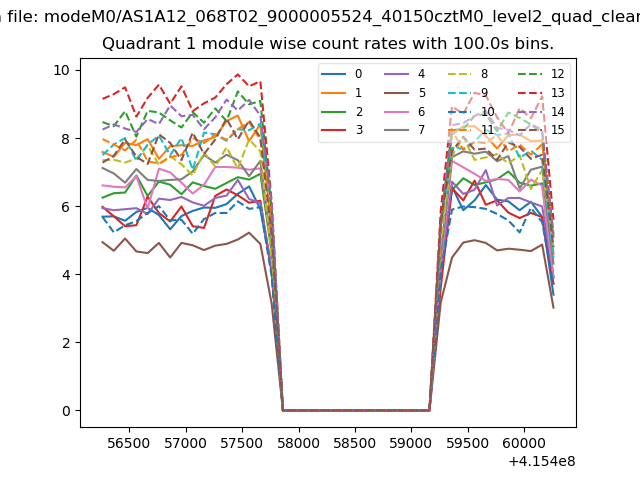
| Module-wise count rates for Quadrant A Data is divided into 100 sec bins |
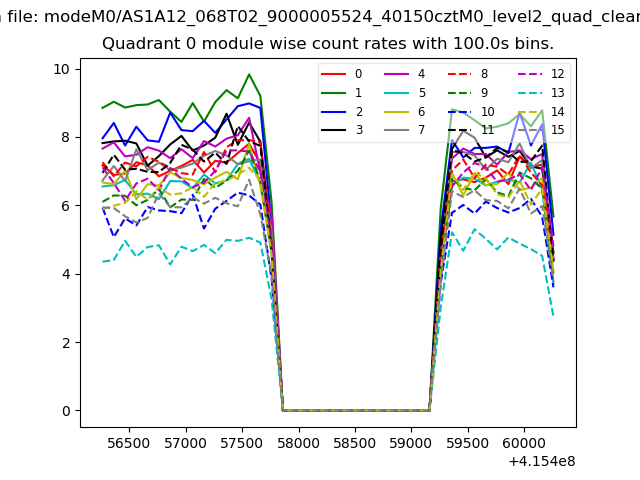 |
 |
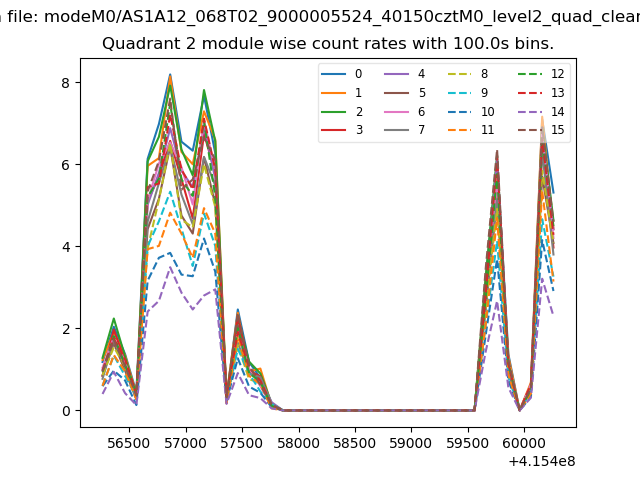
| Module-wise count rates for Quadrant B Data is divided into 100 sec bins |
 |
 |
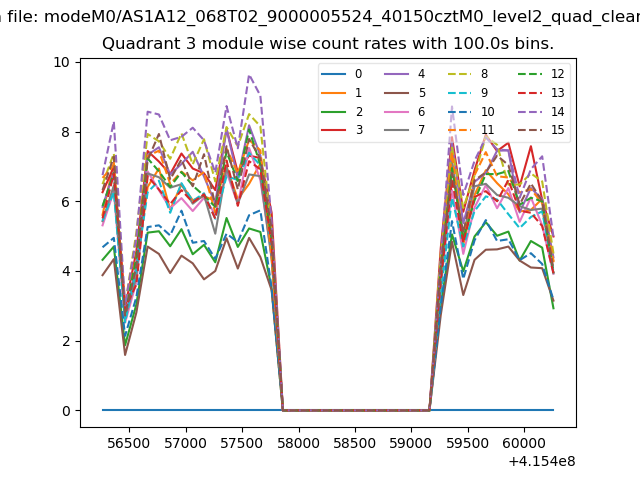
| Module-wise count rates for Quadrant C Data is divided into 100 sec bins |
 |
 |
| Module-wise count rates for Quadrant D Data is divided into 100 sec bins |
 |
 |
| Parameter | Plot |
|---|---|
| CZT HV Monitor | 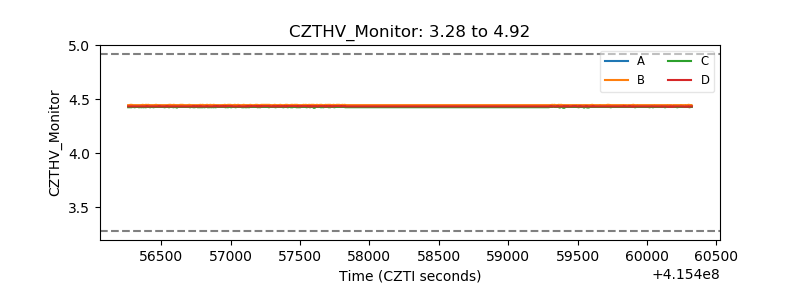 |
| D_VDD | 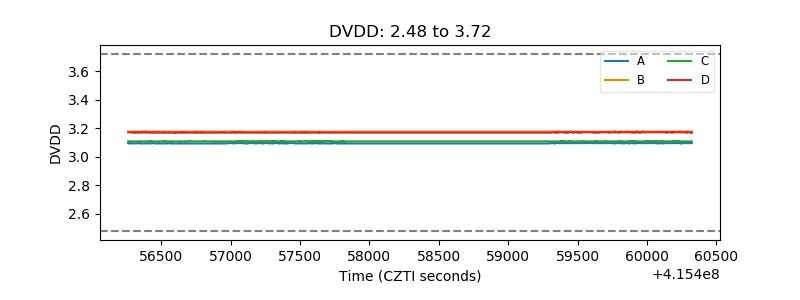 |
| Temperature 1 | 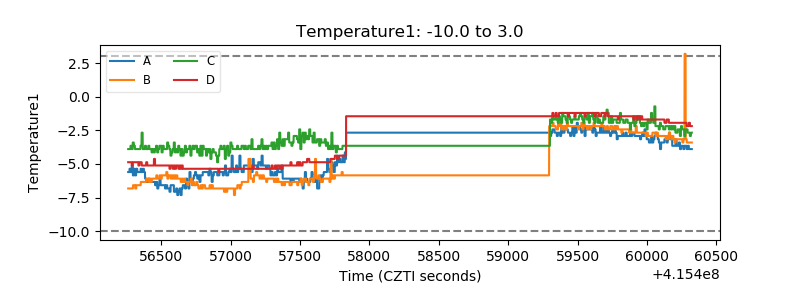 |
| Veto HV Monitor | 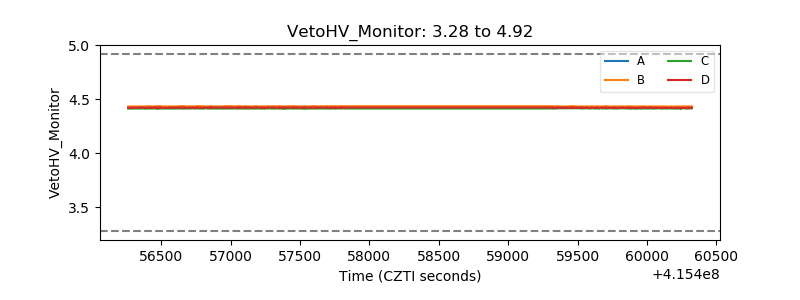 |
| Veto LLD | 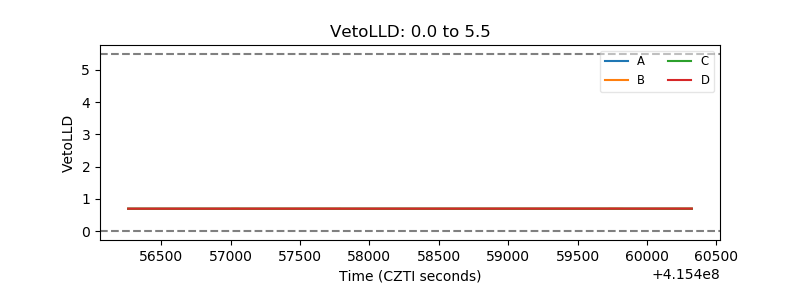 |
| Alpha Counter |  |
| _CPM_Rate | 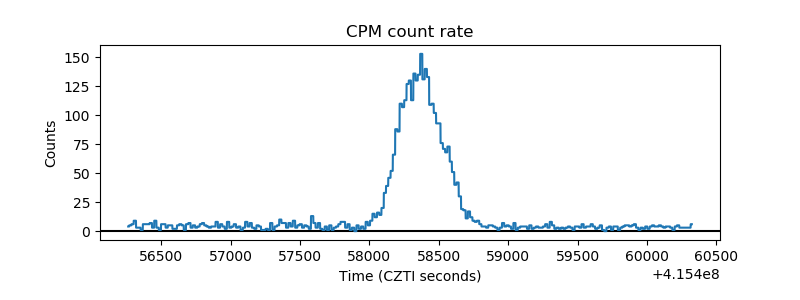 |
| CZT Counter | 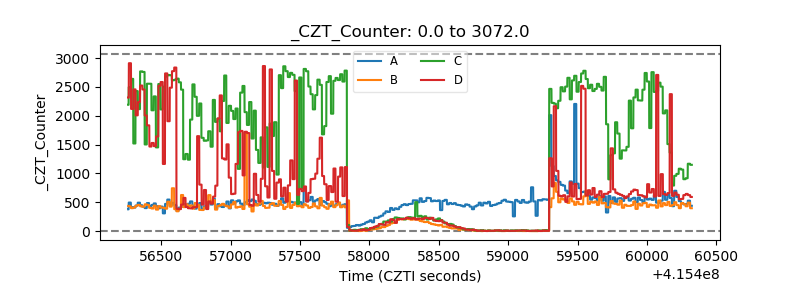 |
| +2.5 Volts monitor | 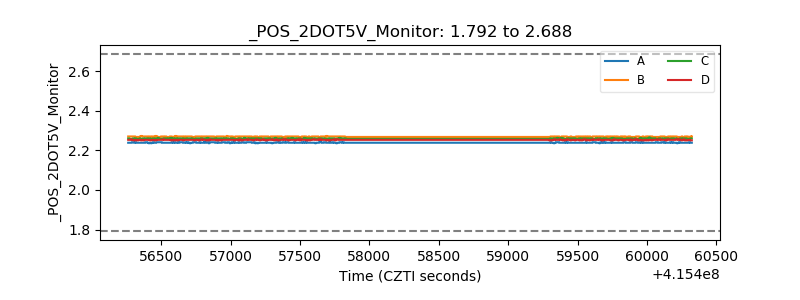 |
| +5 Volts monitor | 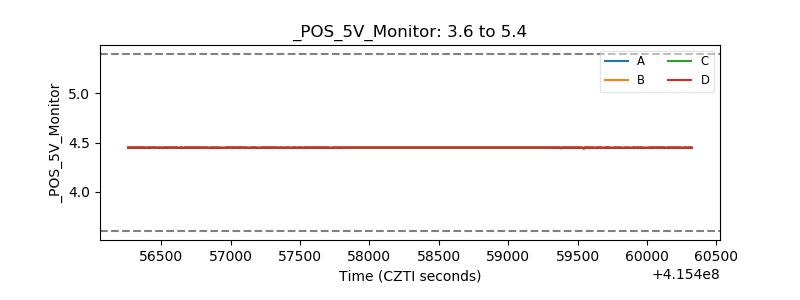 |
| _ROLL_ROT | 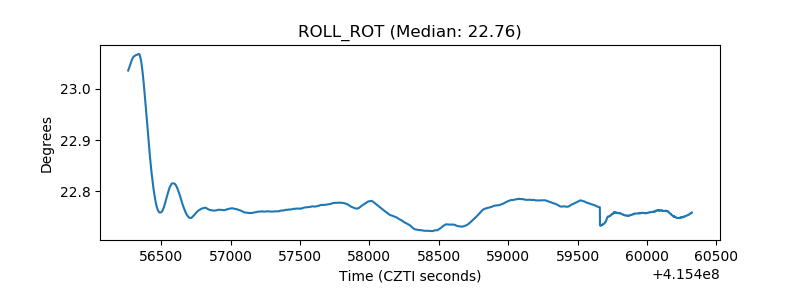 |
| _Roll_DEC | 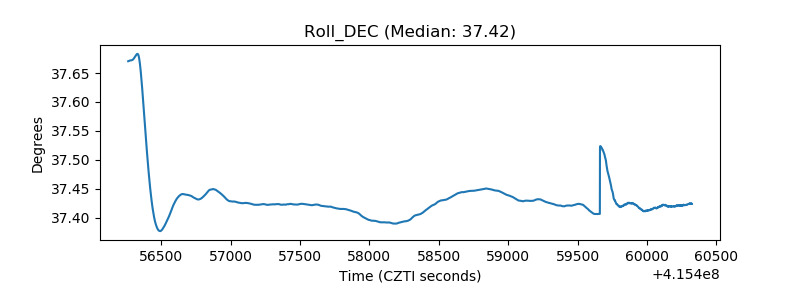 |
| _Roll_RA | 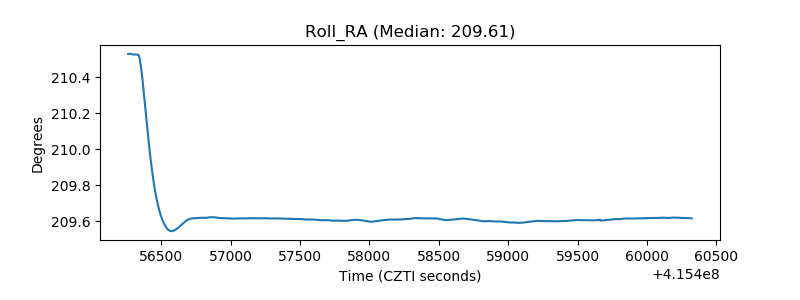 |
| Veto Counter | 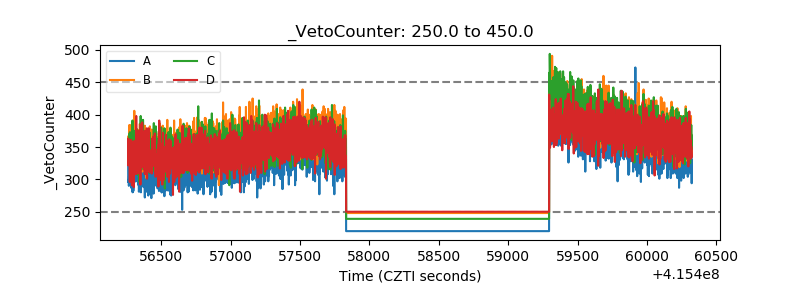 |