| Param | Original file | Final file |
|---|---|---|
| Filename | modeM0/AS1A12_068T02_9000005524_40151cztM0_level2.fits | modeM0/AS1A12_068T02_9000005524_40151cztM0_level2_quad_clean.evt |
| Size (bytes) | 630,233,280 | 74,488,320 |
| Size | 601.0 MB | 71.0 MB |
| Events in quadrant A | 2,969,245 | 611,224 |
| Events in quadrant B | 2,900,209 | 615,041 |
| Events in quadrant C | 13,130,124 | 114,695 |
| Events in quadrant D | 3,895,561 | 523,827 |
| Mode M9 | |||
|---|---|---|---|
| Quadrant | BADHDUFLAG | Total packets | Discarded packets |
| A | 0 | 26 | 0 |
| B | 0 | 26 | 0 |
| C | 0 | 26 | 0 |
| D | 0 | 27 | 0 |
| Mode SS | |||
|---|---|---|---|
| Quadrant | BADHDUFLAG | Total packets | Discarded packets |
| A | 0 | 114 | 0 |
| B | 0 | 114 | 0 |
| C | 0 | 114 | 0 |
| D | 0 | 114 | 0 |
| Mode M0 | |||
|---|---|---|---|
| Quadrant | BADHDUFLAG | Total packets | Discarded packets |
| A | 0 | 12462 | 3 |
| B | 0 | 12530 | 2 |
| C | 0 | 42799 | 2 |
| D | 0 | 15775 | 2 |
| Quadrant | Total seconds | Saturated seconds | Saturation percentage |
|---|---|---|---|
| A | 5580 | 29 | 0.519713% |
| B | 5580 | 139 | 2.491039% |
| C | 5580 | 4621 | 82.813620% |
| D | 5580 | 335 | 6.003584% |
Noise dominated data is calculated using 1-second bins in cleaned event files. If a bin has >2000 counts, and if more than 50% of those come from <1% of pixels, then it is considered to be noise-dominated and hence unusable.
| Quadrant | # 1 sec bins | Bins with >0 counts | Bins with >2000 counts | High rate bins dominated by noise | Noise dominated (total time) | Noise dominated (detector-on time) | Marked lightcurve |
|---|---|---|---|---|---|---|---|
| A | 7162 | 5581 | 9 | 9 | 0.13% | 0.16% | 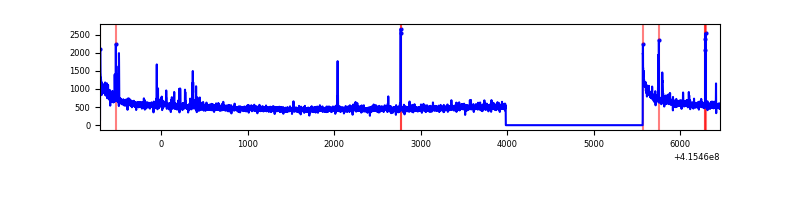 |
| B | 7161 | 5580 | 99 | 99 | 1.38% | 1.77% | 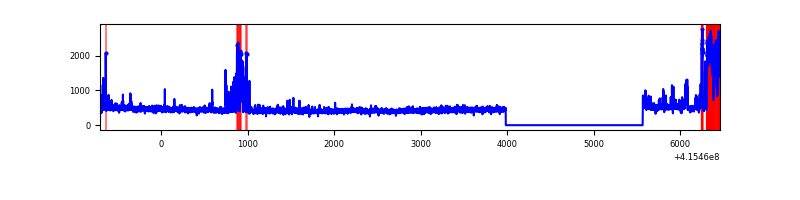 |
| C | 7161 | 5579 | 4676 | 4676 | 65.30% | 83.81% |  |
| D | 7162 | 5581 | 294 | 294 | 4.10% | 5.27% | 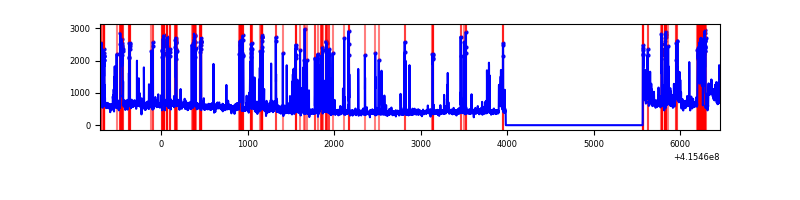 |
Top three noisy pixels from each quadrant. If the there are fewer than three noisy pixels in the level2.evt file, extra rows are filled as -1
| Pixel properties | Quadrant properties | ||||||
|---|---|---|---|---|---|---|---|
| Quadrant | DetID | PixID | Counts | Sigma | Mean | Median | Sigma |
| A | 10 | 83 | 489768 | 3917.77 | 614 | 602 | 124.9 |
| A | 13 | 248 | 72508 | 575.9 | 614 | 602 | 124.9 |
| A | 9 | 143 | 9029 | 67.49 | 614 | 602 | 124.9 |
| B | 5 | 172 | 277856 | 2339.47 | 609 | 593 | 118.5 |
| B | 4 | 171 | 169881 | 1428.41 | 609 | 593 | 118.5 |
| B | 0 | 190 | 34336 | 284.71 | 609 | 593 | 118.5 |
| C | 9 | 187 | 11713410 | 156166.95 | 316 | 318 | 75.0 |
| C | 15 | 214 | 126824 | 1686.66 | 316 | 318 | 75.0 |
| C | 0 | 10 | 19363 | 253.92 | 316 | 318 | 75.0 |
| D | 12 | 227 | 648984 | 4494.23 | 586 | 572 | 144.3 |
| D | 1 | 52 | 431908 | 2989.65 | 586 | 572 | 144.3 |
| D | 13 | 249 | 308508 | 2134.35 | 586 | 572 | 144.3 |
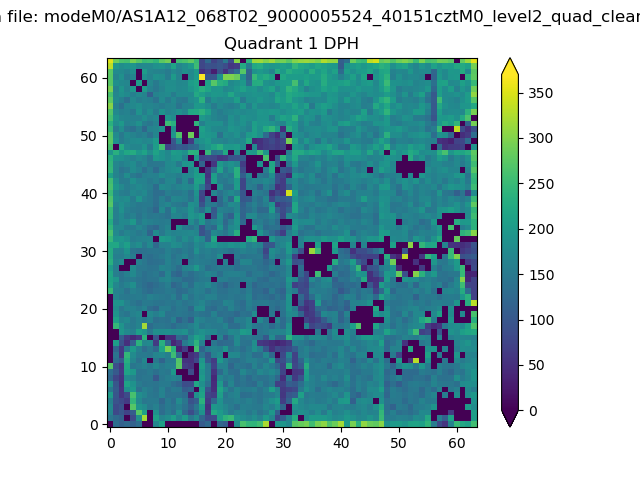
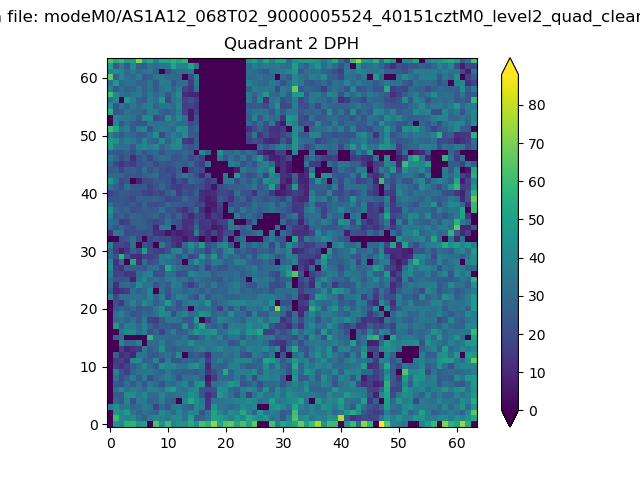
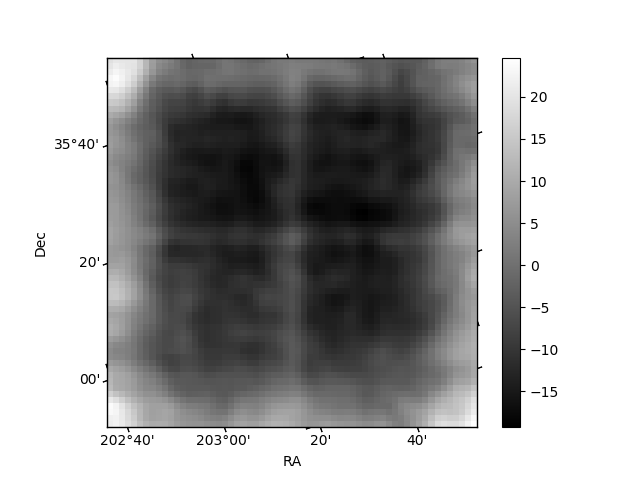
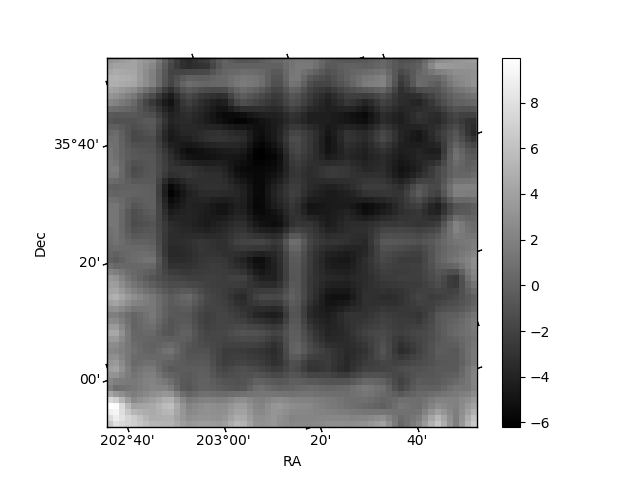
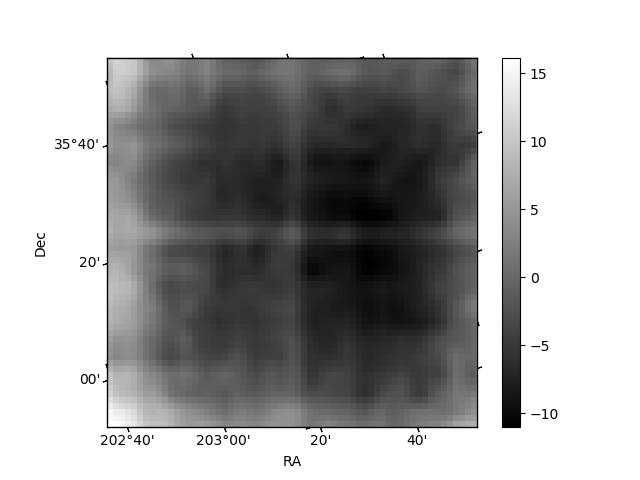
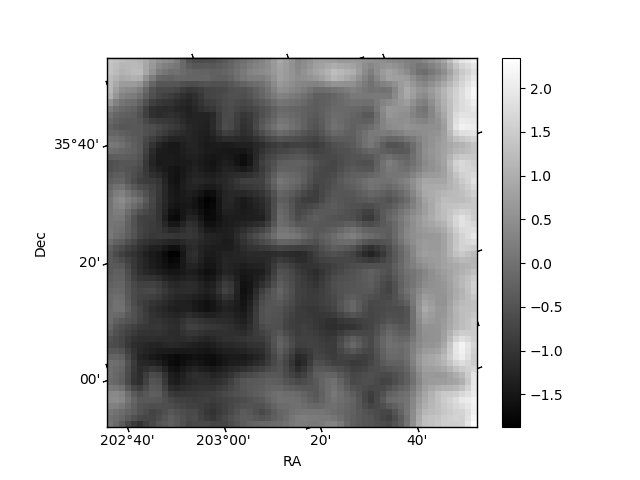
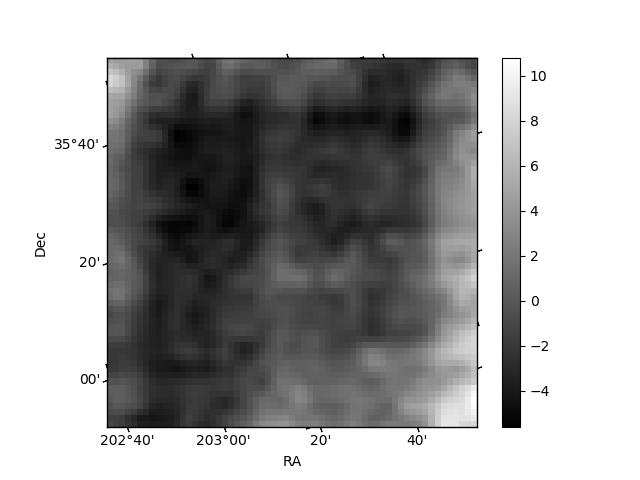
Histogram calculated using DETX and DETY for each event in the final _common_clean file
| Quadrant A | 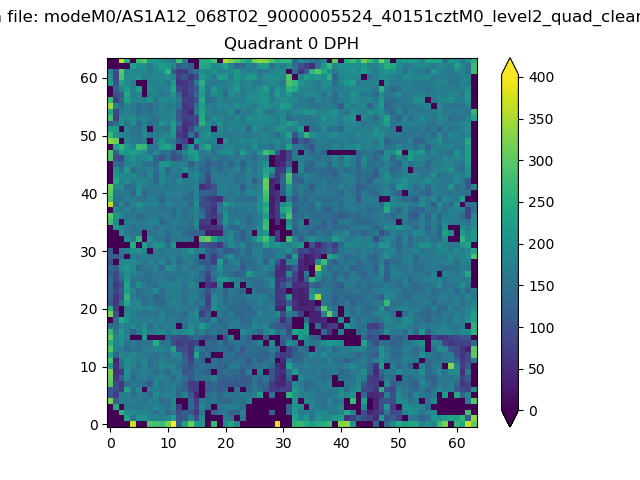 |
 |
Quadrant B |
|---|---|---|---|
| Quadrant D | 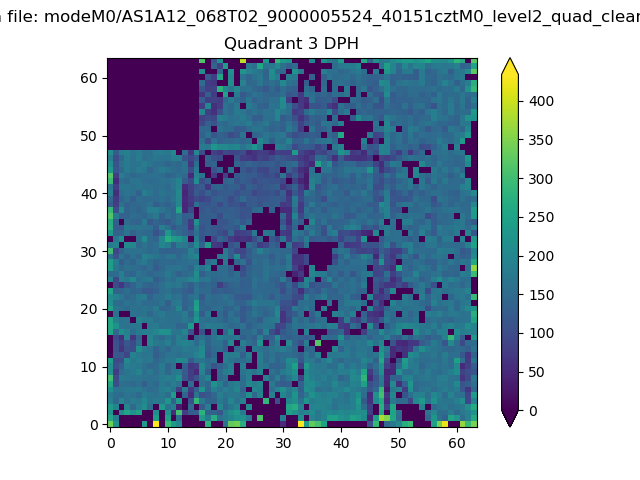 |
 |
Quadrant C |
| Plot type | Count rate plots | Images |
|---|---|---|
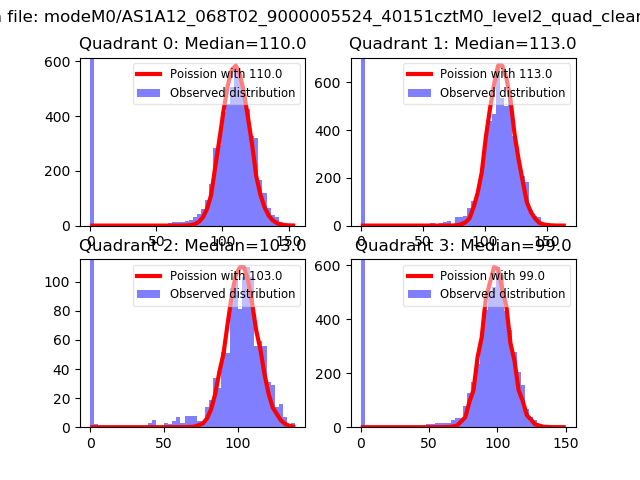
| Comparison with Poisson distribution Blue bars denote a histogram of data divided into 1 sec bins. Red curve is a Poisson curve with rate = median count rate of data. |
 |
 |
| Quadrant-wise count rates Data is divided into 100 sec bins |
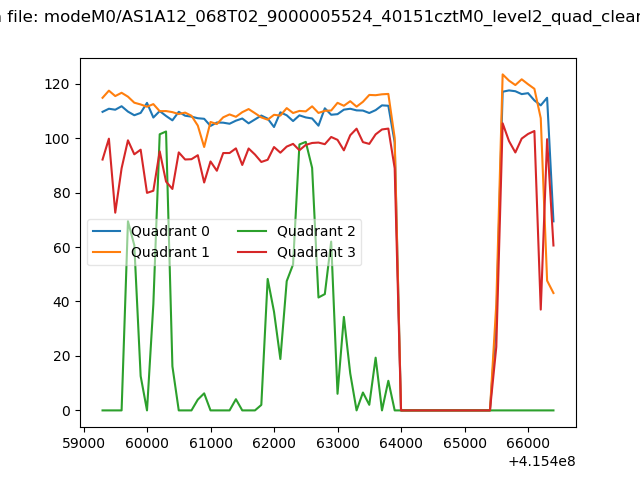 |
|
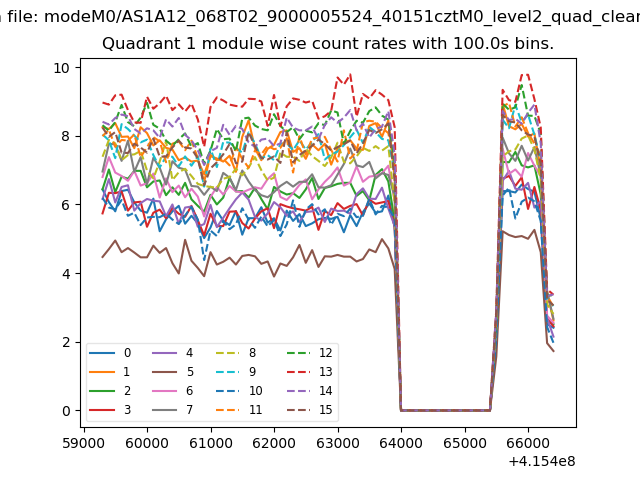
| Module-wise count rates for Quadrant A Data is divided into 100 sec bins |
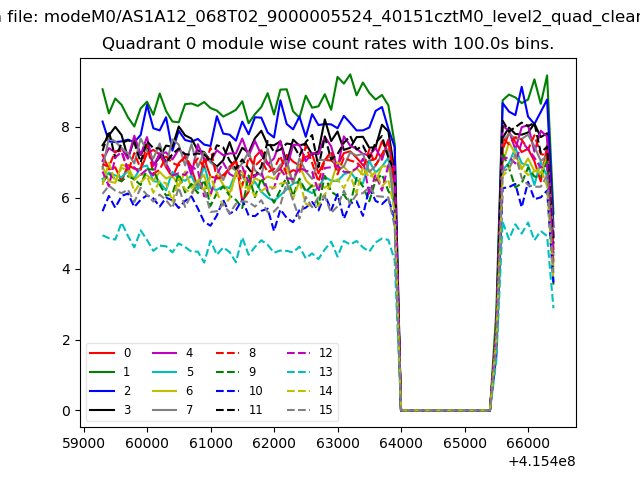 |
 |
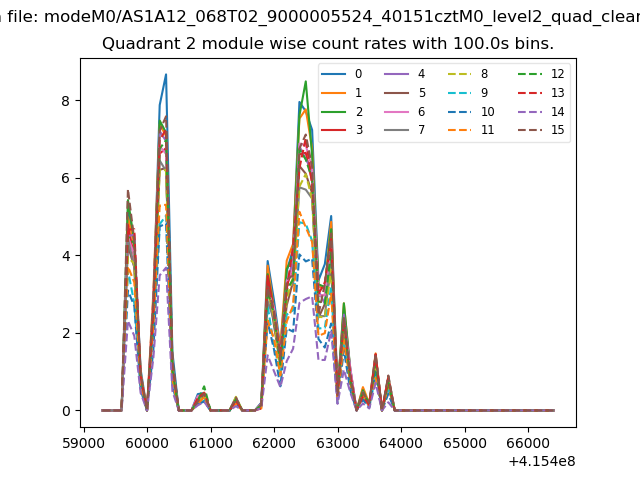
| Module-wise count rates for Quadrant B Data is divided into 100 sec bins |
 |
 |
| Module-wise count rates for Quadrant C Data is divided into 100 sec bins |
 |
 |
| Module-wise count rates for Quadrant D Data is divided into 100 sec bins |
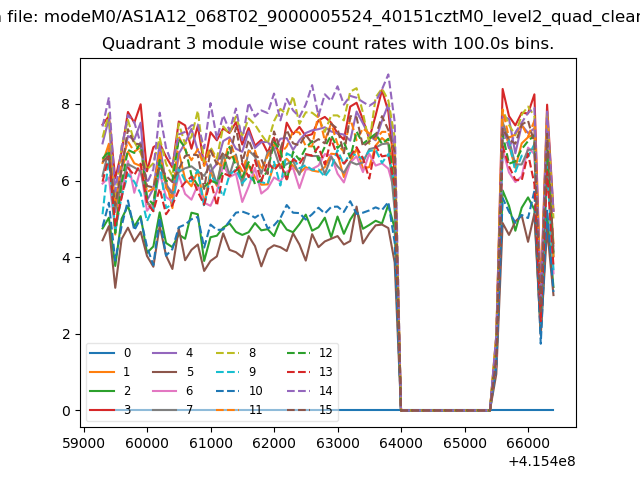 |
 |
| Parameter | Plot |
|---|---|
| CZT HV Monitor |  |
| D_VDD | 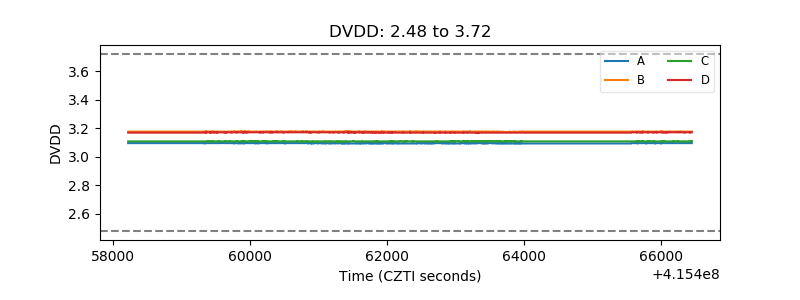 |
| Temperature 1 | 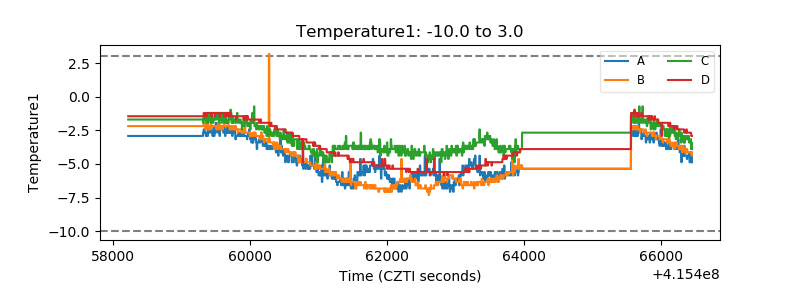 |
| Veto HV Monitor | 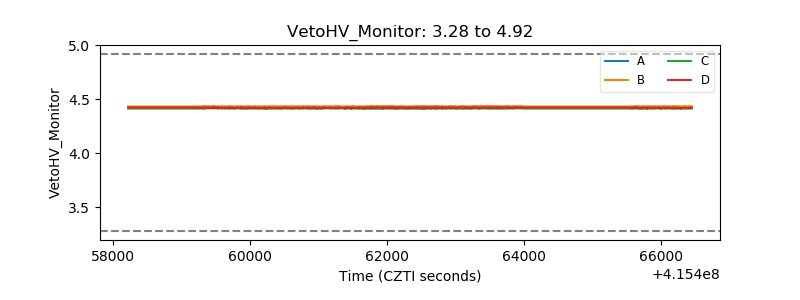 |
| Veto LLD | 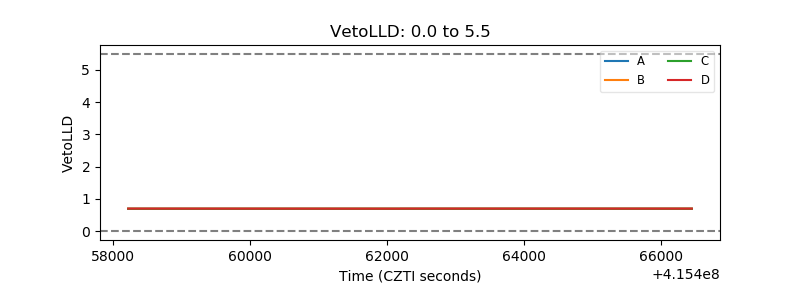 |
| Alpha Counter | 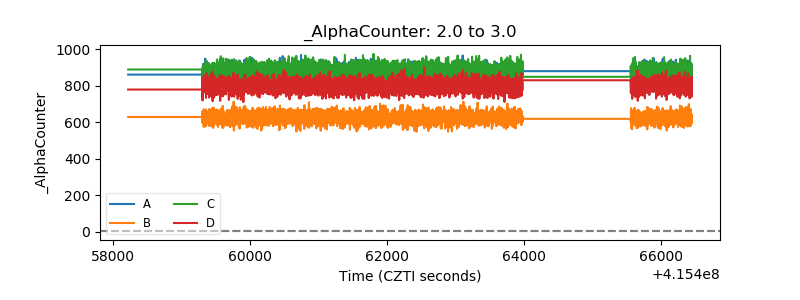 |
| _CPM_Rate | 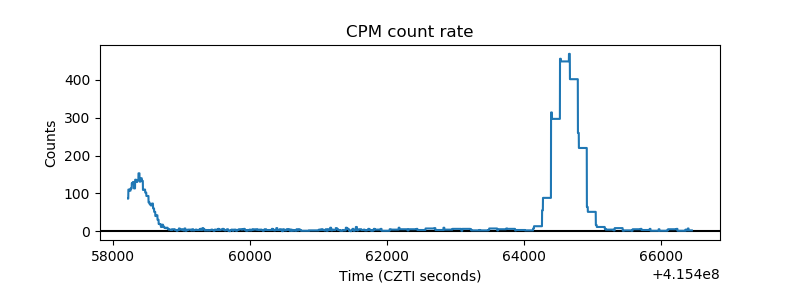 |
| CZT Counter | 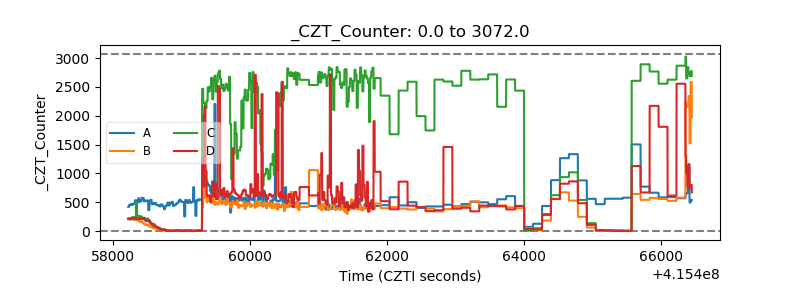 |
| +2.5 Volts monitor | 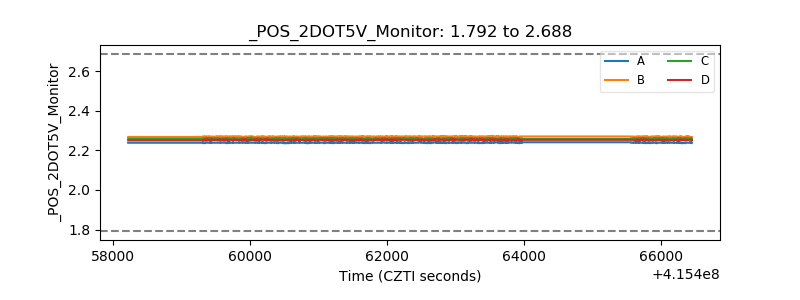 |
| +5 Volts monitor | 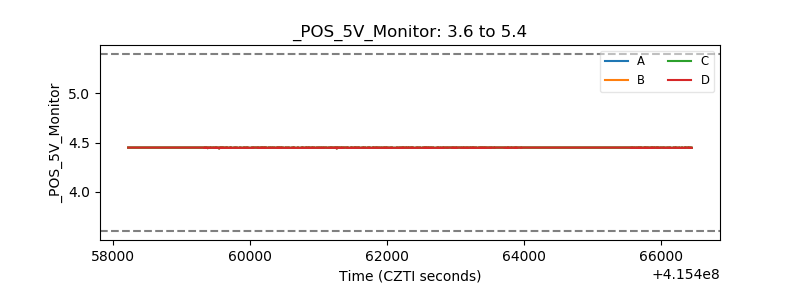 |
| _ROLL_ROT | 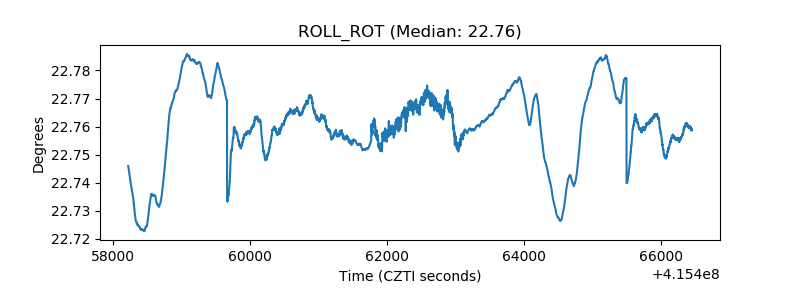 |
| _Roll_DEC | 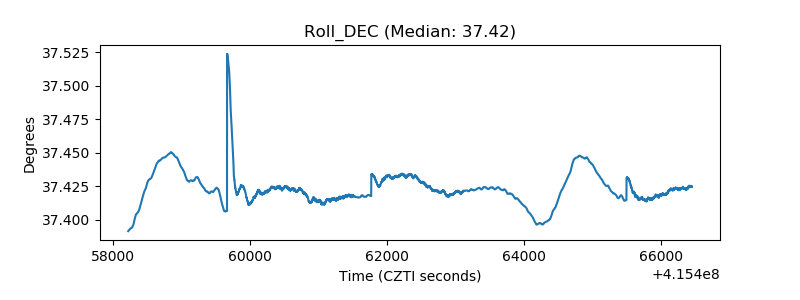 |
| _Roll_RA | 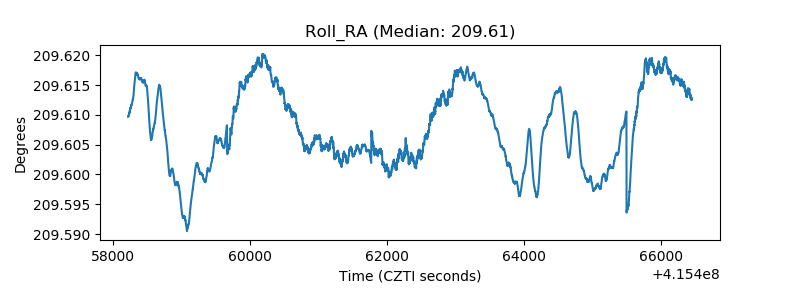 |
| Veto Counter | 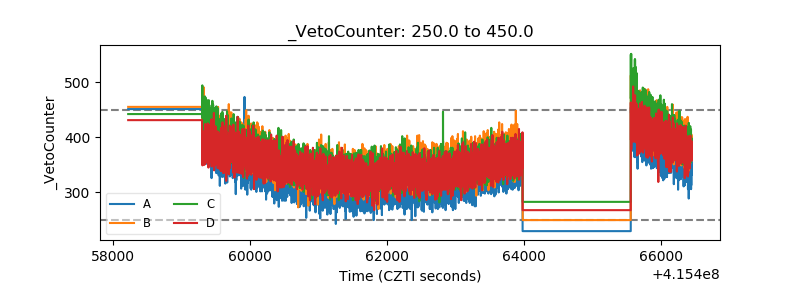 |