| Param | Original file | Final file |
|---|---|---|
| Filename | modeM0/AS1A12_068T02_9000005524_40153cztM0_level2.fits | modeM0/AS1A12_068T02_9000005524_40153cztM0_level2_quad_clean.evt |
| Size (bytes) | 632,338,560 | 68,497,920 |
| Size | 603.0 MB | 65.3 MB |
| Events in quadrant A | 2,786,011 | 591,554 |
| Events in quadrant B | 2,881,833 | 589,090 |
| Events in quadrant C | 13,594,767 | 18,171 |
| Events in quadrant D | 3,735,533 | 507,632 |
| Mode M9 | |||
|---|---|---|---|
| Quadrant | BADHDUFLAG | Total packets | Discarded packets |
| A | 0 | 18 | 0 |
| B | 0 | 18 | 0 |
| C | 0 | 18 | 0 |
| D | 0 | 18 | 0 |
| Mode SS | |||
|---|---|---|---|
| Quadrant | BADHDUFLAG | Total packets | Discarded packets |
| A | 0 | 106 | 0 |
| B | 0 | 106 | 0 |
| C | 0 | 106 | 0 |
| D | 0 | 106 | 0 |
| Mode M0 | |||
|---|---|---|---|
| Quadrant | BADHDUFLAG | Total packets | Discarded packets |
| A | 0 | 11730 | 2 |
| B | 0 | 12221 | 1 |
| C | 0 | 44060 | 1 |
| D | 0 | 15020 | 1 |
| Quadrant | Total seconds | Saturated seconds | Saturation percentage |
|---|---|---|---|
| A | 5251 | 25 | 0.476100% |
| B | 5251 | 181 | 3.446962% |
| C | 5251 | 5126 | 97.619501% |
| D | 5251 | 324 | 6.170253% |
Noise dominated data is calculated using 1-second bins in cleaned event files. If a bin has >2000 counts, and if more than 50% of those come from <1% of pixels, then it is considered to be noise-dominated and hence unusable.
| Quadrant | # 1 sec bins | Bins with >0 counts | Bins with >2000 counts | High rate bins dominated by noise | Noise dominated (total time) | Noise dominated (detector-on time) | Marked lightcurve |
|---|---|---|---|---|---|---|---|
| A | 6984 | 5252 | 13 | 13 | 0.19% | 0.25% | 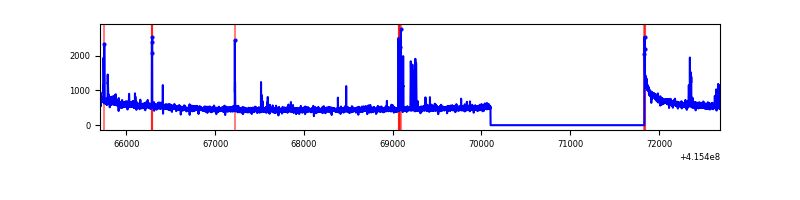 |
| B | 6984 | 5252 | 138 | 138 | 1.98% | 2.63% | 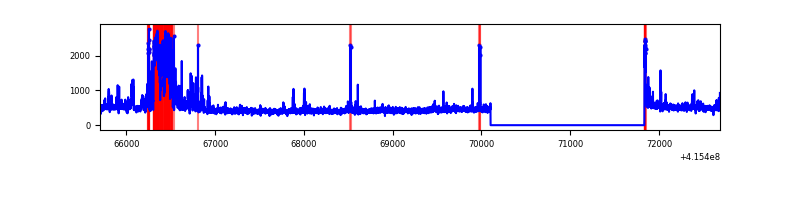 |
| C | 6983 | 5251 | 5086 | 5086 | 72.83% | 96.86% | 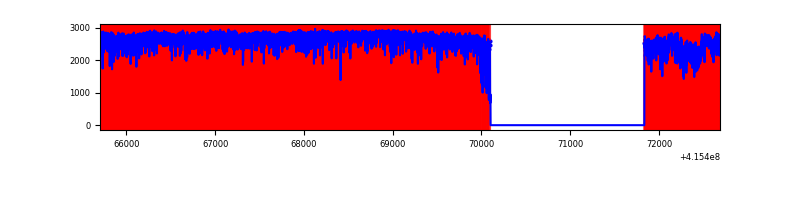 |
| D | 6984 | 5252 | 309 | 309 | 4.42% | 5.88% | 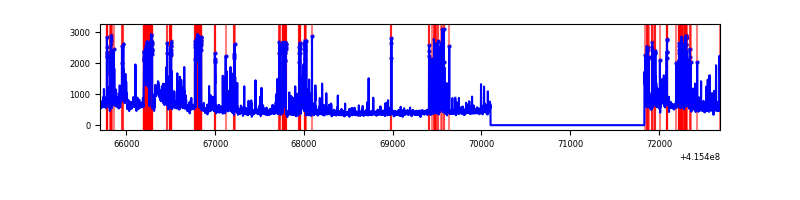 |
Top three noisy pixels from each quadrant. If the there are fewer than three noisy pixels in the level2.evt file, extra rows are filled as -1
| Pixel properties | Quadrant properties | ||||||
|---|---|---|---|---|---|---|---|
| Quadrant | DetID | PixID | Counts | Sigma | Mean | Median | Sigma |
| A | 10 | 83 | 410272 | 3443.79 | 580 | 569 | 119.0 |
| A | 9 | 143 | 52917 | 440.02 | 580 | 569 | 119.0 |
| A | 13 | 248 | 44370 | 368.17 | 580 | 569 | 119.0 |
| B | 5 | 172 | 449764 | 4016.69 | 572 | 555 | 111.8 |
| B | 4 | 171 | 80373 | 713.71 | 572 | 555 | 111.8 |
| B | 0 | 190 | 53638 | 474.65 | 572 | 555 | 111.8 |
| C | 9 | 187 | 12552991 | 245194.23 | 216 | 217 | 51.2 |
| C | 15 | 214 | 88618 | 1726.74 | 216 | 217 | 51.2 |
| C | 14 | 254 | 84176 | 1639.98 | 216 | 217 | 51.2 |
| D | 12 | 227 | 619823 | 4572.89 | 551 | 535 | 135.4 |
| D | 13 | 249 | 482408 | 3558.2 | 551 | 535 | 135.4 |
| D | 1 | 52 | 264359 | 1948.1 | 551 | 535 | 135.4 |
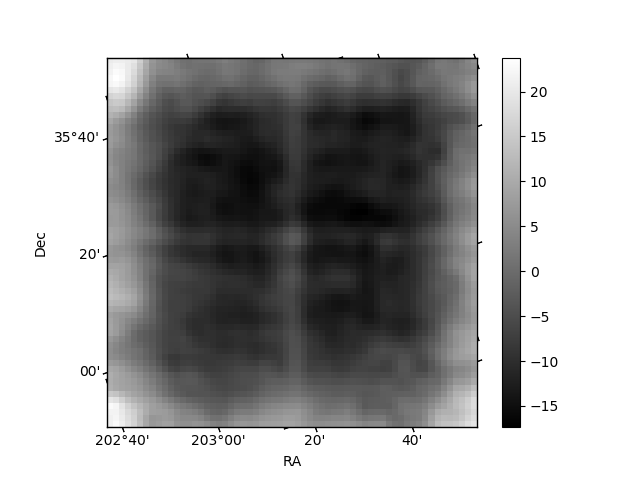
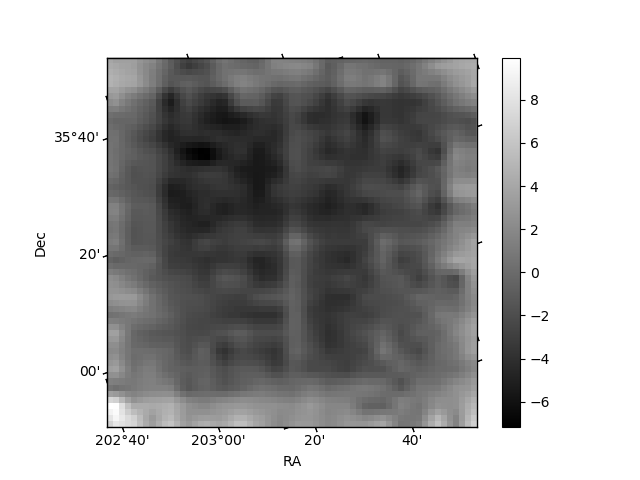
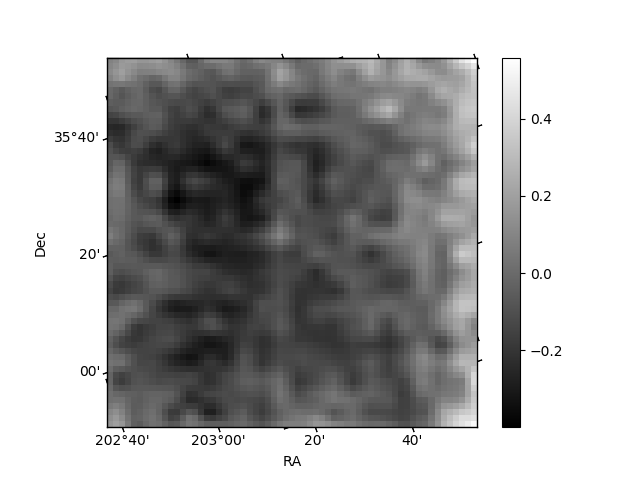
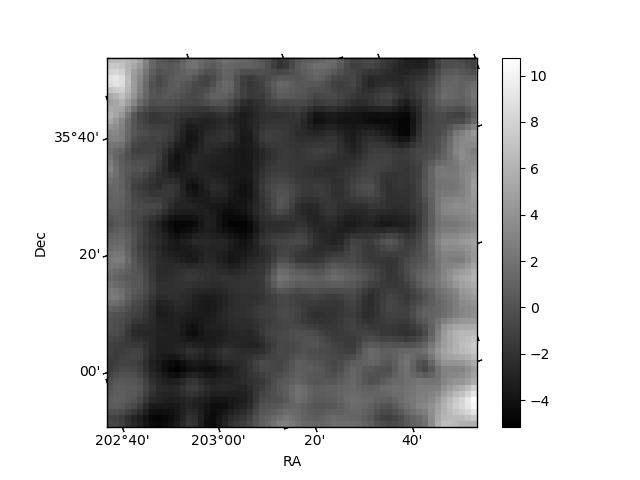
Histogram calculated using DETX and DETY for each event in the final _common_clean file
| Quadrant A | 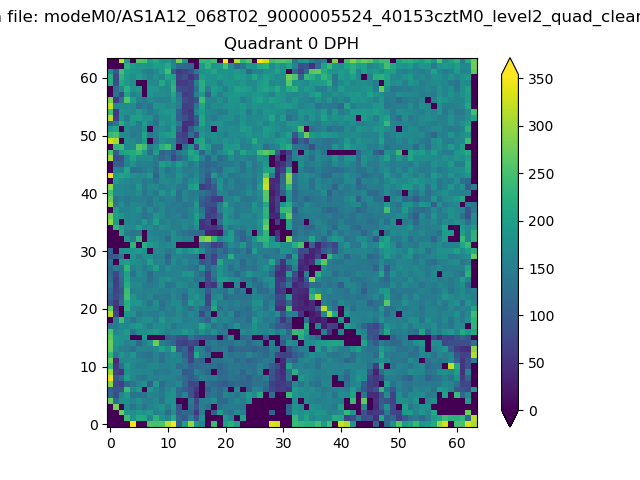 |
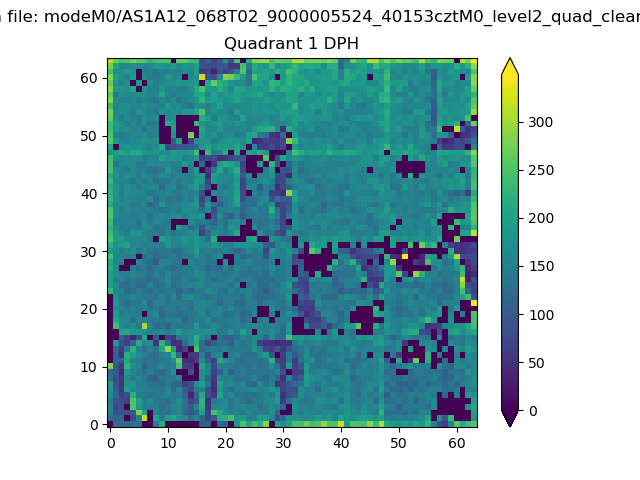 |
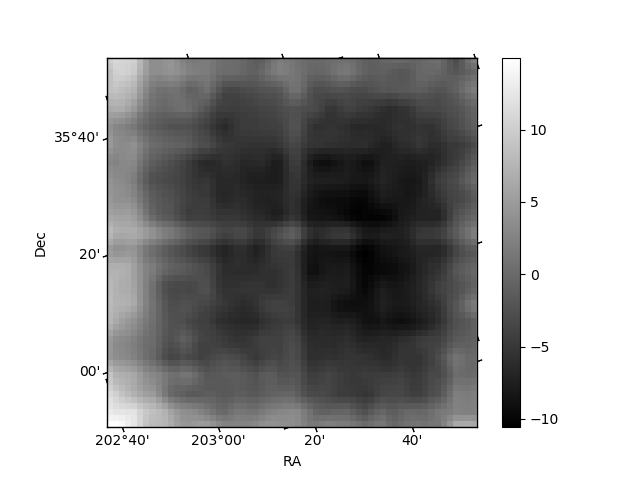
Quadrant B |
|---|---|---|---|
| Quadrant D | 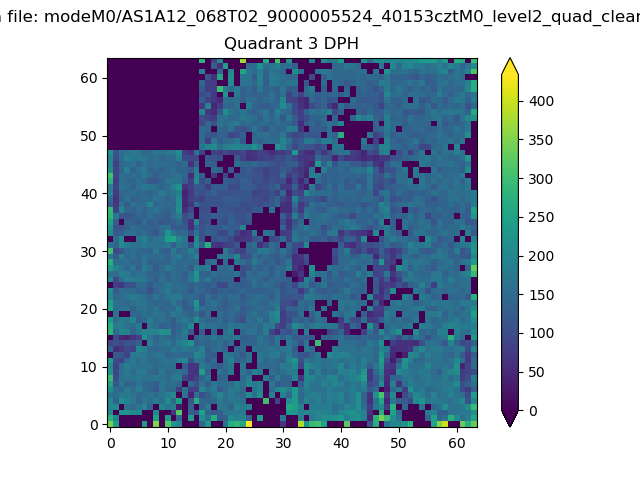 |
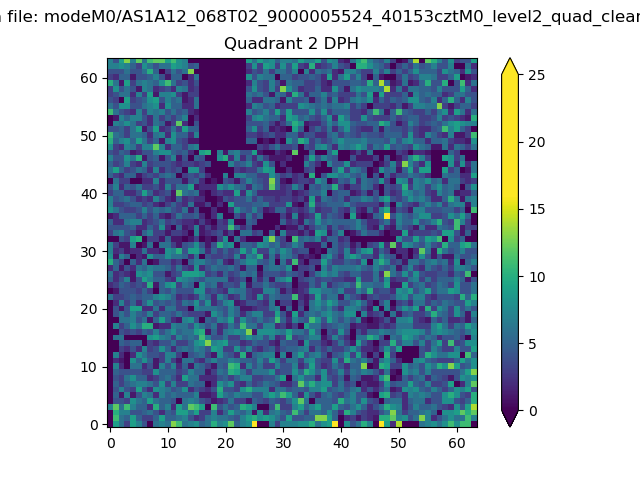 |
Quadrant C |
| Plot type | Count rate plots | Images |
|---|---|---|
| Comparison with Poisson distribution Blue bars denote a histogram of data divided into 1 sec bins. Red curve is a Poisson curve with rate = median count rate of data. |
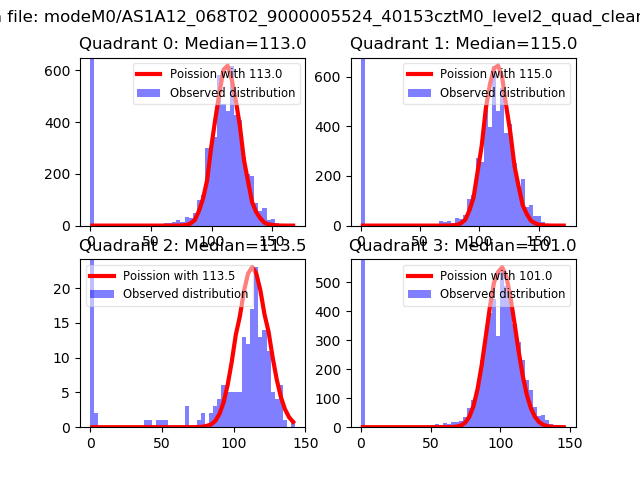 |
 |
| Quadrant-wise count rates Data is divided into 100 sec bins |
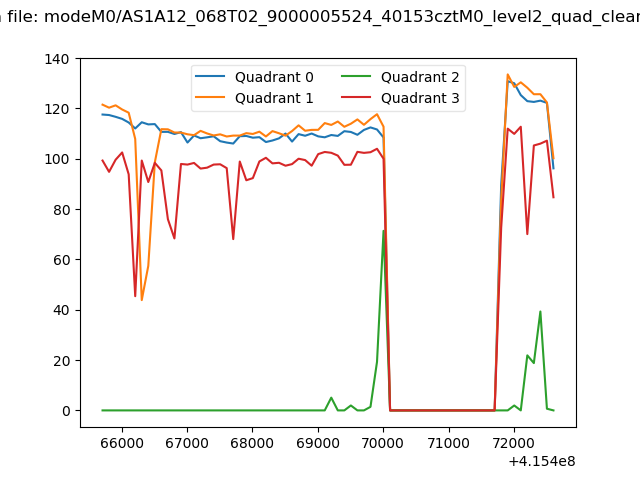 |
|
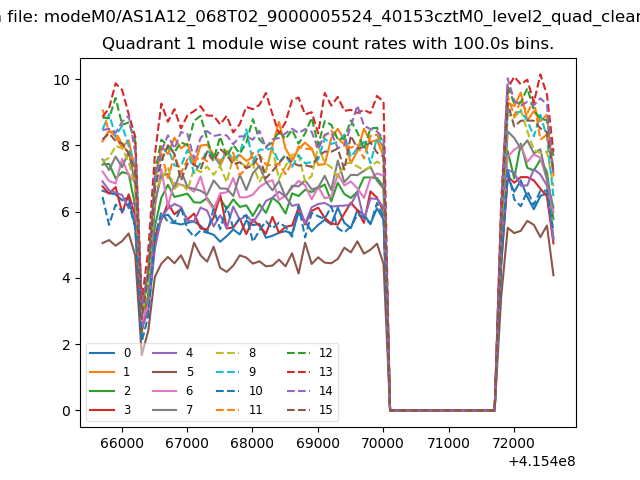
| Module-wise count rates for Quadrant A Data is divided into 100 sec bins |
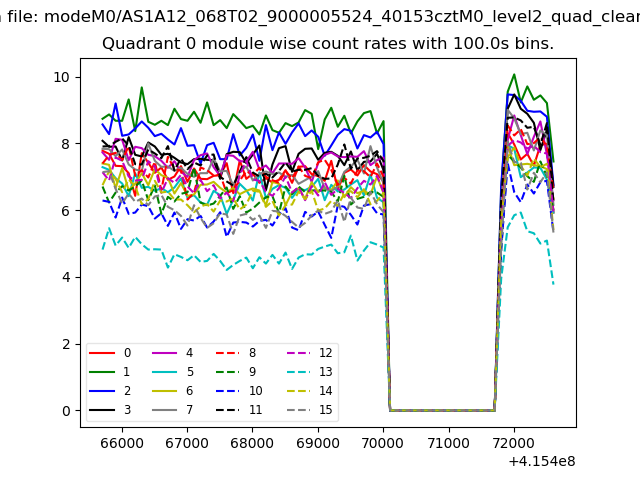 |
 |
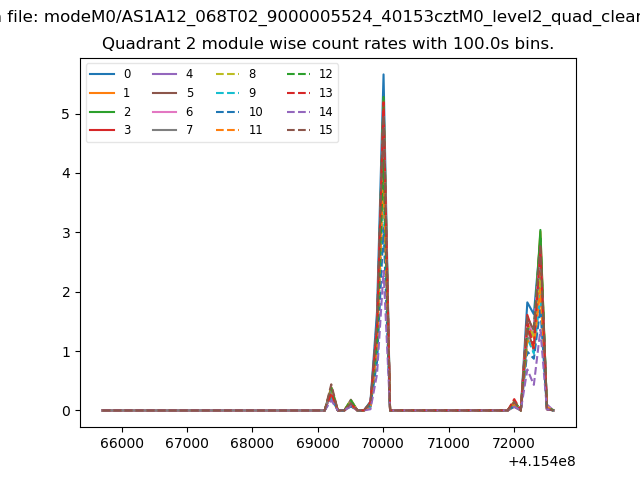
| Module-wise count rates for Quadrant B Data is divided into 100 sec bins |
 |
 |
| Module-wise count rates for Quadrant C Data is divided into 100 sec bins |
 |
 |
| Module-wise count rates for Quadrant D Data is divided into 100 sec bins |
 |
 |
| Parameter | Plot |
|---|---|
| CZT HV Monitor | 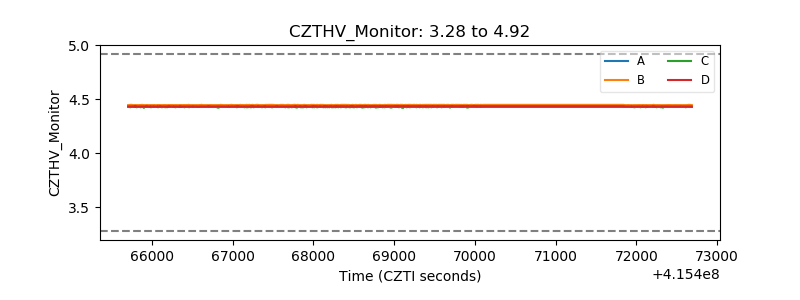 |
| D_VDD | 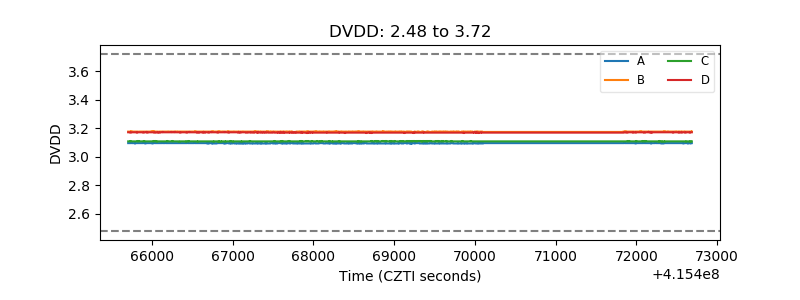 |
| Temperature 1 | 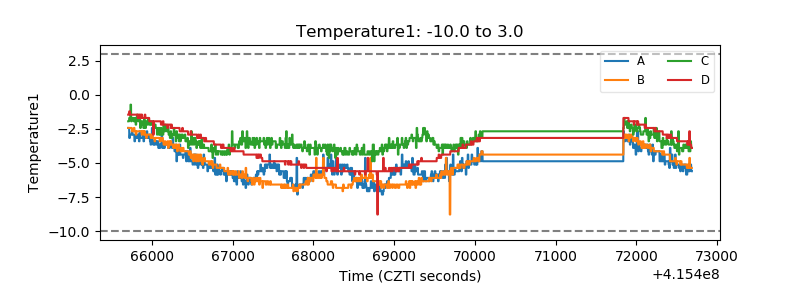 |
| Veto HV Monitor | 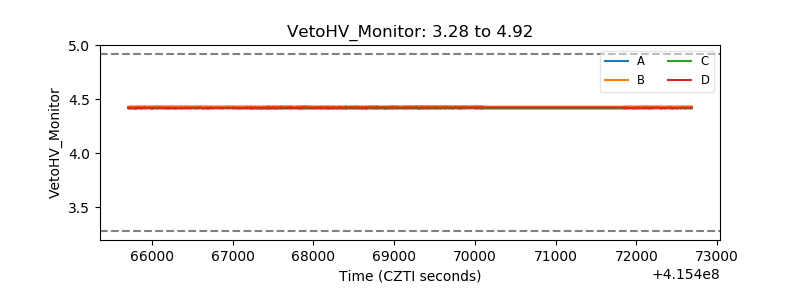 |
| Veto LLD | 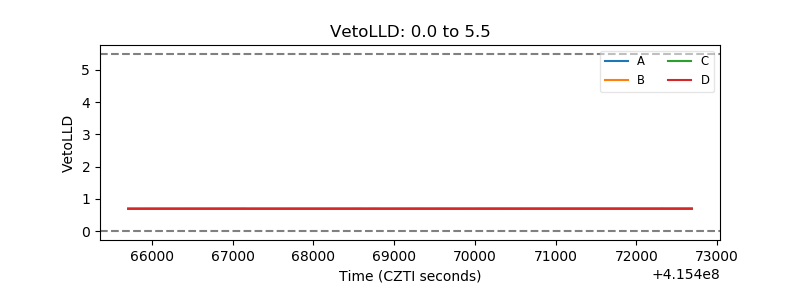 |
| Alpha Counter | 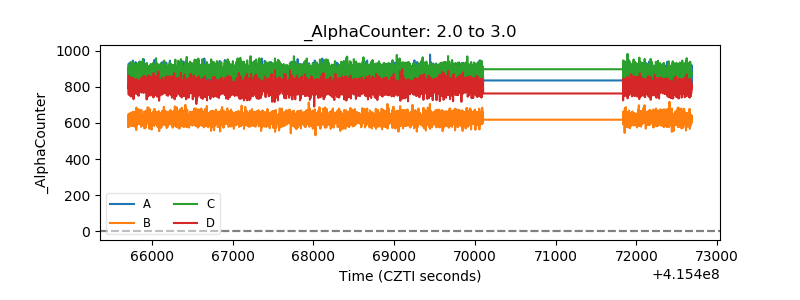 |
| _CPM_Rate | 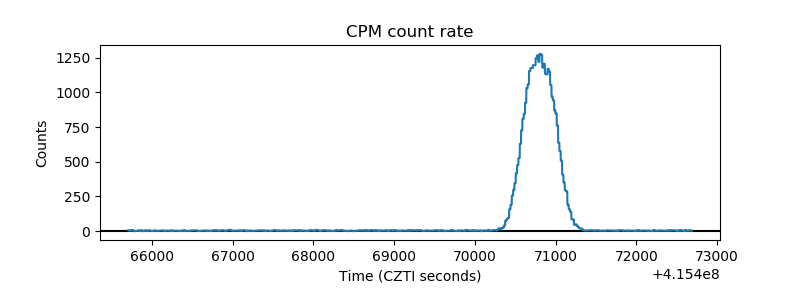 |
| CZT Counter | 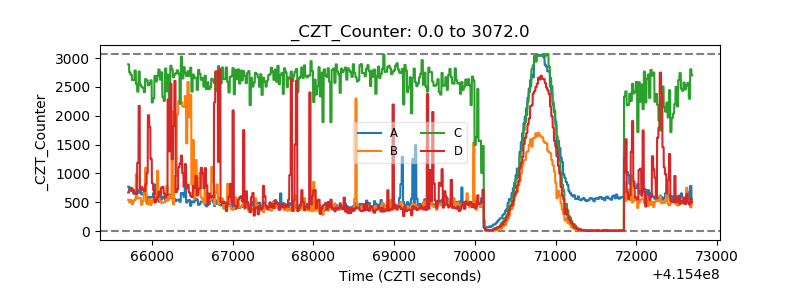 |
| +2.5 Volts monitor |  |
| +5 Volts monitor | 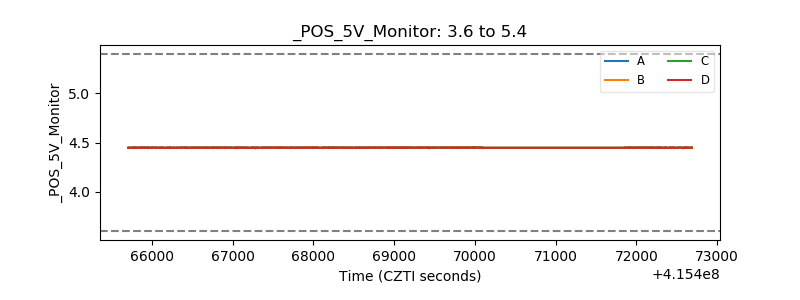 |
| _ROLL_ROT | 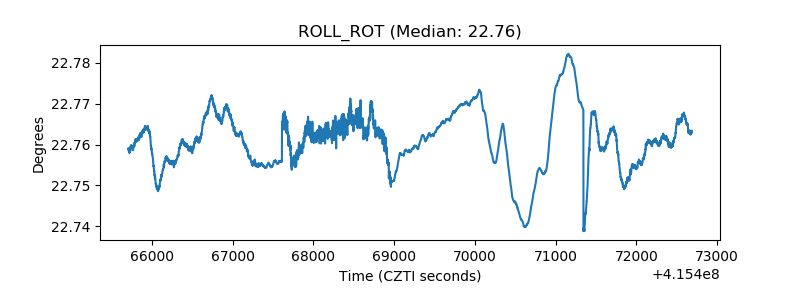 |
| _Roll_DEC | 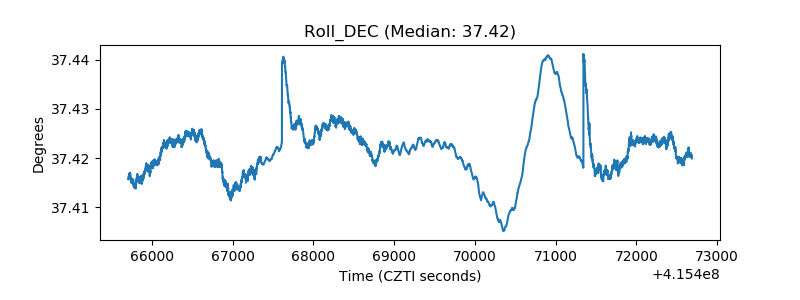 |
| _Roll_RA | 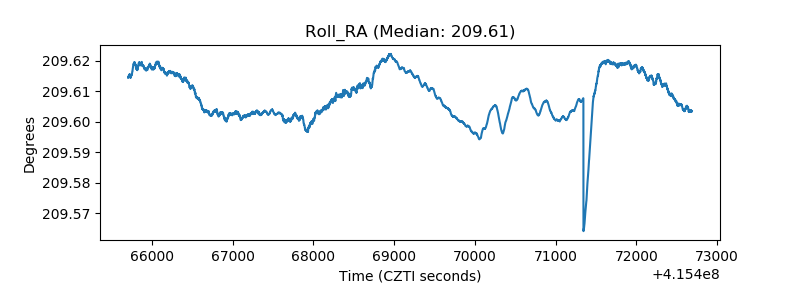 |
| Veto Counter | 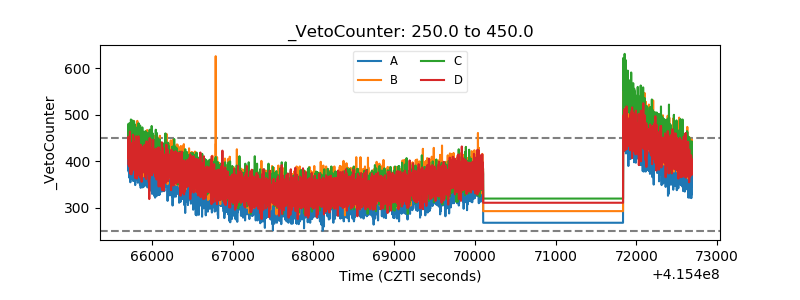 |