| Param | Original file | Final file |
|---|---|---|
| Filename | modeM0/AS1A12_068T02_9000005524_40154cztM0_level2.fits | modeM0/AS1A12_068T02_9000005524_40154cztM0_level2_quad_clean.evt |
| Size (bytes) | 625,668,480 | 72,794,880 |
| Size | 596.7 MB | 69.4 MB |
| Events in quadrant A | 3,234,516 | 593,098 |
| Events in quadrant B | 2,681,535 | 631,961 |
| Events in quadrant C | 13,166,267 | 58,667 |
| Events in quadrant D | 3,665,490 | 549,464 |
| Mode M9 | |||
|---|---|---|---|
| Quadrant | BADHDUFLAG | Total packets | Discarded packets |
| A | 0 | 31 | 0 |
| B | 0 | 31 | 0 |
| C | 0 | 31 | 0 |
| D | 0 | 32 | 0 |
| Mode SS | |||
|---|---|---|---|
| Quadrant | BADHDUFLAG | Total packets | Discarded packets |
| A | 0 | 108 | 0 |
| B | 0 | 108 | 0 |
| C | 0 | 108 | 0 |
| D | 0 | 108 | 0 |
| Mode M0 | |||
|---|---|---|---|
| Quadrant | BADHDUFLAG | Total packets | Discarded packets |
| A | 0 | 13044 | 3 |
| B | 0 | 11564 | 2 |
| C | 0 | 42770 | 2 |
| D | 0 | 14644 | 2 |
| Quadrant | Total seconds | Saturated seconds | Saturation percentage |
|---|---|---|---|
| A | 5298 | 242 | 4.567761% |
| B | 5298 | 82 | 1.547754% |
| C | 5298 | 4909 | 92.657607% |
| D | 5298 | 221 | 4.171385% |
Noise dominated data is calculated using 1-second bins in cleaned event files. If a bin has >2000 counts, and if more than 50% of those come from <1% of pixels, then it is considered to be noise-dominated and hence unusable.
| Quadrant | # 1 sec bins | Bins with >0 counts | Bins with >2000 counts | High rate bins dominated by noise | Noise dominated (total time) | Noise dominated (detector-on time) | Marked lightcurve |
|---|---|---|---|---|---|---|---|
| A | 7151 | 5299 | 206 | 206 | 2.88% | 3.89% | 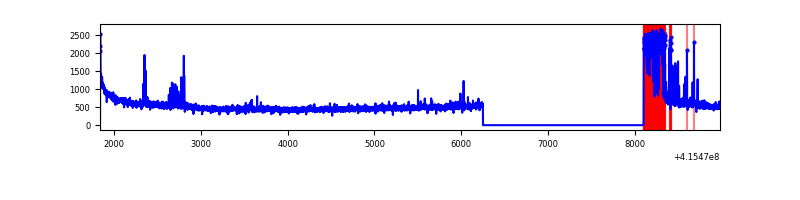 |
| B | 7151 | 5299 | 50 | 50 | 0.70% | 0.94% | 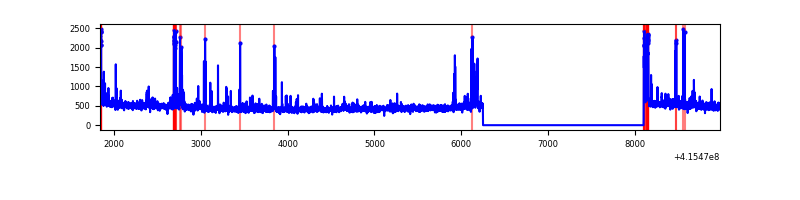 |
| C | 7150 | 5297 | 4944 | 4944 | 69.15% | 93.34% | 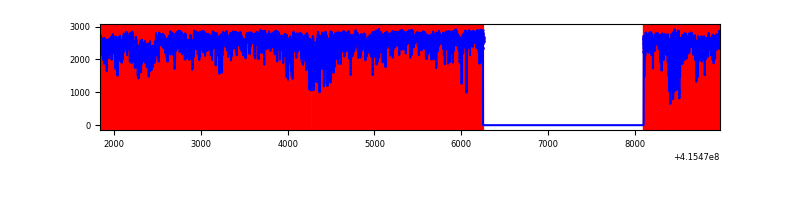 |
| D | 7151 | 5299 | 215 | 215 | 3.01% | 4.06% | 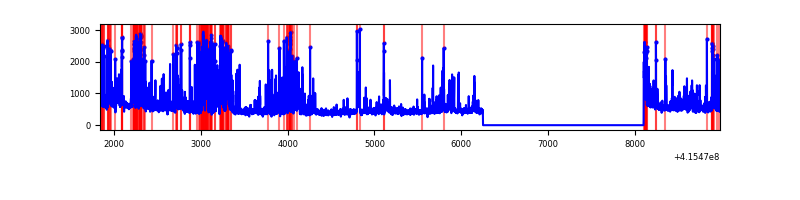 |
Top three noisy pixels from each quadrant. If the there are fewer than three noisy pixels in the level2.evt file, extra rows are filled as -1
| Pixel properties | Quadrant properties | ||||||
|---|---|---|---|---|---|---|---|
| Quadrant | DetID | PixID | Counts | Sigma | Mean | Median | Sigma |
| A | 13 | 248 | 499800 | 4226.2 | 578 | 568 | 118.1 |
| A | 10 | 83 | 425637 | 3598.38 | 578 | 568 | 118.1 |
| A | 9 | 143 | 54751 | 458.68 | 578 | 568 | 118.1 |
| B | 5 | 172 | 165407 | 1428.12 | 594 | 578 | 115.4 |
| B | 5 | 255 | 82637 | 710.98 | 594 | 578 | 115.4 |
| B | 0 | 190 | 48924 | 418.88 | 594 | 578 | 115.4 |
| C | 9 | 187 | 11827169 | 169122.7 | 298 | 301 | 69.9 |
| C | 15 | 214 | 118343 | 1687.99 | 298 | 301 | 69.9 |
| C | 0 | 10 | 20917 | 294.81 | 298 | 301 | 69.9 |
| D | 12 | 227 | 510931 | 3626.99 | 575 | 560 | 140.7 |
| D | 12 | 218 | 482811 | 3427.16 | 575 | 560 | 140.7 |
| D | 13 | 249 | 180092 | 1275.86 | 575 | 560 | 140.7 |
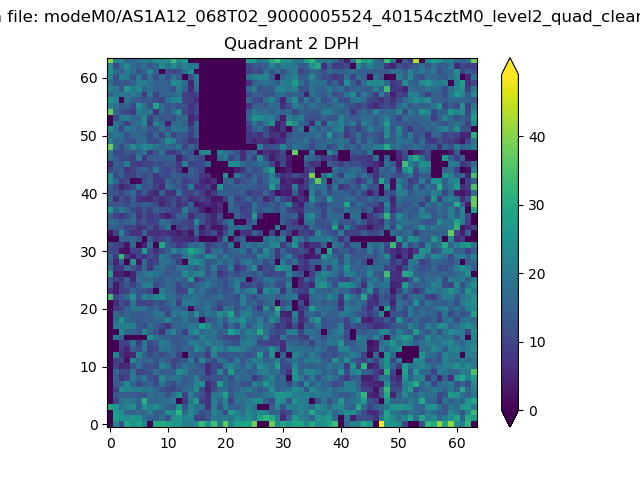
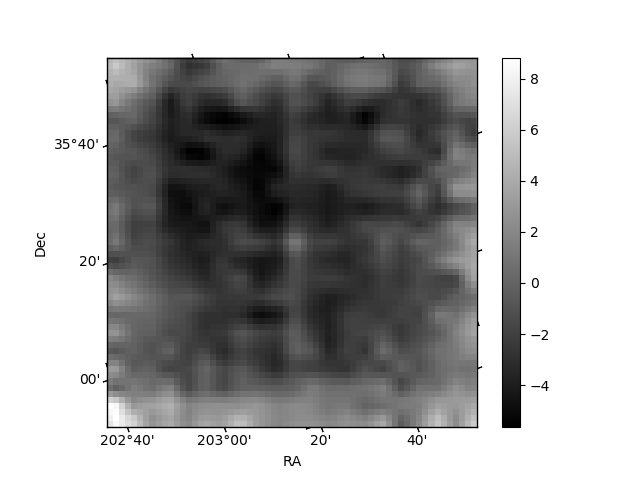
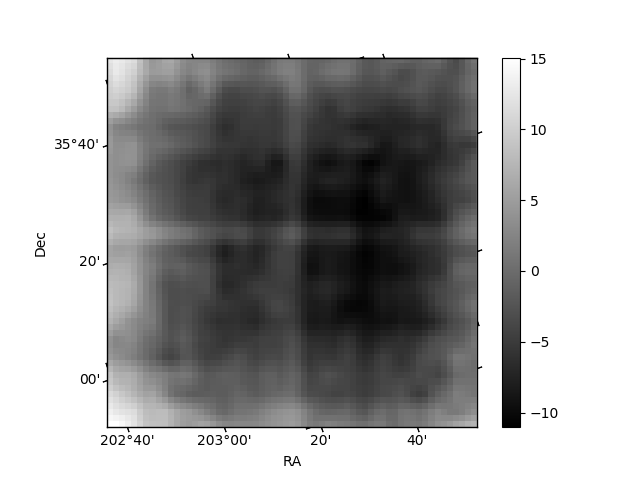
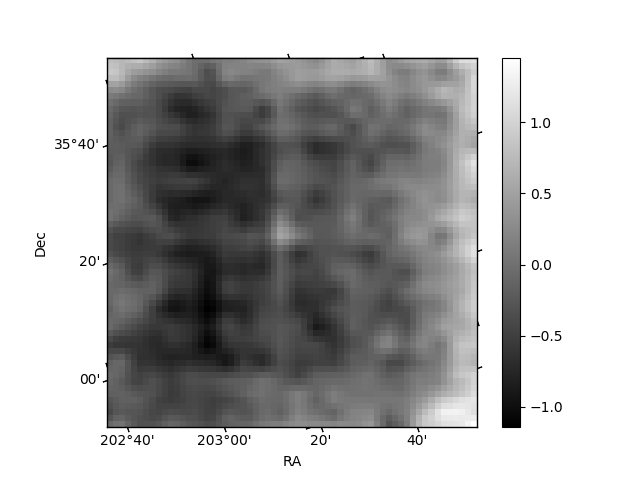
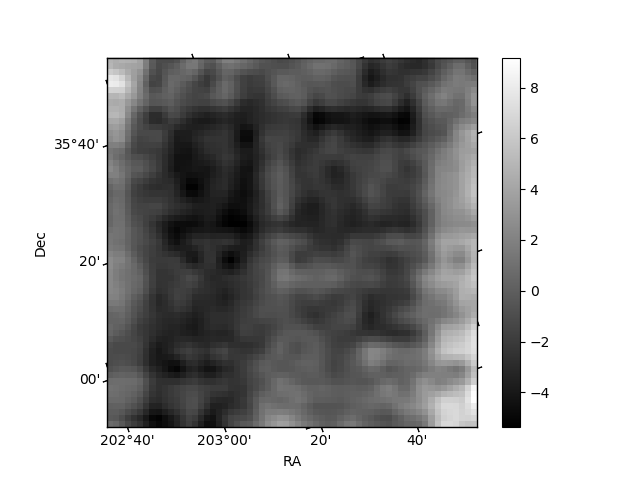
Histogram calculated using DETX and DETY for each event in the final _common_clean file
| Quadrant A | 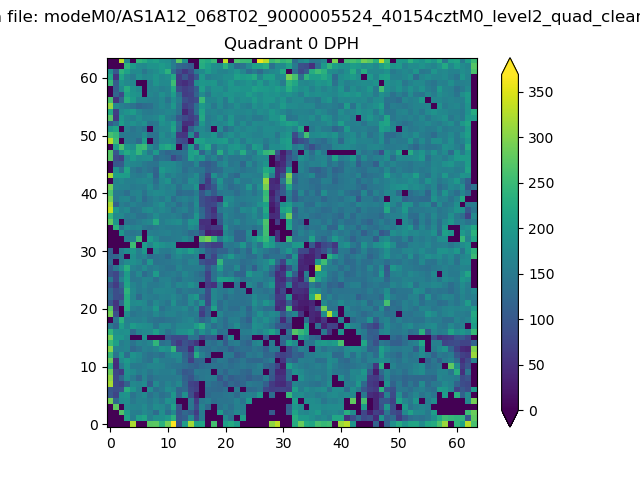 |
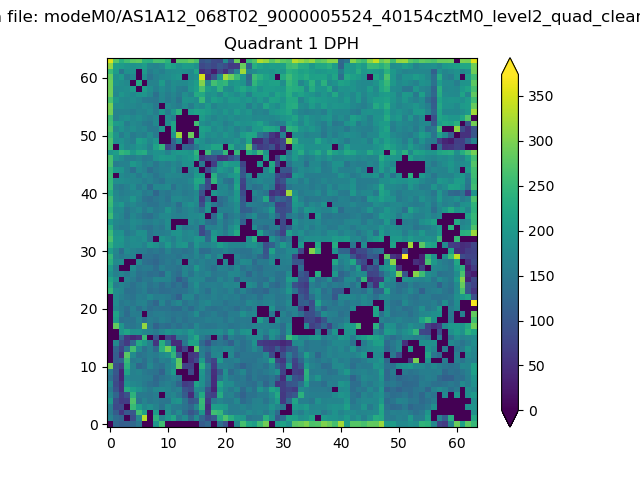 |
Quadrant B |
|---|---|---|---|
| Quadrant D | 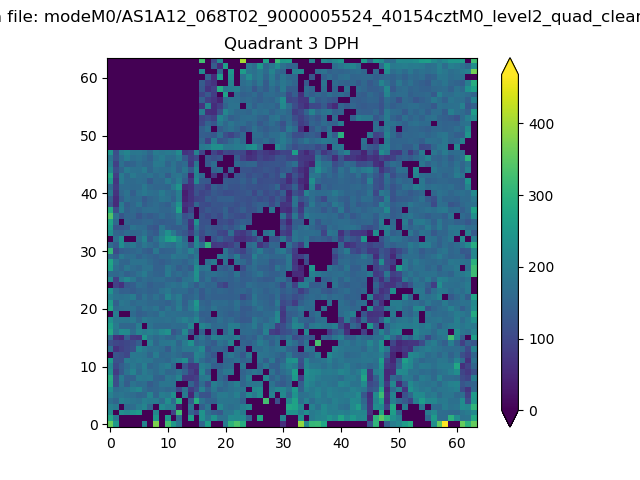 |
 |
Quadrant C |
| Plot type | Count rate plots | Images |
|---|---|---|
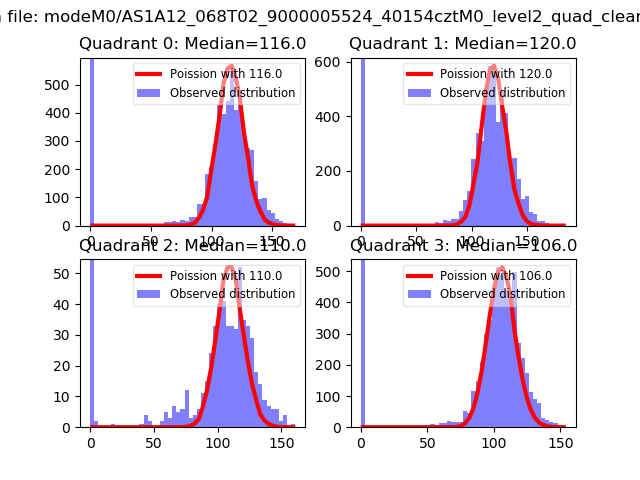
| Comparison with Poisson distribution Blue bars denote a histogram of data divided into 1 sec bins. Red curve is a Poisson curve with rate = median count rate of data. |
 |
 |
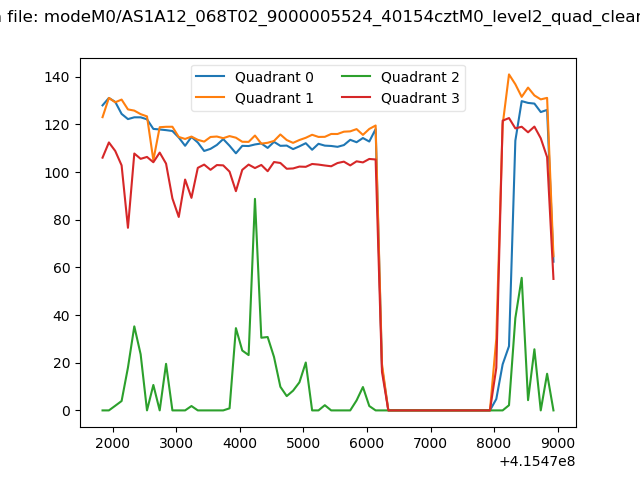
| Quadrant-wise count rates Data is divided into 100 sec bins |
 |
|
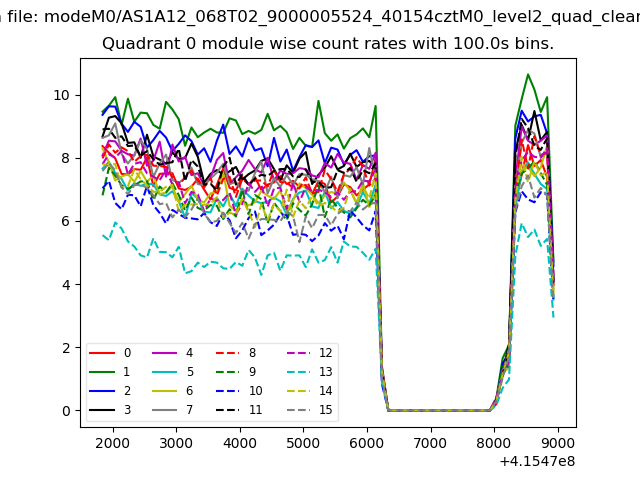
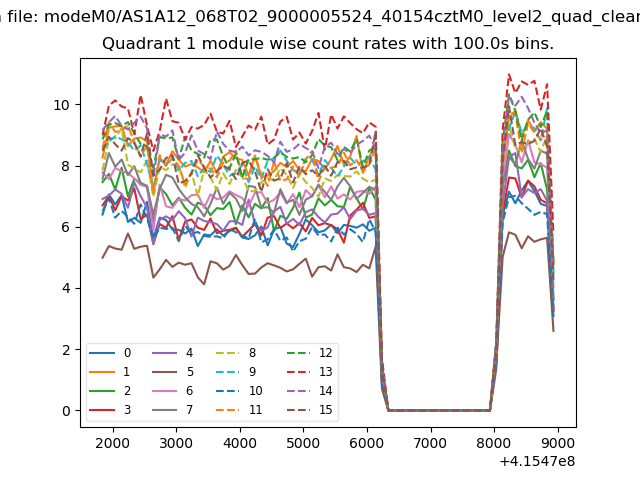
| Module-wise count rates for Quadrant A Data is divided into 100 sec bins |
 |
 |
| Module-wise count rates for Quadrant B Data is divided into 100 sec bins |
 |
 |
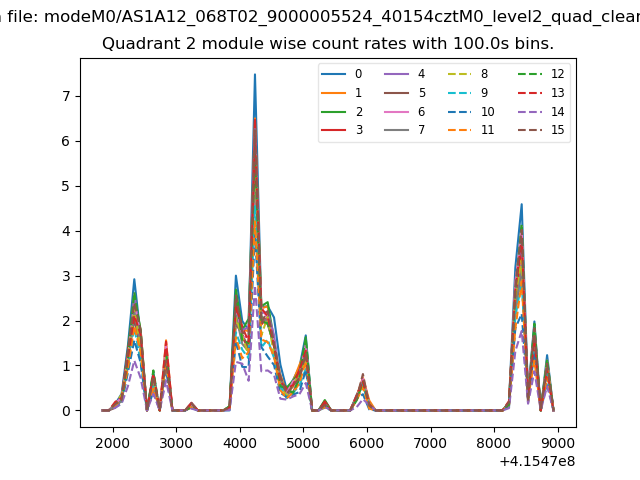
| Module-wise count rates for Quadrant C Data is divided into 100 sec bins |
 |
 |
| Module-wise count rates for Quadrant D Data is divided into 100 sec bins |
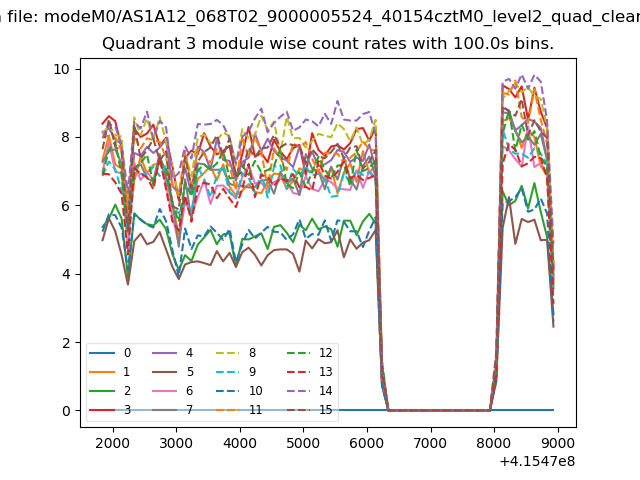 |
 |
| Parameter | Plot |
|---|---|
| CZT HV Monitor | 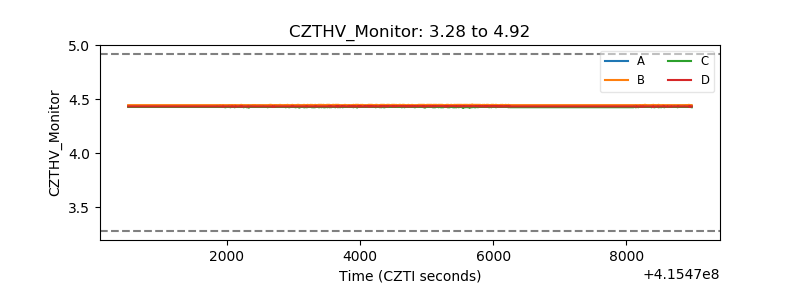 |
| D_VDD | 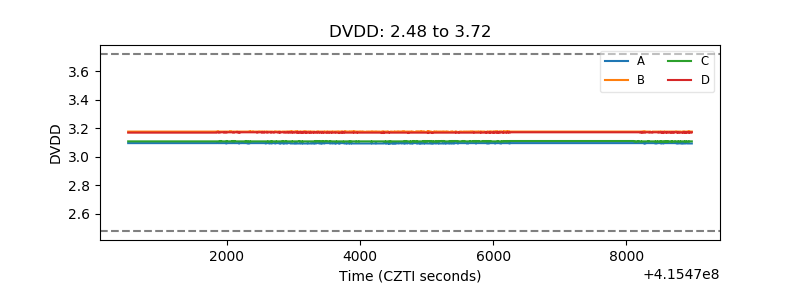 |
| Temperature 1 | 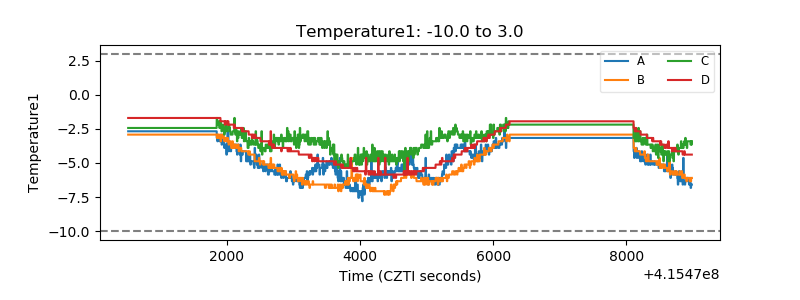 |
| Veto HV Monitor | 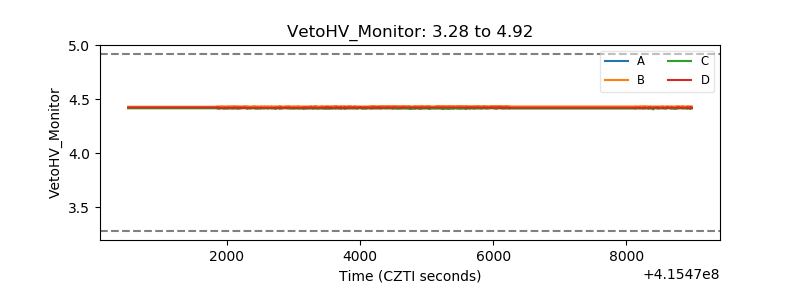 |
| Veto LLD | 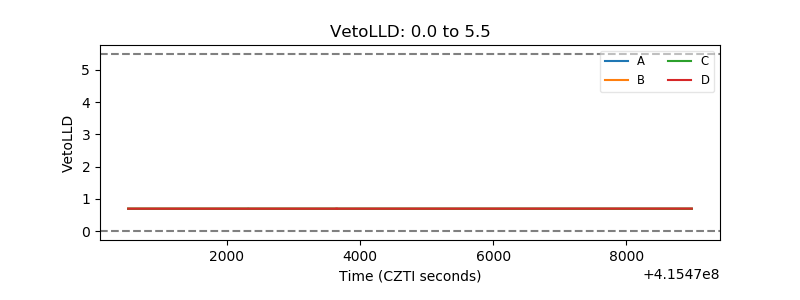 |
| Alpha Counter | 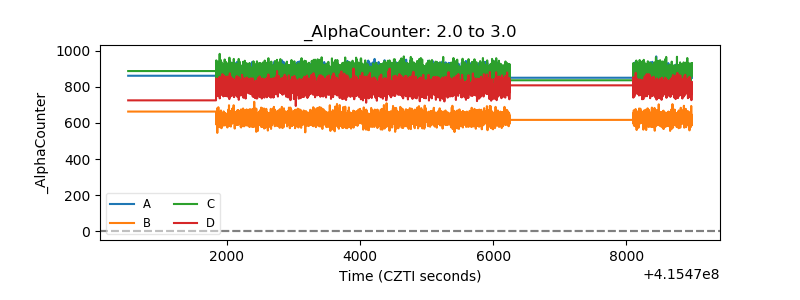 |
| _CPM_Rate | 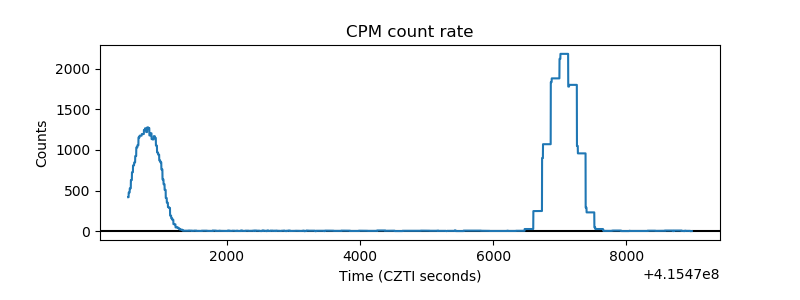 |
| CZT Counter | 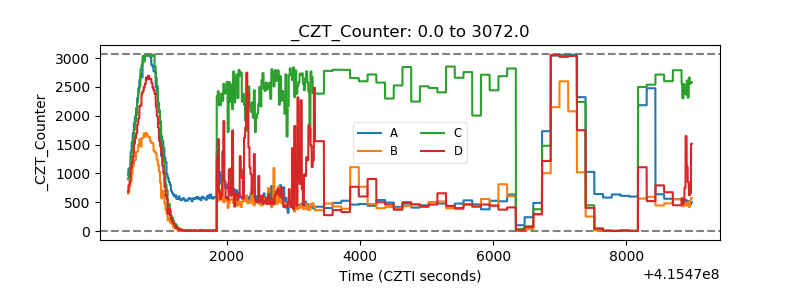 |
| +2.5 Volts monitor | 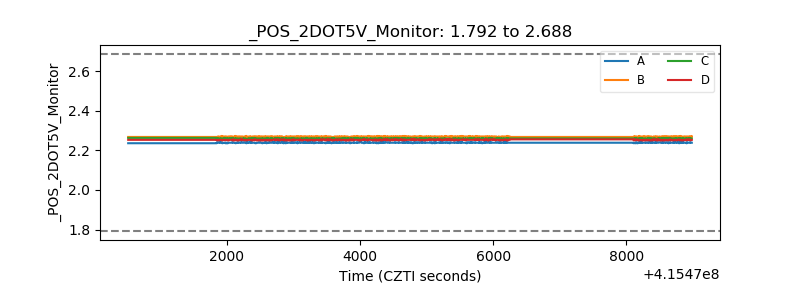 |
| +5 Volts monitor | 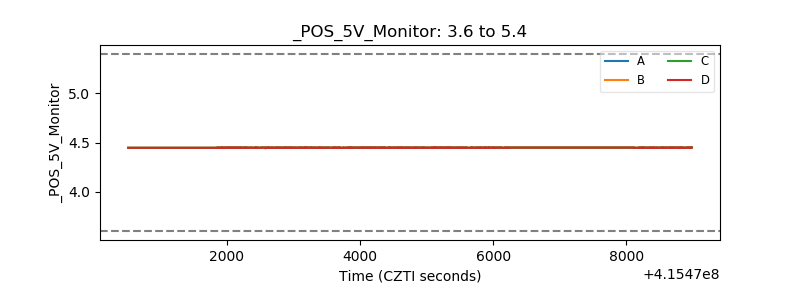 |
| _ROLL_ROT | 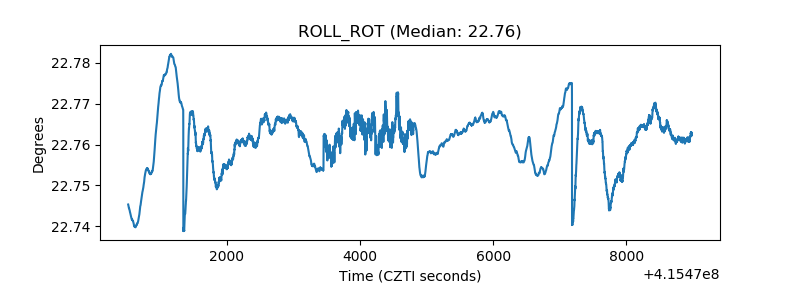 |
| _Roll_DEC | 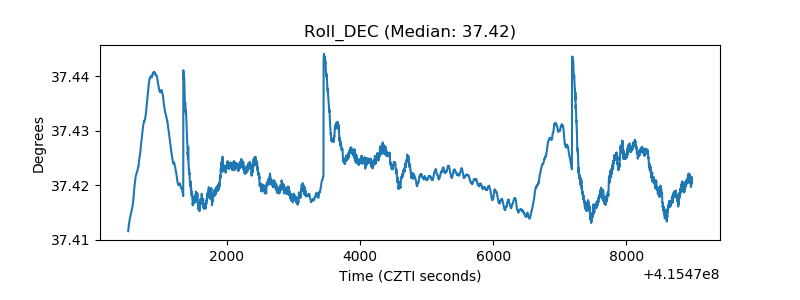 |
| _Roll_RA | 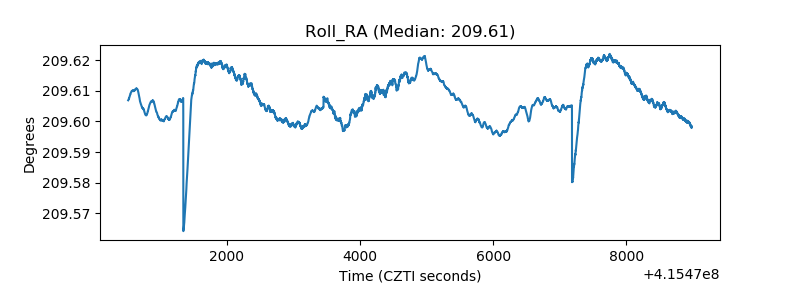 |
| Veto Counter | 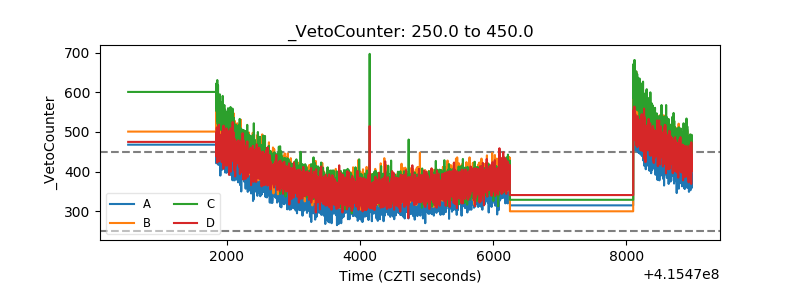 |