| Param | Original file | Final file |
|---|---|---|
| Filename | modeM0/AS1A12_068T02_9000005524_40155cztM0_level2.fits | modeM0/AS1A12_068T02_9000005524_40155cztM0_level2_quad_clean.evt |
| Size (bytes) | 606,749,760 | 72,745,920 |
| Size | 578.6 MB | 69.4 MB |
| Events in quadrant A | 3,191,426 | 599,851 |
| Events in quadrant B | 2,651,123 | 648,962 |
| Events in quadrant C | 13,399,828 | 15,806 |
| Events in quadrant D | 2,810,350 | 571,870 |
| Mode M9 | |||
|---|---|---|---|
| Quadrant | BADHDUFLAG | Total packets | Discarded packets |
| A | 0 | 38 | 0 |
| B | 0 | 38 | 0 |
| C | 0 | 38 | 0 |
| D | 0 | 38 | 0 |
| Mode SS | |||
|---|---|---|---|
| Quadrant | BADHDUFLAG | Total packets | Discarded packets |
| A | 0 | 110 | 0 |
| B | 0 | 110 | 0 |
| C | 0 | 110 | 0 |
| D | 0 | 110 | 0 |
| Mode M0 | |||
|---|---|---|---|
| Quadrant | BADHDUFLAG | Total packets | Discarded packets |
| A | 0 | 12712 | 3 |
| B | 0 | 11349 | 2 |
| C | 0 | 43430 | 2 |
| D | 0 | 12049 | 2 |
| Quadrant | Total seconds | Saturated seconds | Saturation percentage |
|---|---|---|---|
| A | 5223 | 233 | 4.461038% |
| B | 5223 | 90 | 1.723148% |
| C | 5223 | 5127 | 98.161976% |
| D | 5223 | 72 | 1.378518% |
Noise dominated data is calculated using 1-second bins in cleaned event files. If a bin has >2000 counts, and if more than 50% of those come from <1% of pixels, then it is considered to be noise-dominated and hence unusable.
| Quadrant | # 1 sec bins | Bins with >0 counts | Bins with >2000 counts | High rate bins dominated by noise | Noise dominated (total time) | Noise dominated (detector-on time) | Marked lightcurve |
|---|---|---|---|---|---|---|---|
| A | 9079 | 5225 | 206 | 206 | 2.27% | 3.94% | 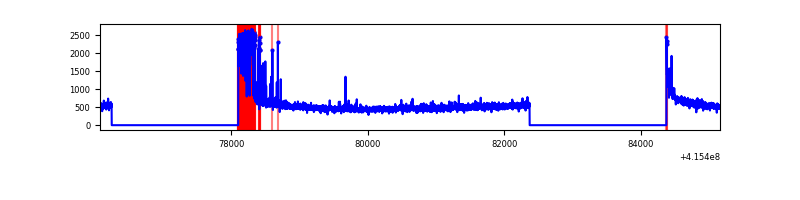 |
| B | 9079 | 5225 | 56 | 56 | 0.62% | 1.07% | 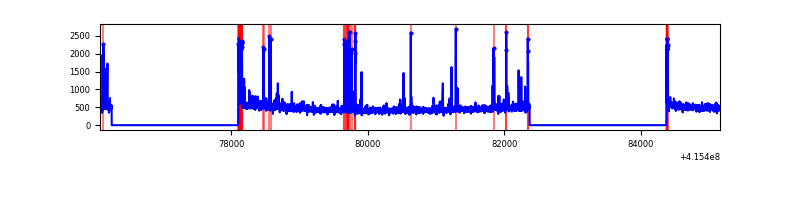 |
| C | 9078 | 5222 | 5092 | 5092 | 56.09% | 97.51% | 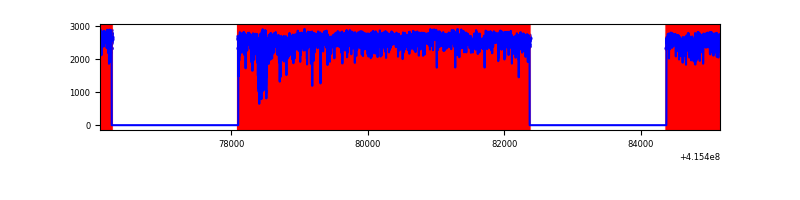 |
| D | 9079 | 5225 | 65 | 65 | 0.72% | 1.24% | 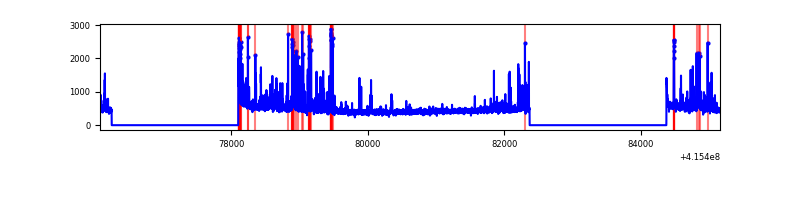 |
Top three noisy pixels from each quadrant. If the there are fewer than three noisy pixels in the level2.evt file, extra rows are filled as -1
| Pixel properties | Quadrant properties | ||||||
|---|---|---|---|---|---|---|---|
| Quadrant | DetID | PixID | Counts | Sigma | Mean | Median | Sigma |
| A | 13 | 248 | 496953 | 4226.84 | 577 | 566 | 117.4 |
| A | 10 | 83 | 418041 | 3554.89 | 577 | 566 | 117.4 |
| A | 6 | 10 | 11947 | 96.91 | 577 | 566 | 117.4 |
| B | 5 | 172 | 168515 | 1473.56 | 594 | 579 | 114.0 |
| B | 5 | 255 | 87901 | 766.21 | 594 | 579 | 114.0 |
| B | 4 | 171 | 22341 | 190.95 | 594 | 579 | 114.0 |
| C | 9 | 187 | 12428682 | 242593.14 | 216 | 218 | 51.2 |
| C | 15 | 214 | 86548 | 1685.09 | 216 | 218 | 51.2 |
| C | 0 | 10 | 18612 | 359.04 | 216 | 218 | 51.2 |
| D | 13 | 249 | 183926 | 1299.68 | 582 | 569 | 141.1 |
| D | 12 | 227 | 101682 | 716.71 | 582 | 569 | 141.1 |
| D | 9 | 19 | 62937 | 442.08 | 582 | 569 | 141.1 |
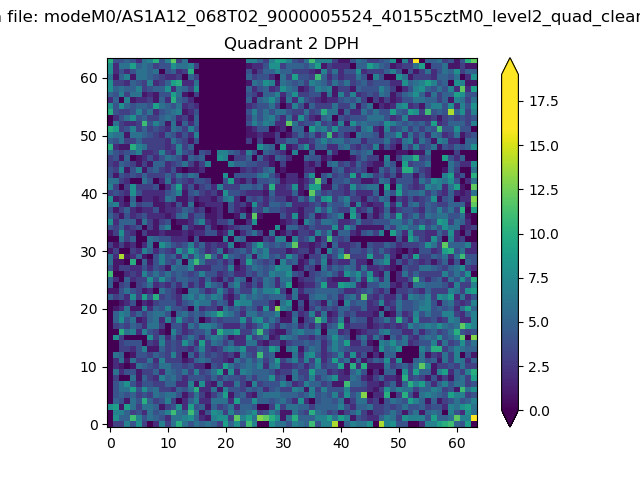
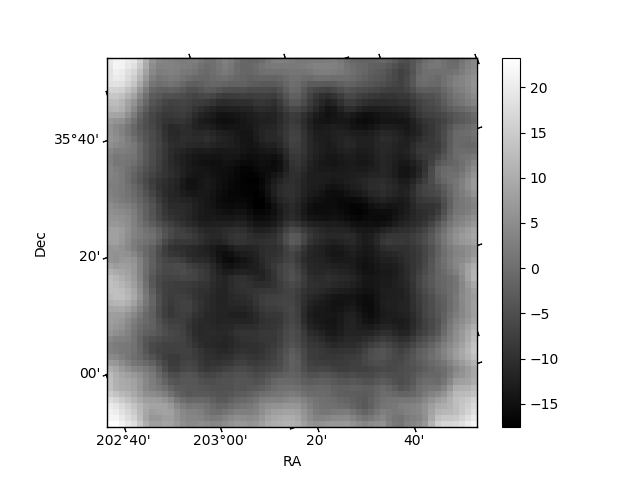
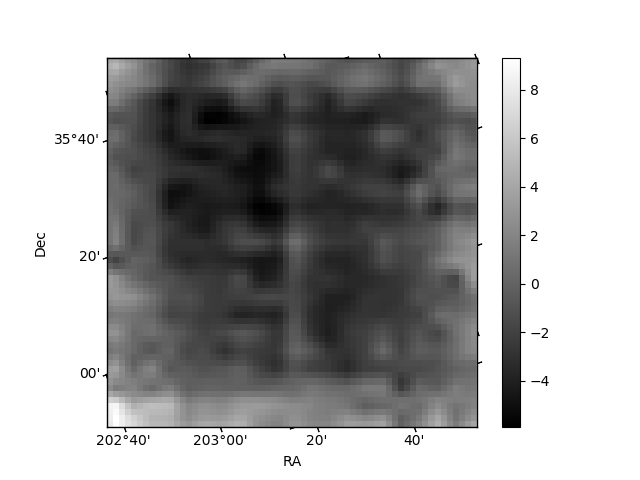
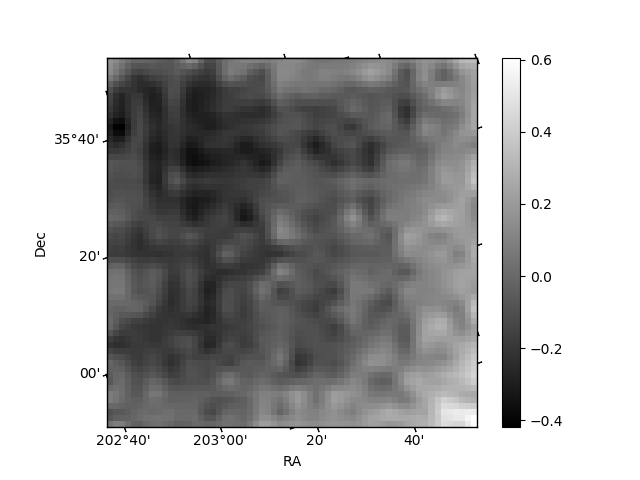
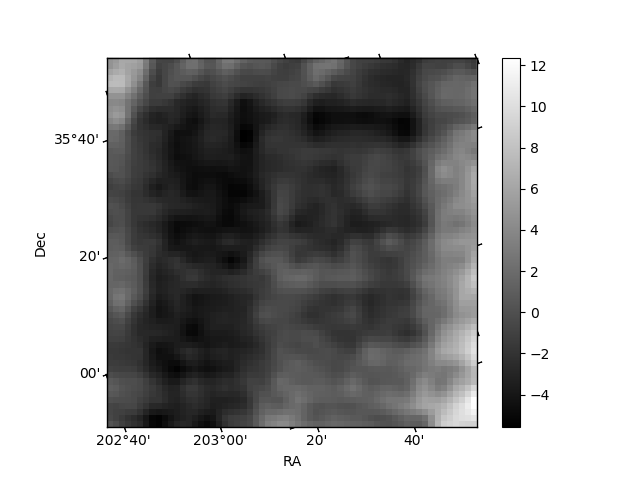
Histogram calculated using DETX and DETY for each event in the final _common_clean file
| Quadrant A | 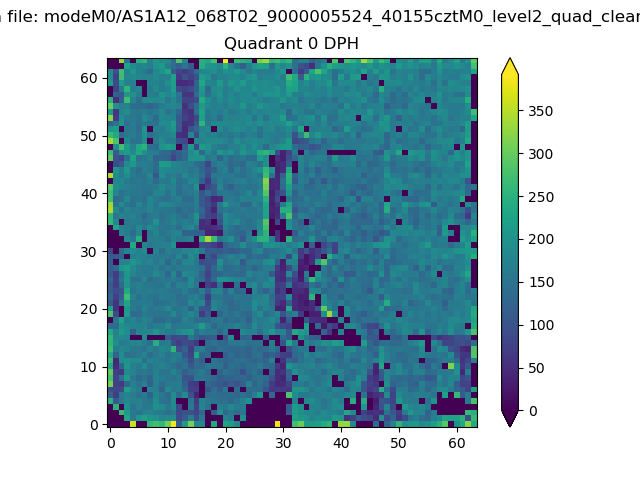 |
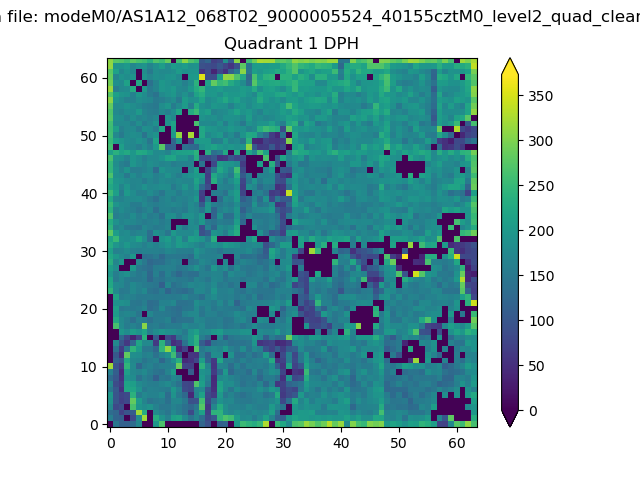 |
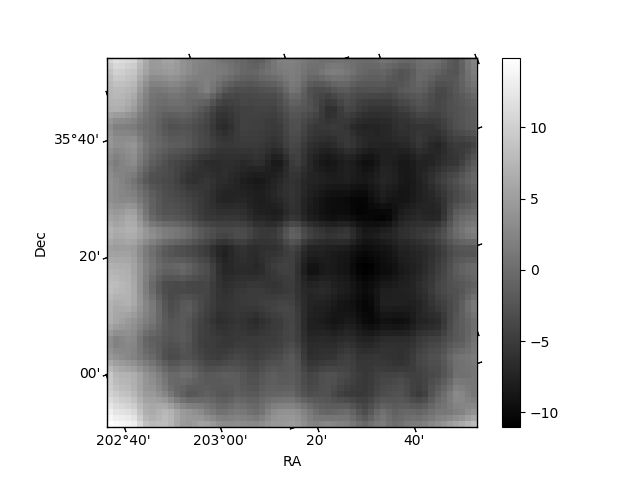
Quadrant B |
|---|---|---|---|
| Quadrant D | 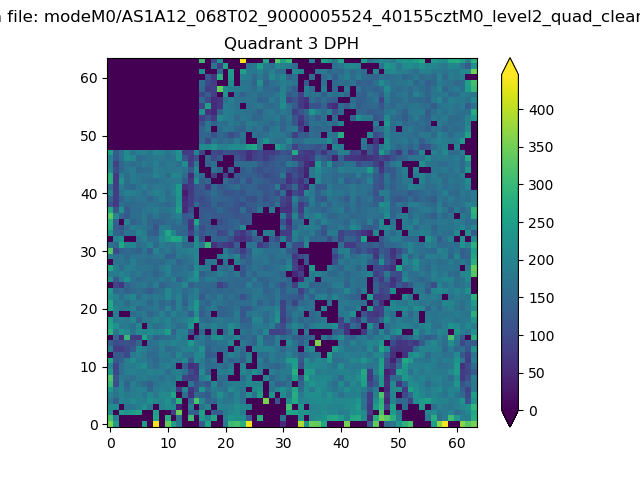 |
 |
Quadrant C |
| Plot type | Count rate plots | Images |
|---|---|---|
| Comparison with Poisson distribution Blue bars denote a histogram of data divided into 1 sec bins. Red curve is a Poisson curve with rate = median count rate of data. |
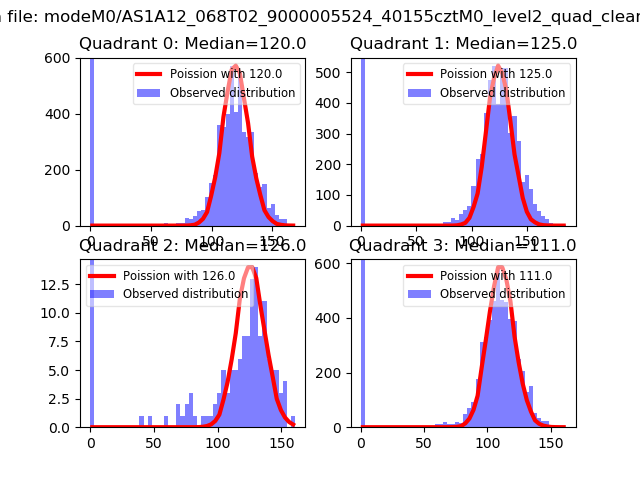 |
 |
| Quadrant-wise count rates Data is divided into 100 sec bins |
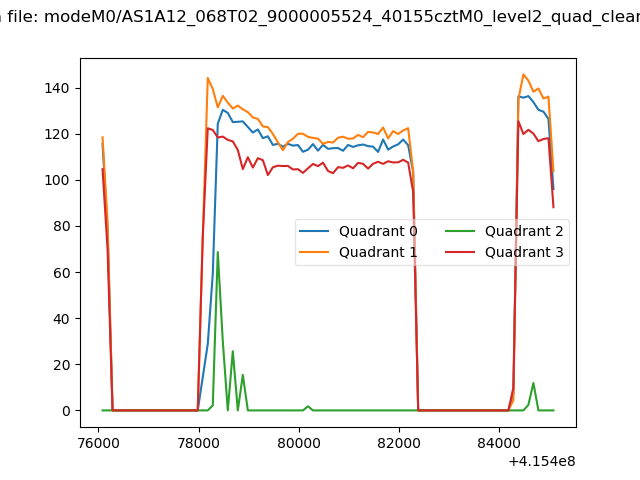 |
|
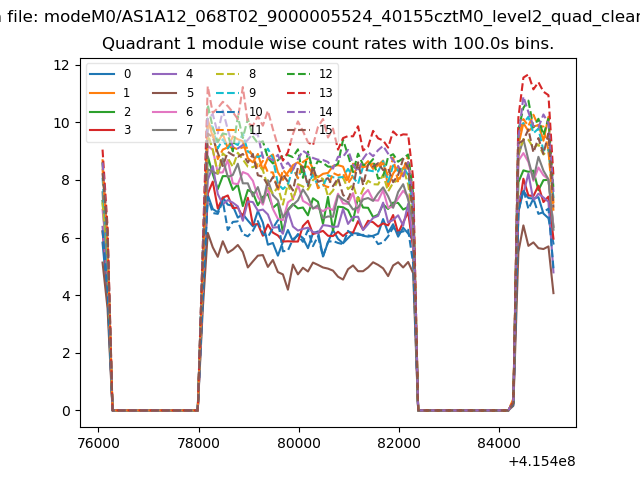
| Module-wise count rates for Quadrant A Data is divided into 100 sec bins |
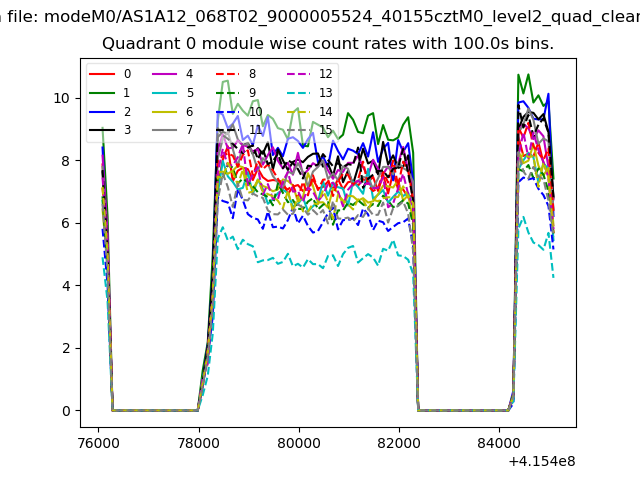 |
 |
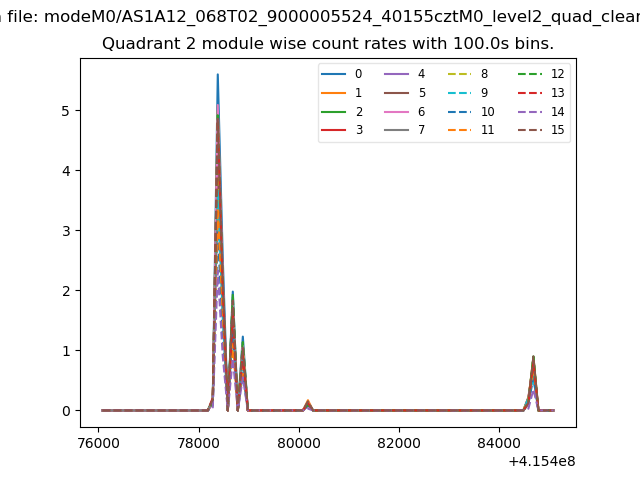
| Module-wise count rates for Quadrant B Data is divided into 100 sec bins |
 |
 |
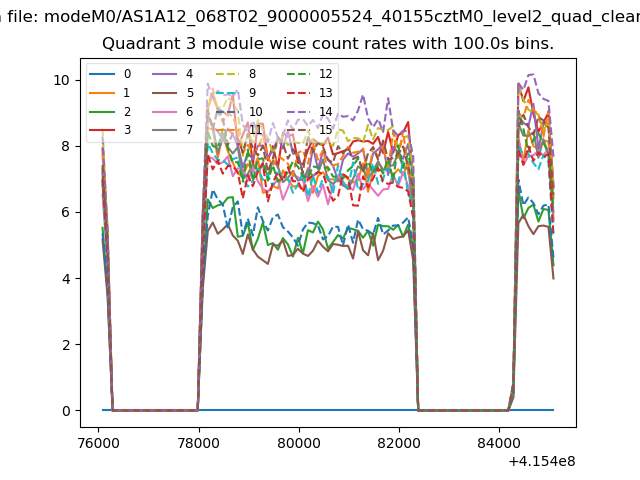
| Module-wise count rates for Quadrant C Data is divided into 100 sec bins |
 |
 |
| Module-wise count rates for Quadrant D Data is divided into 100 sec bins |
 |
 |
| Parameter | Plot |
|---|---|
| CZT HV Monitor | 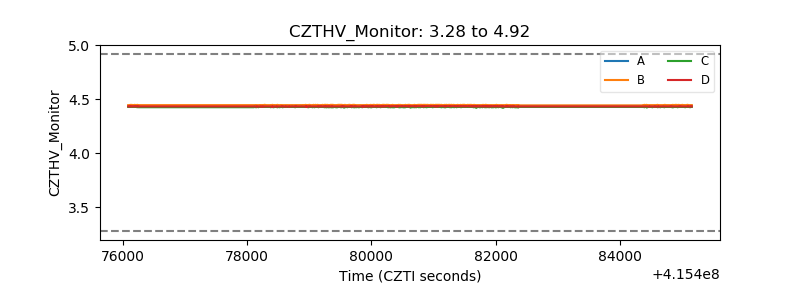 |
| D_VDD | 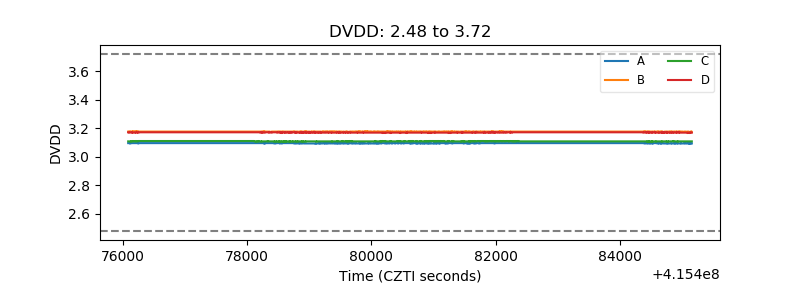 |
| Temperature 1 | 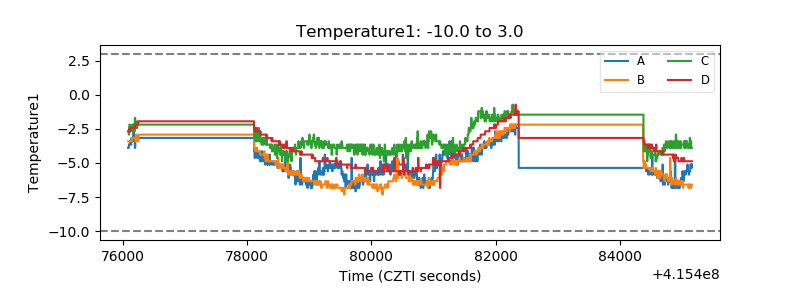 |
| Veto HV Monitor |  |
| Veto LLD | 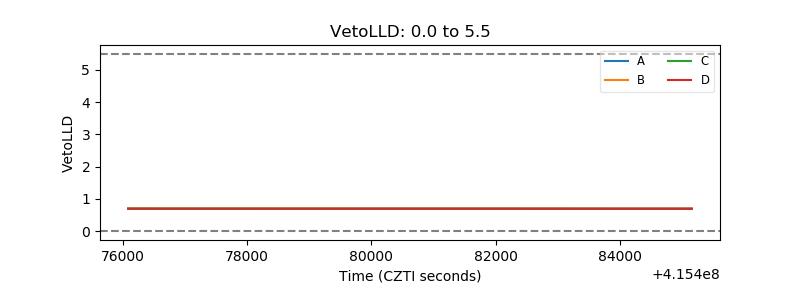 |
| Alpha Counter | 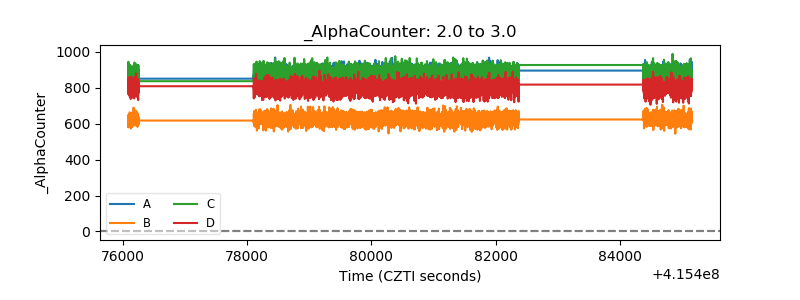 |
| _CPM_Rate |  |
| CZT Counter | 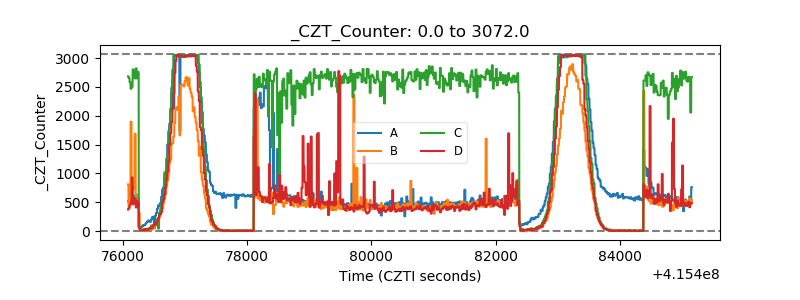 |
| +2.5 Volts monitor |  |
| +5 Volts monitor | 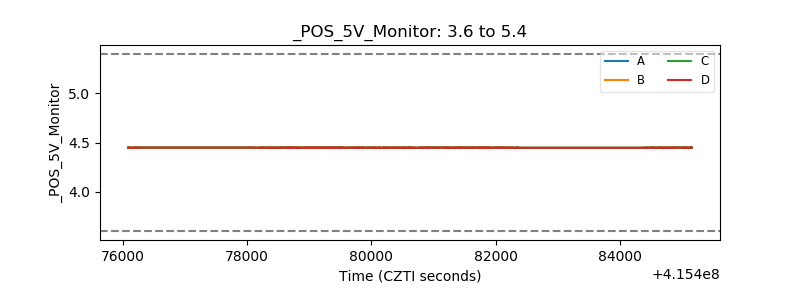 |
| _ROLL_ROT | 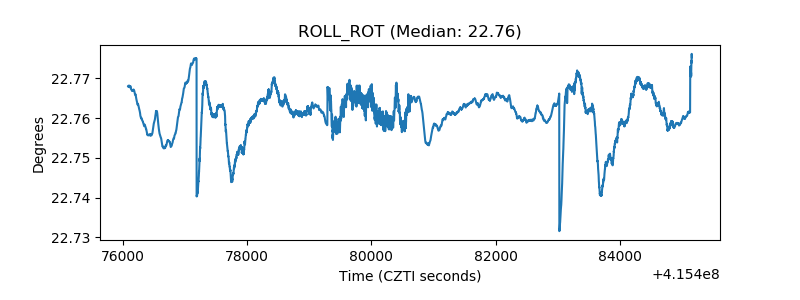 |
| _Roll_DEC | 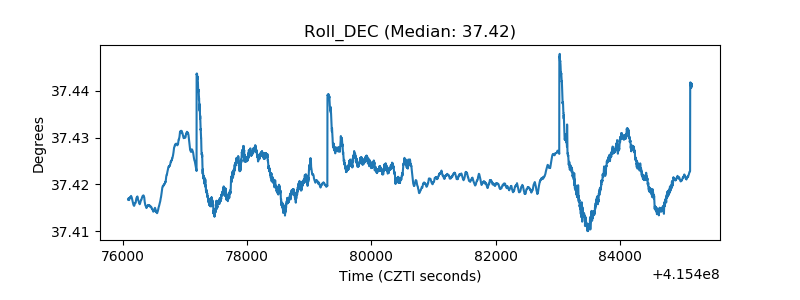 |
| _Roll_RA | 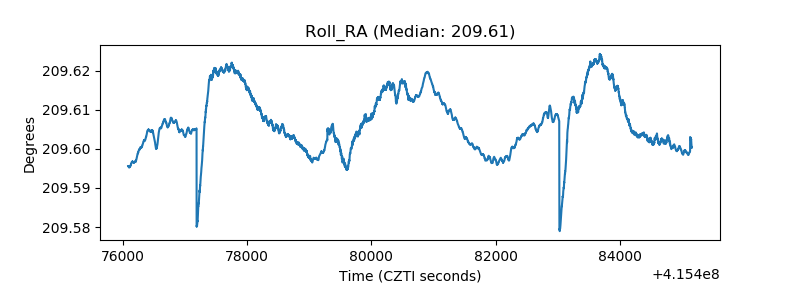 |
| Veto Counter | 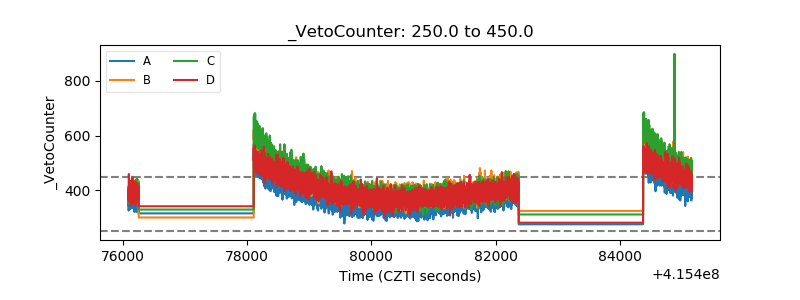 |