| Param | Original file | Final file |
|---|---|---|
| Filename | modeM0/AS1A12_068T02_9000005524_40156cztM0_level2.fits | modeM0/AS1A12_068T02_9000005524_40156cztM0_level2_quad_clean.evt |
| Size (bytes) | 609,099,840 | 74,986,560 |
| Size | 580.9 MB | 71.5 MB |
| Events in quadrant A | 2,874,462 | 642,276 |
| Events in quadrant B | 2,540,203 | 671,891 |
| Events in quadrant C | 13,870,557 | 3,250 |
| Events in quadrant D | 2,847,494 | 581,442 |
| Mode M9 | |||
|---|---|---|---|
| Quadrant | BADHDUFLAG | Total packets | Discarded packets |
| A | 0 | 41 | 0 |
| B | 0 | 41 | 0 |
| C | 0 | 41 | 0 |
| D | 0 | 41 | 0 |
| Mode SS | |||
|---|---|---|---|
| Quadrant | BADHDUFLAG | Total packets | Discarded packets |
| A | 0 | 110 | 0 |
| B | 0 | 110 | 0 |
| C | 0 | 110 | 0 |
| D | 0 | 110 | 0 |
| Mode M0 | |||
|---|---|---|---|
| Quadrant | BADHDUFLAG | Total packets | Discarded packets |
| A | 0 | 11777 | 3 |
| B | 0 | 11035 | 2 |
| C | 0 | 44904 | 2 |
| D | 0 | 12168 | 2 |
| Quadrant | Total seconds | Saturated seconds | Saturation percentage |
|---|---|---|---|
| A | 5312 | 14 | 0.263554% |
| B | 5312 | 40 | 0.753012% |
| C | 5312 | 5295 | 99.679970% |
| D | 5312 | 87 | 1.637801% |
Noise dominated data is calculated using 1-second bins in cleaned event files. If a bin has >2000 counts, and if more than 50% of those come from <1% of pixels, then it is considered to be noise-dominated and hence unusable.
| Quadrant | # 1 sec bins | Bins with >0 counts | Bins with >2000 counts | High rate bins dominated by noise | Noise dominated (total time) | Noise dominated (detector-on time) | Marked lightcurve |
|---|---|---|---|---|---|---|---|
| A | 9407 | 5314 | 7 | 7 | 0.07% | 0.13% | 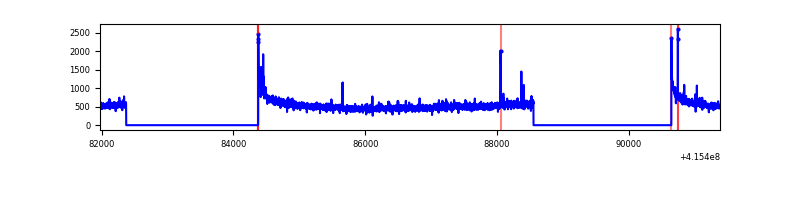 |
| B | 9407 | 5314 | 20 | 20 | 0.21% | 0.38% | 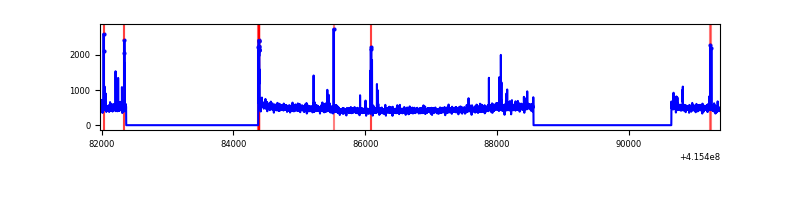 |
| C | 9406 | 5311 | 5266 | 5266 | 55.99% | 99.15% | 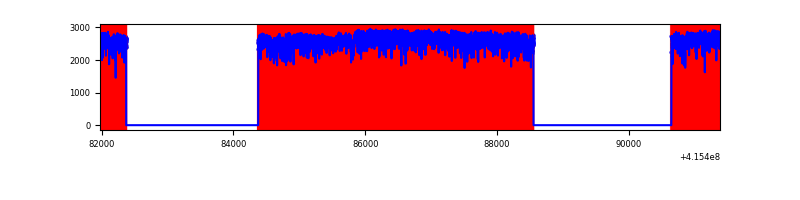 |
| D | 9407 | 5314 | 87 | 87 | 0.92% | 1.64% | 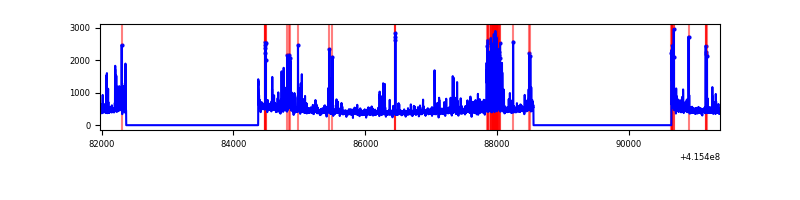 |
Top three noisy pixels from each quadrant. If the there are fewer than three noisy pixels in the level2.evt file, extra rows are filled as -1
| Pixel properties | Quadrant properties | ||||||
|---|---|---|---|---|---|---|---|
| Quadrant | DetID | PixID | Counts | Sigma | Mean | Median | Sigma |
| A | 10 | 83 | 455350 | 3678.42 | 605 | 595 | 123.6 |
| A | 2 | 79 | 39966 | 318.46 | 605 | 595 | 123.6 |
| A | 6 | 10 | 14403 | 111.69 | 605 | 595 | 123.6 |
| B | 5 | 172 | 48184 | 410.16 | 608 | 592 | 116.0 |
| B | 4 | 171 | 33469 | 283.34 | 608 | 592 | 116.0 |
| B | 5 | 255 | 31034 | 262.36 | 608 | 592 | 116.0 |
| C | 9 | 187 | 12918168 | 264214.26 | 209 | 211 | 48.9 |
| C | 15 | 214 | 84445 | 1722.86 | 209 | 211 | 48.9 |
| C | 9 | 203 | 14513 | 292.52 | 209 | 211 | 48.9 |
| D | 13 | 249 | 285227 | 1986.48 | 589 | 573 | 143.3 |
| D | 12 | 227 | 93553 | 648.87 | 589 | 573 | 143.3 |
| D | 9 | 19 | 67138 | 464.53 | 589 | 573 | 143.3 |
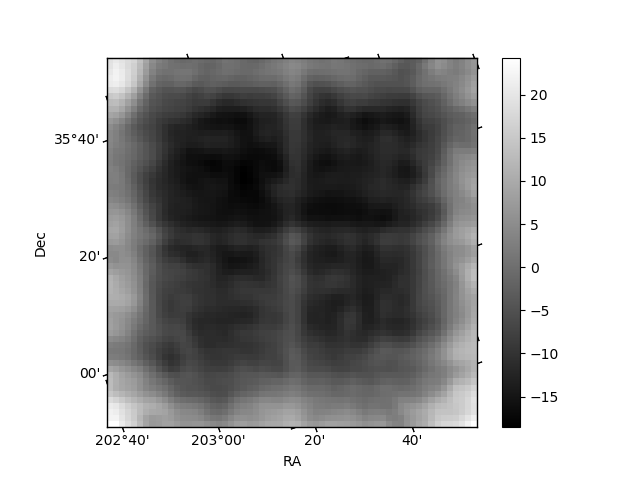
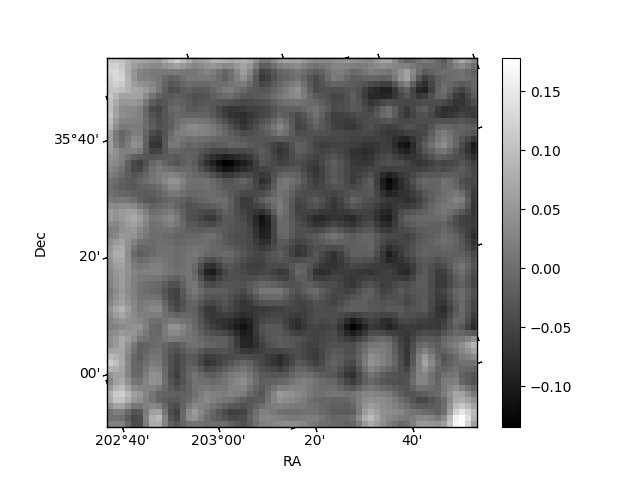
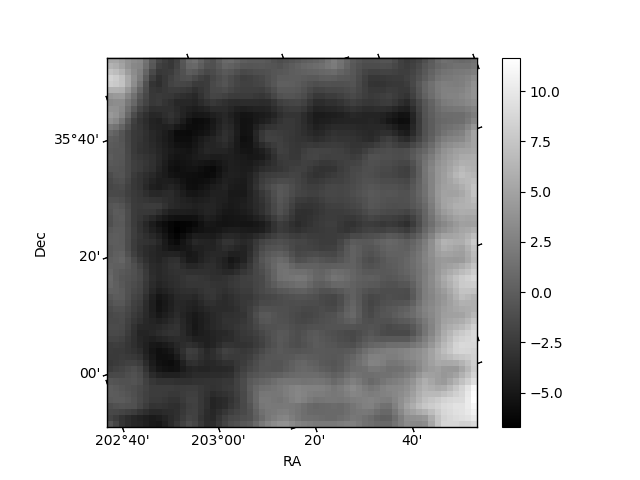
Histogram calculated using DETX and DETY for each event in the final _common_clean file
| Quadrant A | 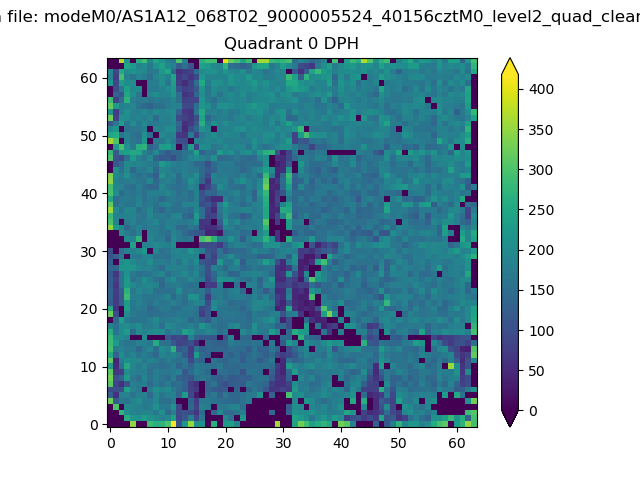 |
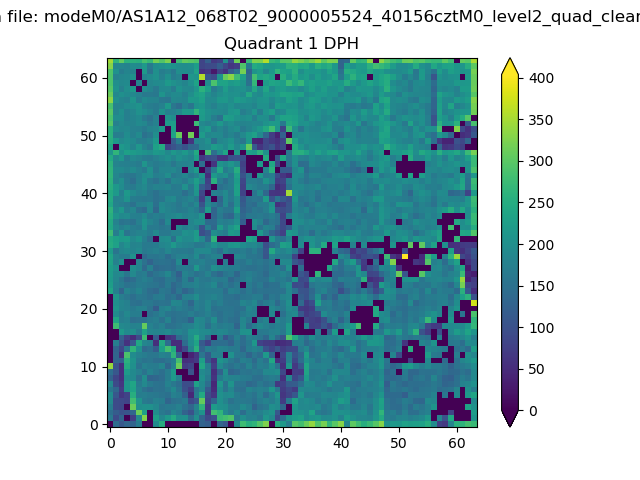 |
Quadrant B |
|---|---|---|---|
| Quadrant D | 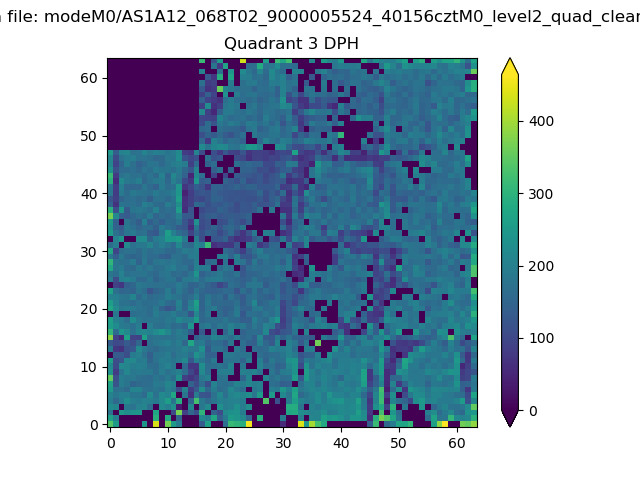 |
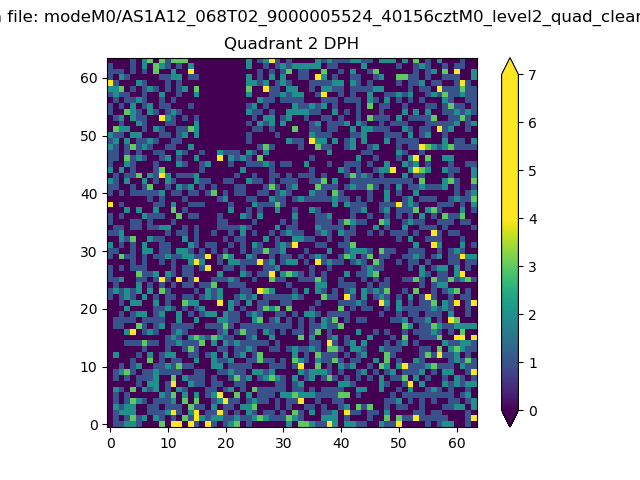 |
Quadrant C |
| Plot type | Count rate plots | Images |
|---|---|---|
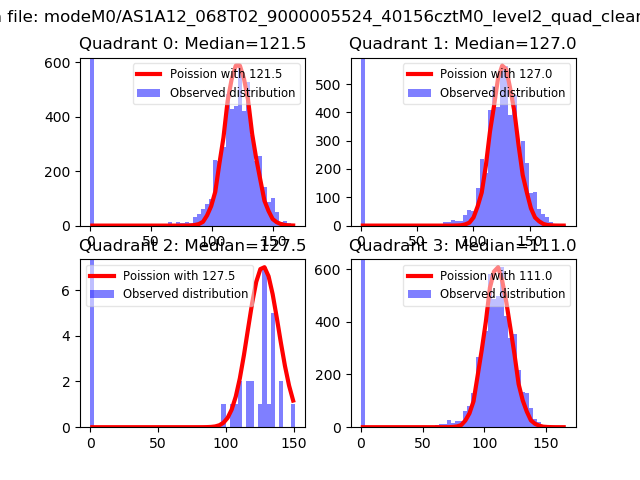
| Comparison with Poisson distribution Blue bars denote a histogram of data divided into 1 sec bins. Red curve is a Poisson curve with rate = median count rate of data. |
 |
 |
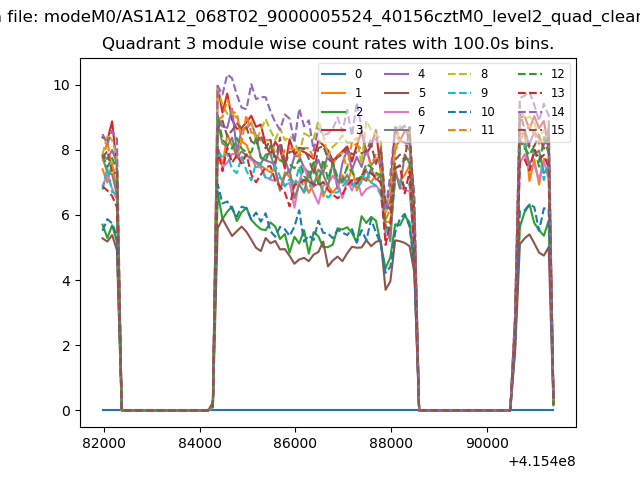
| Quadrant-wise count rates Data is divided into 100 sec bins |
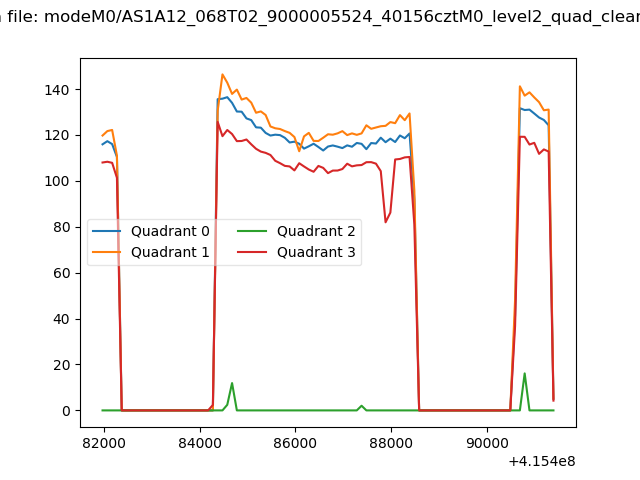 |
|
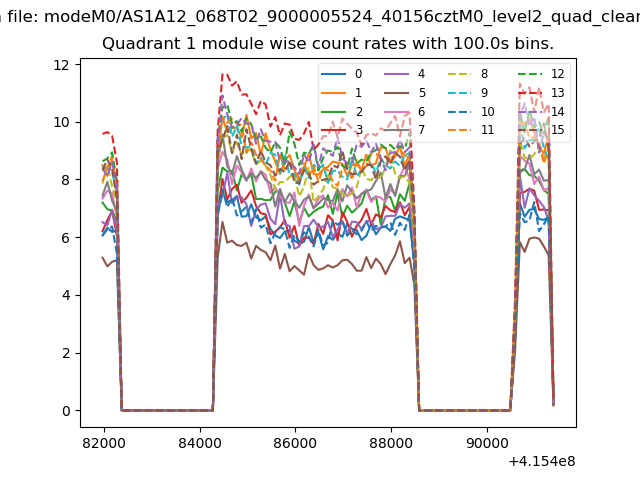
| Module-wise count rates for Quadrant A Data is divided into 100 sec bins |
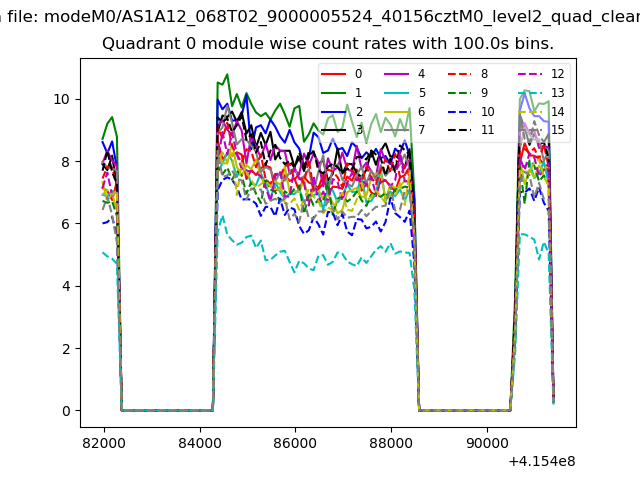 |
 |
| Module-wise count rates for Quadrant B Data is divided into 100 sec bins |
 |
 |
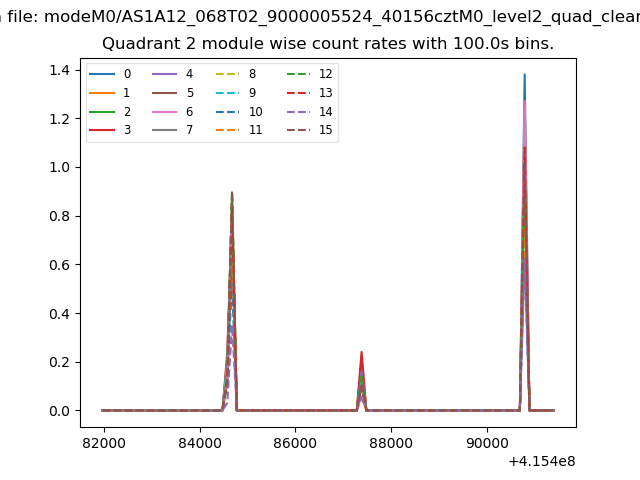
| Module-wise count rates for Quadrant C Data is divided into 100 sec bins |
 |
 |
| Module-wise count rates for Quadrant D Data is divided into 100 sec bins |
 |
 |
| Parameter | Plot |
|---|---|
| CZT HV Monitor | 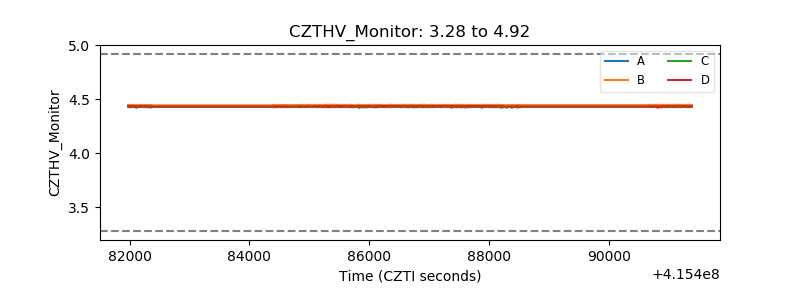 |
| D_VDD | 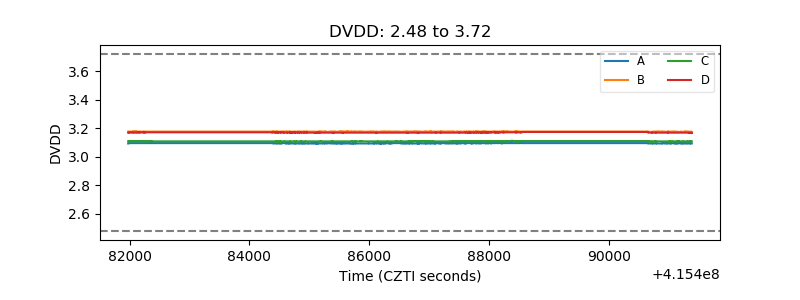 |
| Temperature 1 | 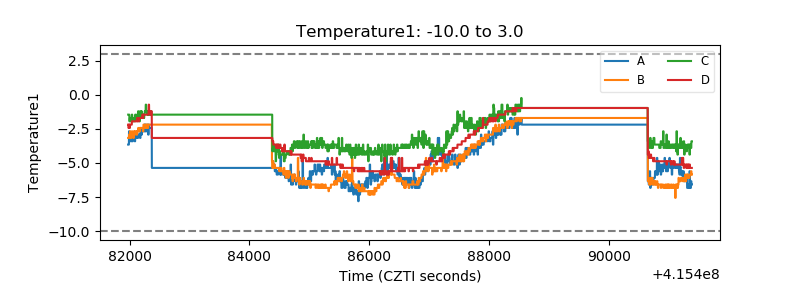 |
| Veto HV Monitor | 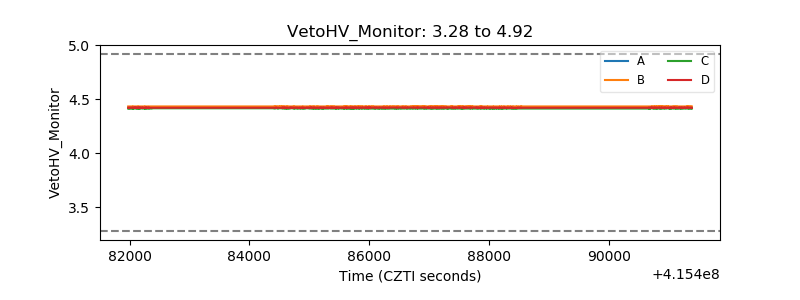 |
| Veto LLD | 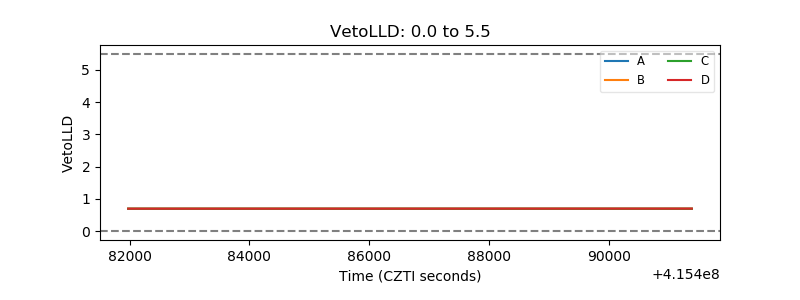 |
| Alpha Counter | 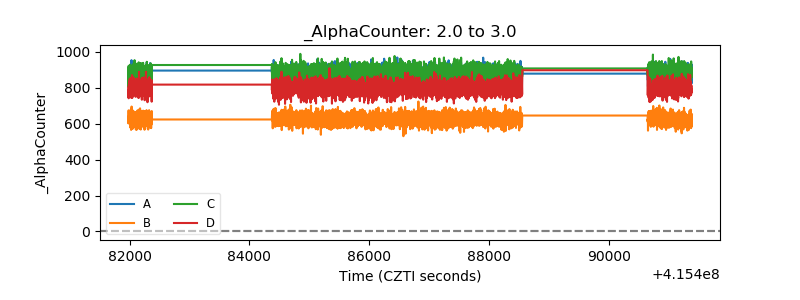 |
| _CPM_Rate | 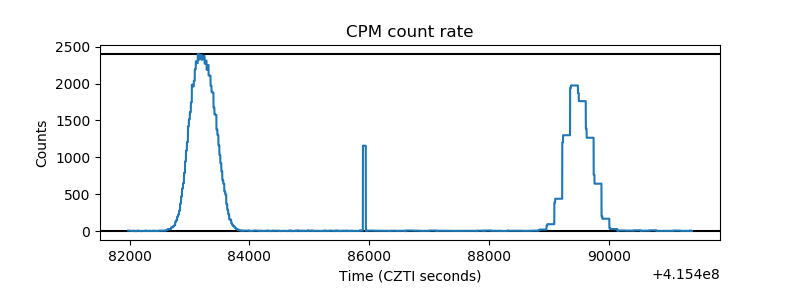 |
| CZT Counter | 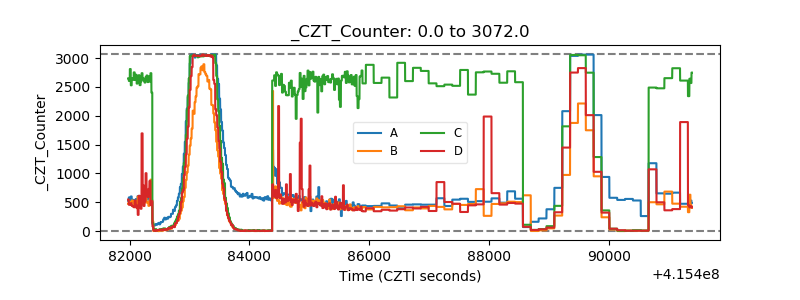 |
| +2.5 Volts monitor | 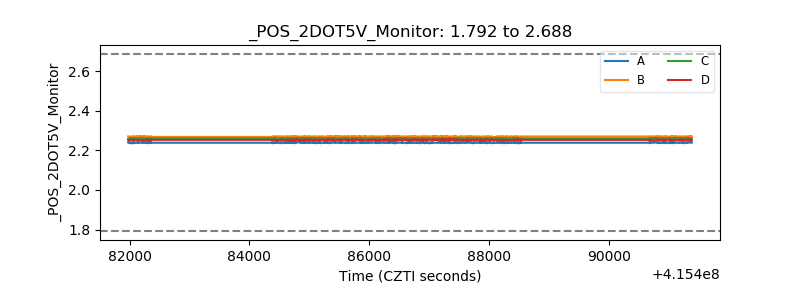 |
| +5 Volts monitor | 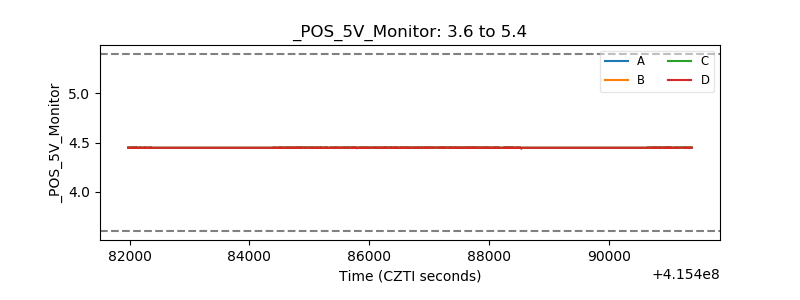 |
| _ROLL_ROT | 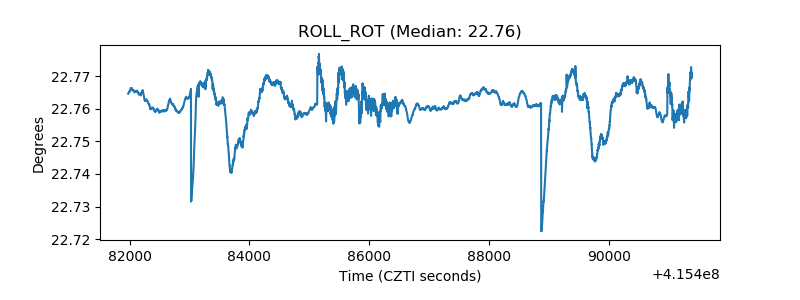 |
| _Roll_DEC | 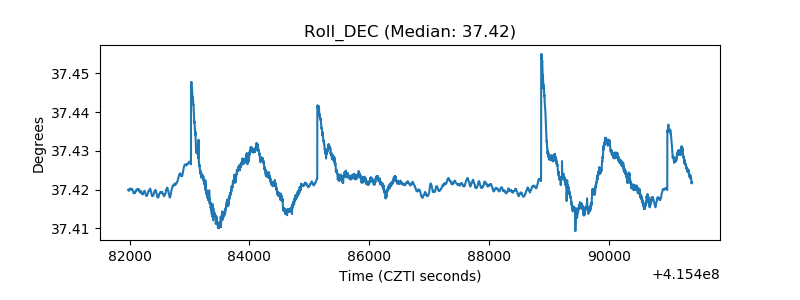 |
| _Roll_RA | 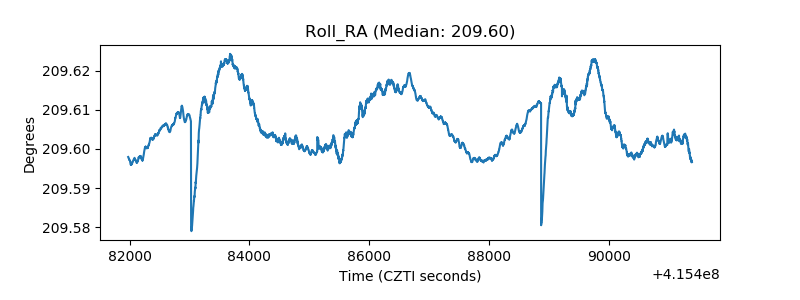 |
| Veto Counter | 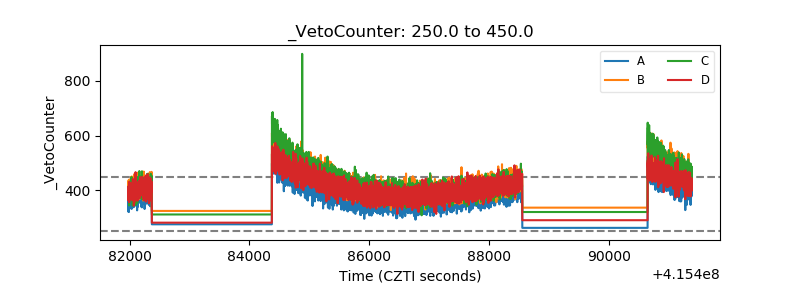 |