| Param | Original file | Final file |
|---|---|---|
| Filename | modeM0/AS1A12_068T02_9000005524_40157cztM0_level2.fits | modeM0/AS1A12_068T02_9000005524_40157cztM0_level2_quad_clean.evt |
| Size (bytes) | 560,295,360 | 68,561,280 |
| Size | 534.3 MB | 65.4 MB |
| Events in quadrant A | 2,636,521 | 583,627 |
| Events in quadrant B | 2,287,380 | 611,493 |
| Events in quadrant C | 12,976,713 | 7,366 |
| Events in quadrant D | 2,455,443 | 528,104 |
| Mode M9 | |||
|---|---|---|---|
| Quadrant | BADHDUFLAG | Total packets | Discarded packets |
| A | 0 | 31 | 0 |
| B | 0 | 31 | 0 |
| C | 0 | 31 | 0 |
| D | 0 | 32 | 0 |
| Mode SS | |||
|---|---|---|---|
| Quadrant | BADHDUFLAG | Total packets | Discarded packets |
| A | 0 | 100 | 0 |
| B | 0 | 100 | 0 |
| C | 0 | 100 | 0 |
| D | 0 | 100 | 0 |
| Mode M0 | |||
|---|---|---|---|
| Quadrant | BADHDUFLAG | Total packets | Discarded packets |
| A | 0 | 10900 | 3 |
| B | 0 | 10081 | 2 |
| C | 0 | 42020 | 2 |
| D | 0 | 10984 | 2 |
| Quadrant | Total seconds | Saturated seconds | Saturation percentage |
|---|---|---|---|
| A | 4927 | 12 | 0.243556% |
| B | 4927 | 13 | 0.263852% |
| C | 4927 | 4881 | 99.066369% |
| D | 4927 | 69 | 1.400447% |
Noise dominated data is calculated using 1-second bins in cleaned event files. If a bin has >2000 counts, and if more than 50% of those come from <1% of pixels, then it is considered to be noise-dominated and hence unusable.
| Quadrant | # 1 sec bins | Bins with >0 counts | Bins with >2000 counts | High rate bins dominated by noise | Noise dominated (total time) | Noise dominated (detector-on time) | Marked lightcurve |
|---|---|---|---|---|---|---|---|
| A | 7081 | 4928 | 5 | 5 | 0.07% | 0.10% | 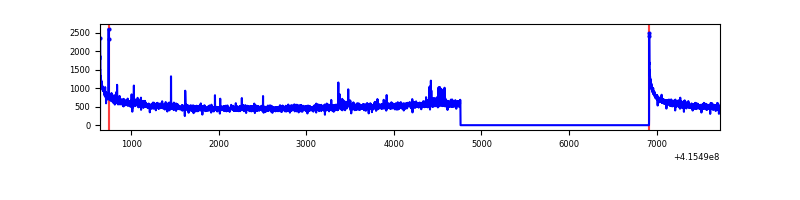 |
| B | 7081 | 4928 | 6 | 6 | 0.08% | 0.12% | 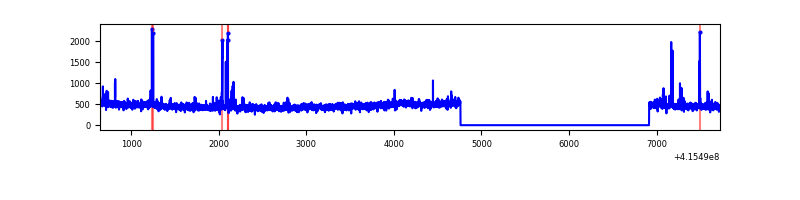 |
| C | 7080 | 4926 | 4874 | 4874 | 68.84% | 98.94% | 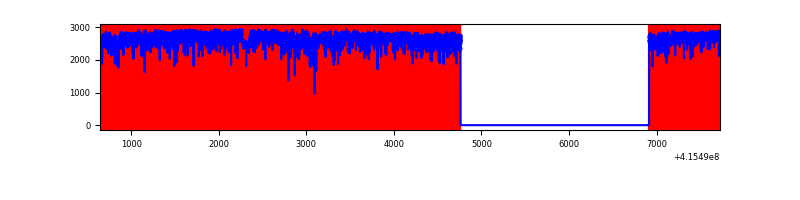 |
| D | 7080 | 4927 | 62 | 62 | 0.88% | 1.26% | 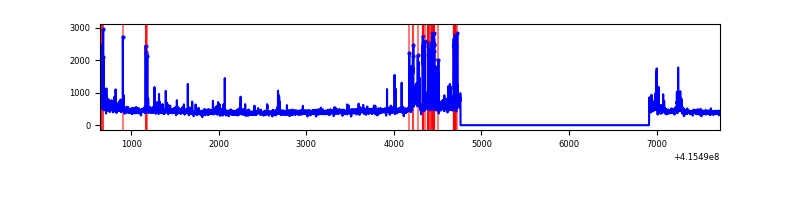 |
Top three noisy pixels from each quadrant. If the there are fewer than three noisy pixels in the level2.evt file, extra rows are filled as -1
| Pixel properties | Quadrant properties | ||||||
|---|---|---|---|---|---|---|---|
| Quadrant | DetID | PixID | Counts | Sigma | Mean | Median | Sigma |
| A | 10 | 83 | 435516 | 3911.91 | 547 | 537 | 111.2 |
| A | 2 | 79 | 25984 | 228.85 | 547 | 537 | 111.2 |
| A | 6 | 10 | 22164 | 194.5 | 547 | 537 | 111.2 |
| B | 5 | 172 | 63331 | 588.87 | 552 | 538 | 106.6 |
| B | 0 | 190 | 26741 | 245.73 | 552 | 538 | 106.6 |
| B | 0 | 230 | 25108 | 230.42 | 552 | 538 | 106.6 |
| C | 9 | 187 | 12091406 | 270720.99 | 189 | 191 | 44.7 |
| C | 15 | 214 | 78890 | 1762.06 | 189 | 191 | 44.7 |
| C | 14 | 254 | 22087 | 490.25 | 189 | 191 | 44.7 |
| D | 12 | 227 | 203016 | 1566.21 | 530 | 516 | 129.3 |
| D | 13 | 249 | 110058 | 847.24 | 530 | 516 | 129.3 |
| D | 2 | 250 | 25801 | 195.56 | 530 | 516 | 129.3 |
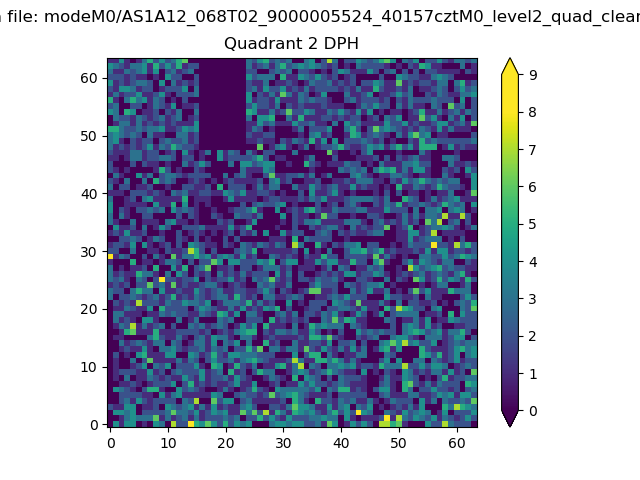
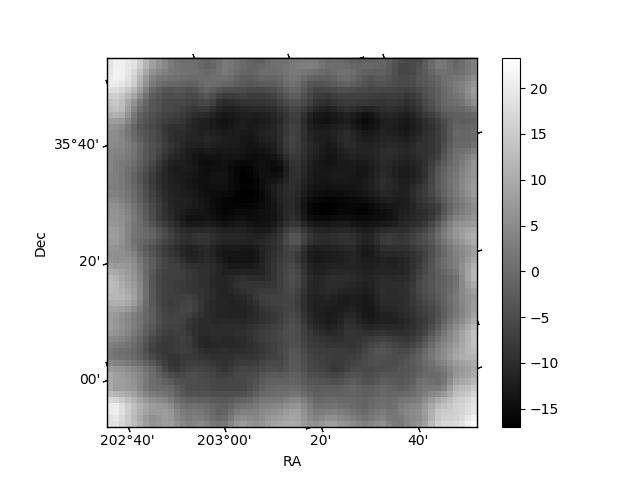
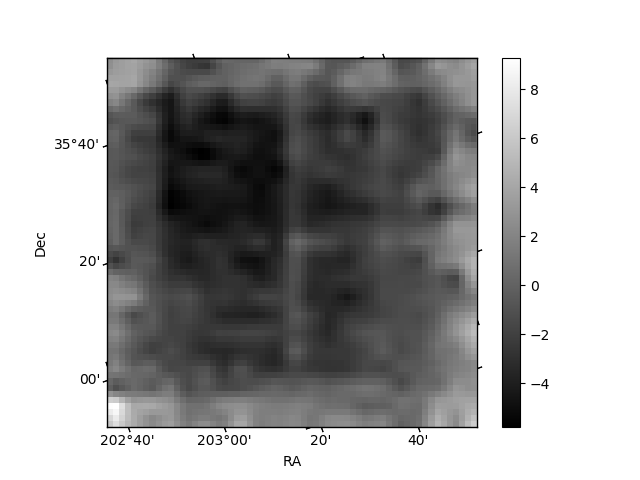
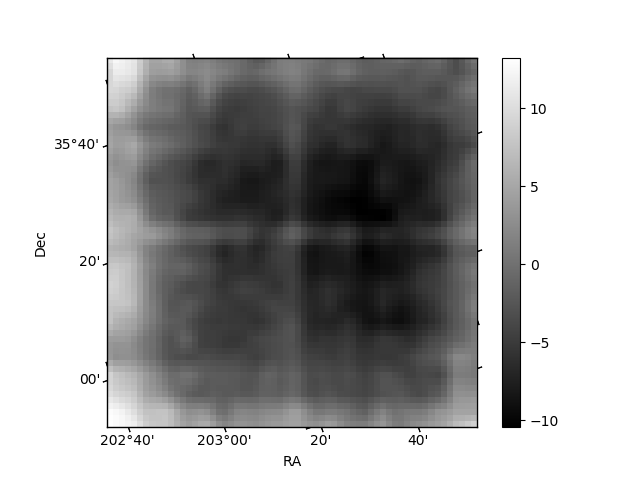
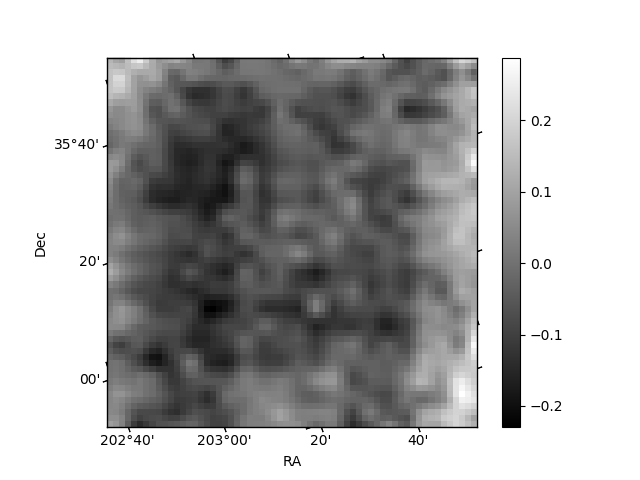
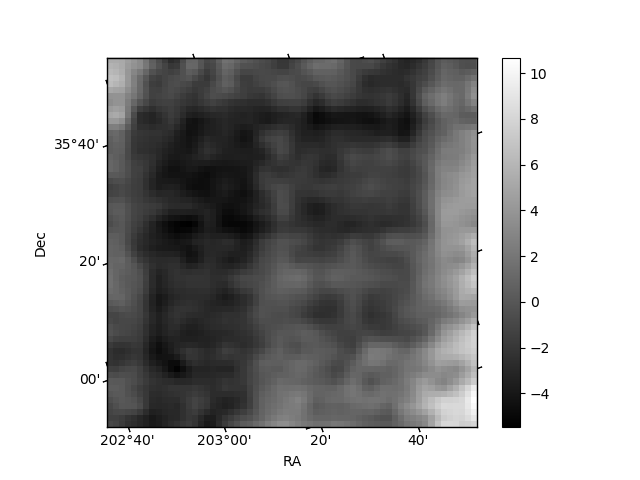
Histogram calculated using DETX and DETY for each event in the final _common_clean file
| Quadrant A | 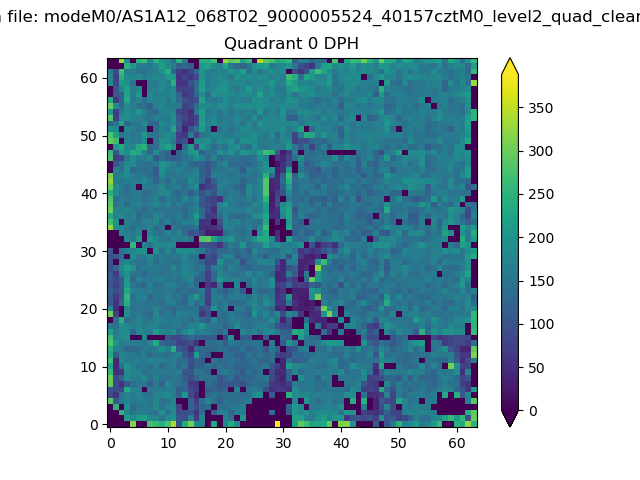 |
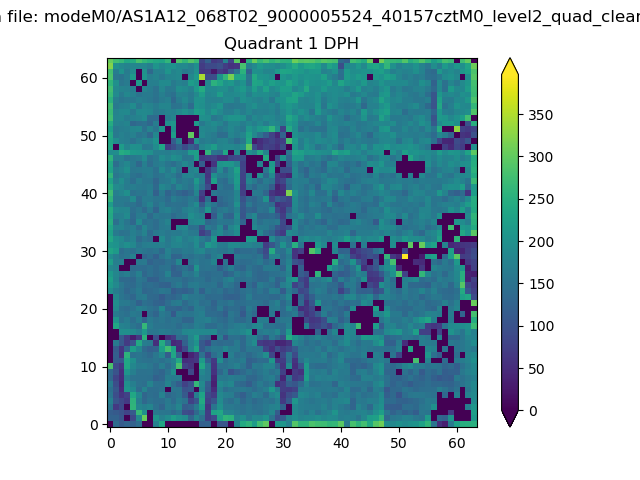 |
Quadrant B |
|---|---|---|---|
| Quadrant D | 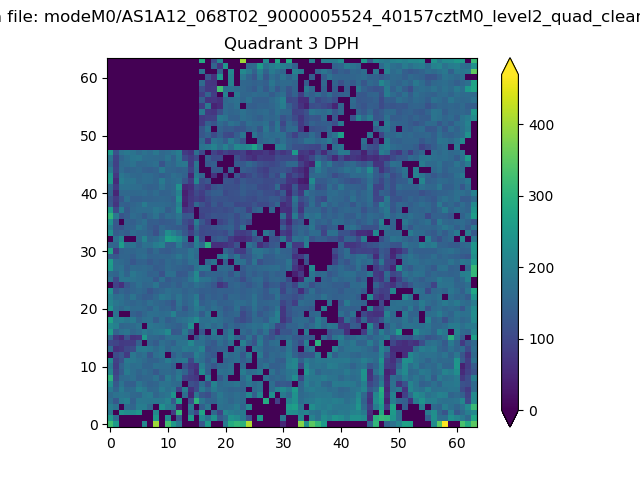 |
 |
Quadrant C |
| Plot type | Count rate plots | Images |
|---|---|---|
| Comparison with Poisson distribution Blue bars denote a histogram of data divided into 1 sec bins. Red curve is a Poisson curve with rate = median count rate of data. |
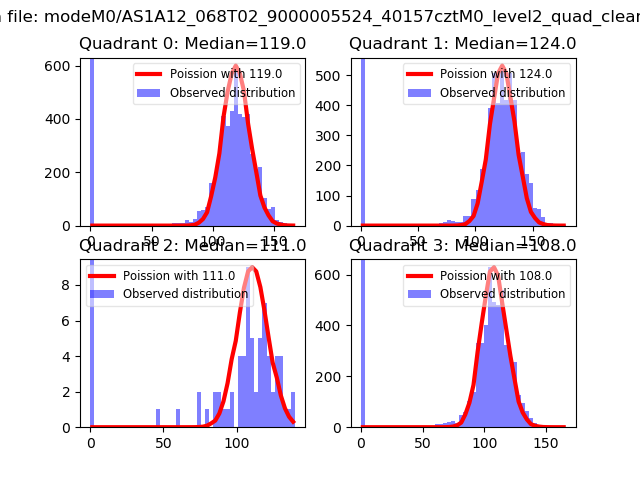 |
 |
| Quadrant-wise count rates Data is divided into 100 sec bins |
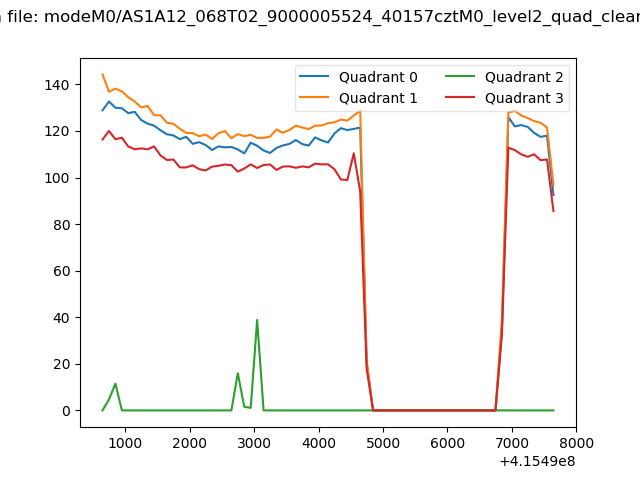 |
|
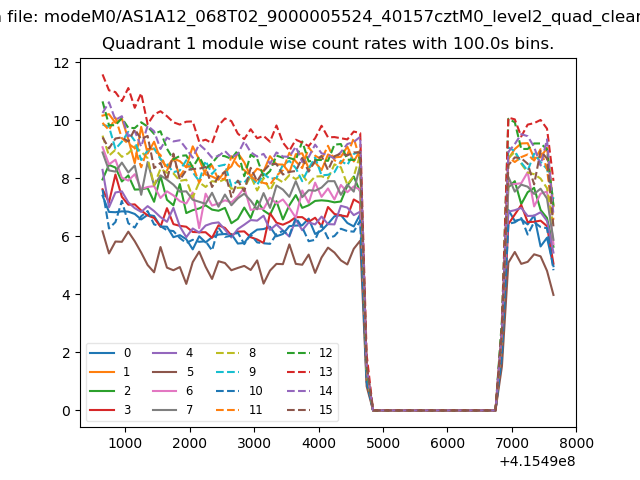
| Module-wise count rates for Quadrant A Data is divided into 100 sec bins |
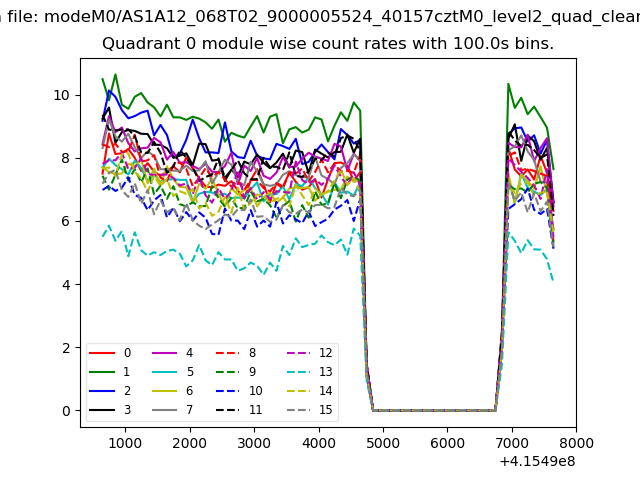 |
 |
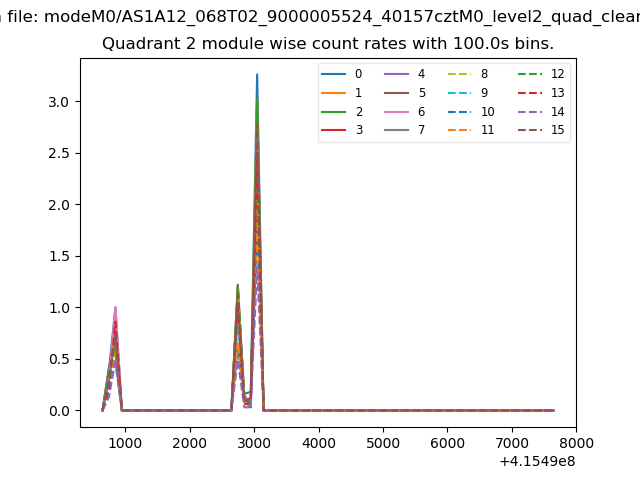
| Module-wise count rates for Quadrant B Data is divided into 100 sec bins |
 |
 |
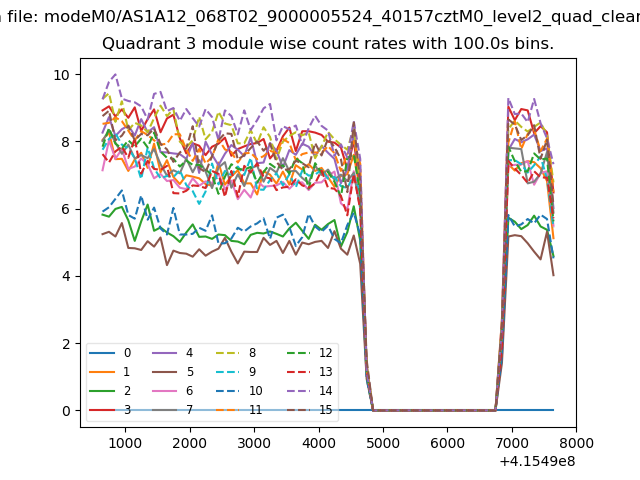
| Module-wise count rates for Quadrant C Data is divided into 100 sec bins |
 |
 |
| Module-wise count rates for Quadrant D Data is divided into 100 sec bins |
 |
 |
| Parameter | Plot |
|---|---|
| CZT HV Monitor |  |
| D_VDD | 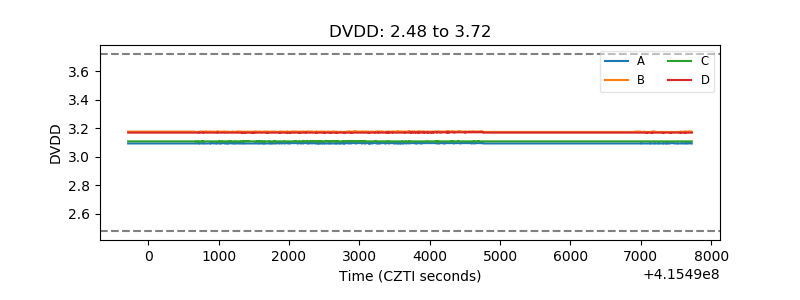 |
| Temperature 1 | 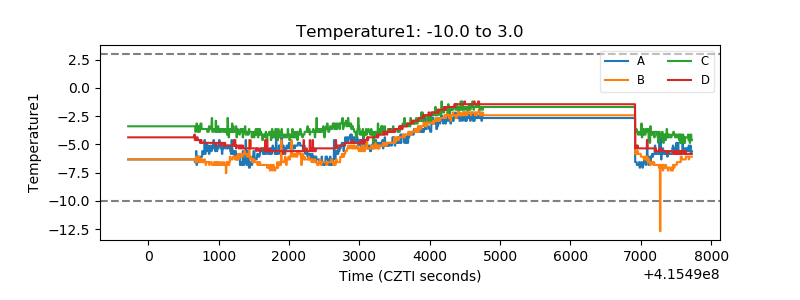 |
| Veto HV Monitor | 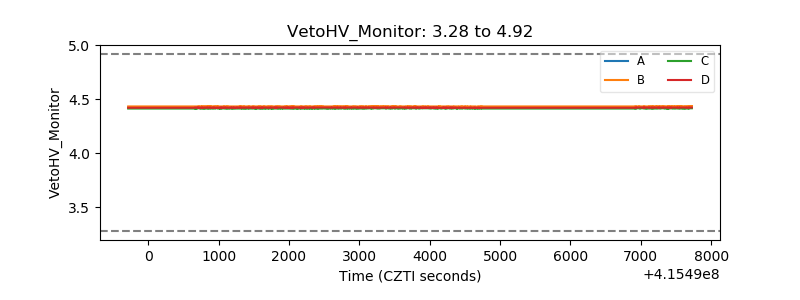 |
| Veto LLD | 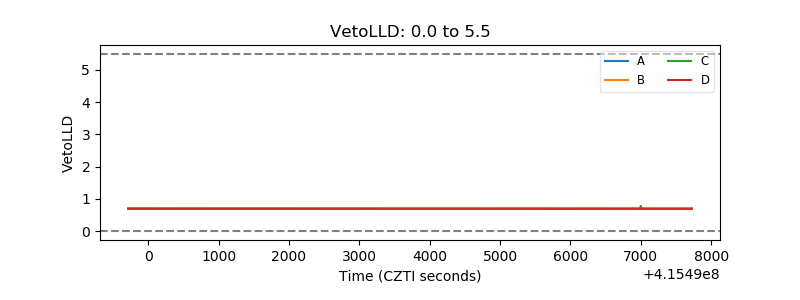 |
| Alpha Counter | 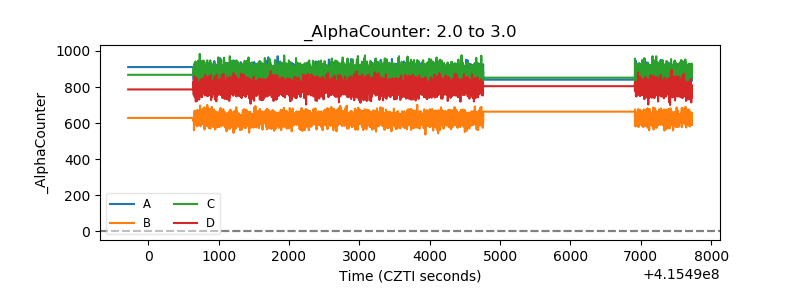 |
| _CPM_Rate | 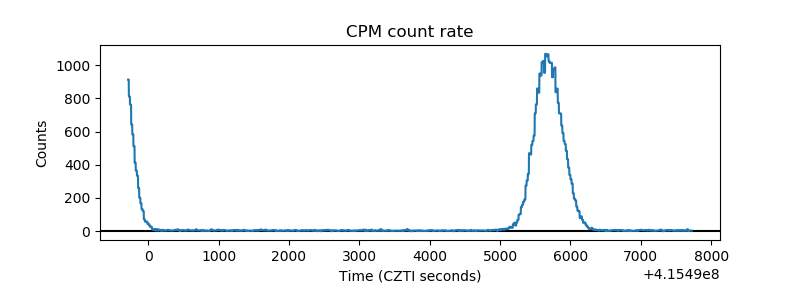 |
| CZT Counter | 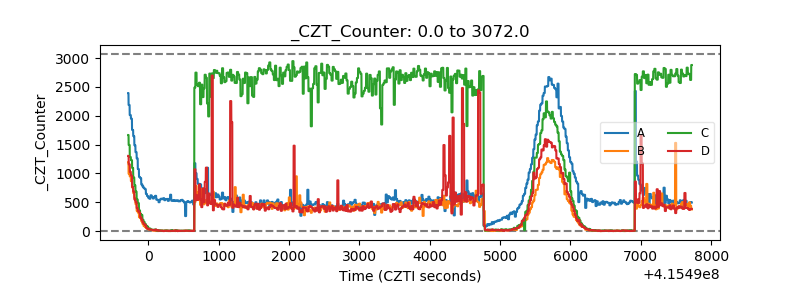 |
| +2.5 Volts monitor | 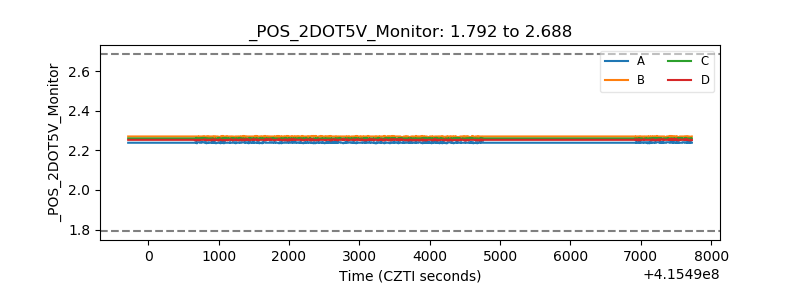 |
| +5 Volts monitor | 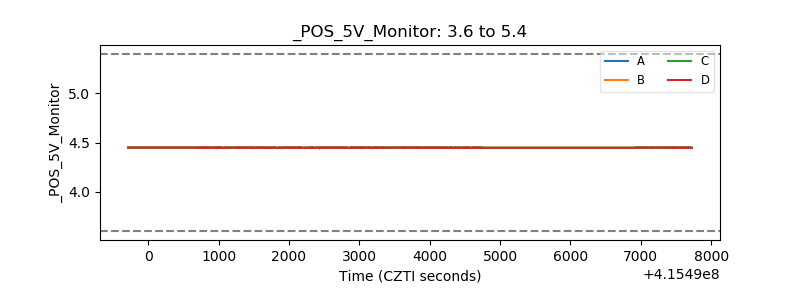 |
| _ROLL_ROT | 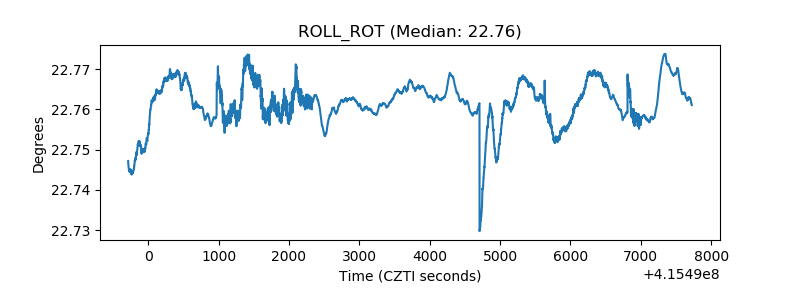 |
| _Roll_DEC | 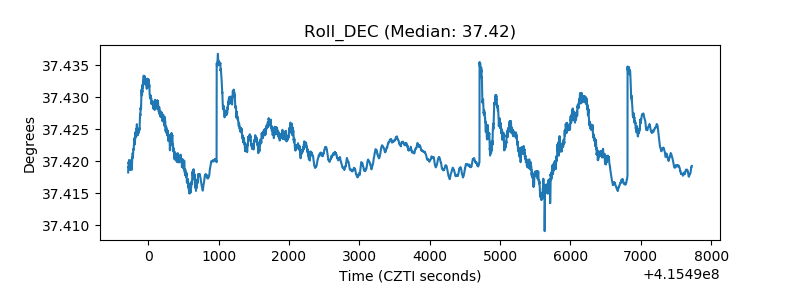 |
| _Roll_RA | 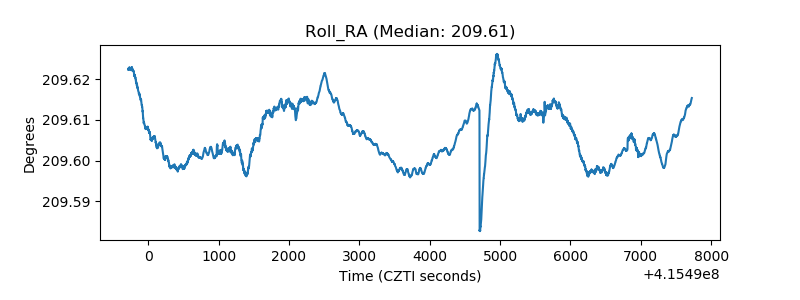 |
| Veto Counter | 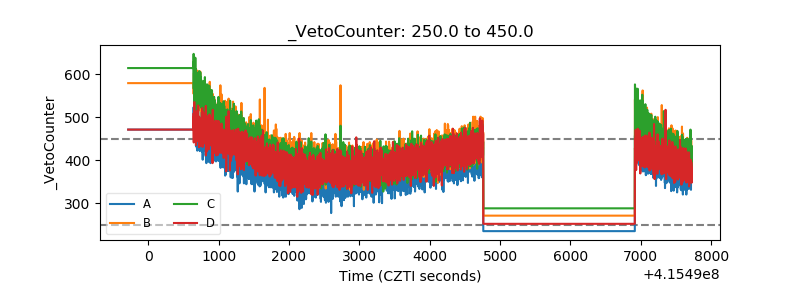 |