| Param | Original file | Final file |
|---|---|---|
| Filename | modeM0/AS1A12_068T02_9000005524_40159cztM0_level2.fits | modeM0/AS1A12_068T02_9000005524_40159cztM0_level2_quad_clean.evt |
| Size (bytes) | 1,327,308,480 | 155,859,840 |
| Size | 1.2 GB | 148.6 MB |
| Events in quadrant A | 6,109,420 | 1,315,971 |
| Events in quadrant B | 5,703,331 | 1,372,439 |
| Events in quadrant C | 30,467,817 | 17,617 |
| Events in quadrant D | 5,925,877 | 1,187,709 |
| Mode M9 | |||
|---|---|---|---|
| Quadrant | BADHDUFLAG | Total packets | Discarded packets |
| A | 0 | 63 | 1 |
| B | 0 | 64 | 2 |
| C | 0 | 63 | 2 |
| D | 0 | 63 | 1 |
| Mode SS | |||
|---|---|---|---|
| Quadrant | BADHDUFLAG | Total packets | Discarded packets |
| A | 0 | 269 | 23 |
| B | 0 | 268 | 16 |
| C | 0 | 268 | 26 |
| D | 0 | 268 | 22 |
| Mode M0 | |||
|---|---|---|---|
| Quadrant | BADHDUFLAG | Total packets | Discarded packets |
| A | 0 | 28105 | 2573 |
| B | 0 | 27742 | 2514 |
| C | 0 | 111995 | 13323 |
| D | 0 | 29297 | 2571 |
| Quadrant | Total seconds | Saturated seconds | Saturation percentage |
|---|---|---|---|
| A | 12038 | 19 | 0.157834% |
| B | 12018 | 64 | 0.532535% |
| C | 11640 | 11506 | 98.848797% |
| D | 12032 | 182 | 1.512633% |
Noise dominated data is calculated using 1-second bins in cleaned event files. If a bin has >2000 counts, and if more than 50% of those come from <1% of pixels, then it is considered to be noise-dominated and hence unusable.
| Quadrant | # 1 sec bins | Bins with >0 counts | Bins with >2000 counts | High rate bins dominated by noise | Noise dominated (total time) | Noise dominated (detector-on time) | Marked lightcurve |
|---|---|---|---|---|---|---|---|
| A | 19385 | 12244 | 5 | 5 | 0.03% | 0.04% | 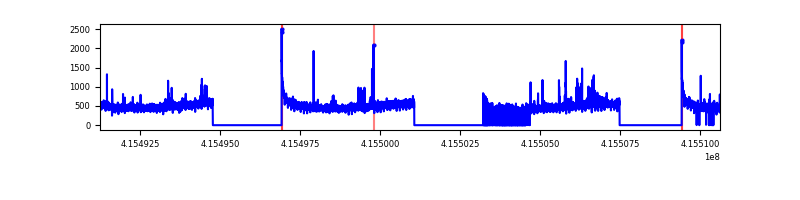 |
| B | 19386 | 12254 | 35 | 35 | 0.18% | 0.29% | 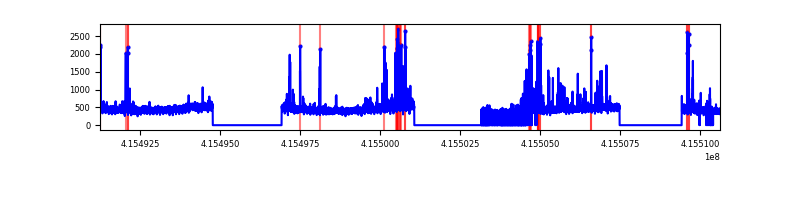 |
| C | 19385 | 11639 | 11453 | 11453 | 59.08% | 98.40% | 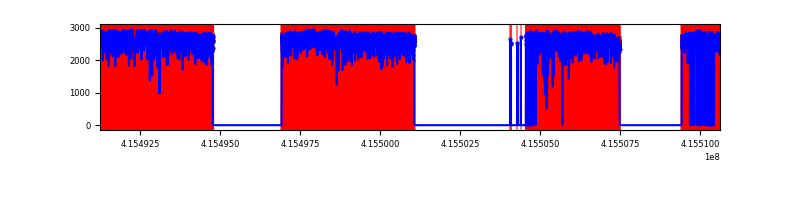 |
| D | 19386 | 12252 | 176 | 176 | 0.91% | 1.44% | 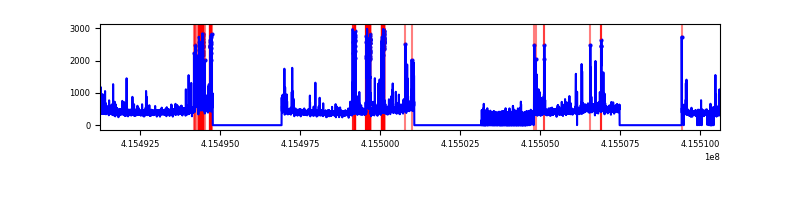 |
Top three noisy pixels from each quadrant. If the there are fewer than three noisy pixels in the level2.evt file, extra rows are filled as -1
| Pixel properties | Quadrant properties | ||||||
|---|---|---|---|---|---|---|---|
| Quadrant | DetID | PixID | Counts | Sigma | Mean | Median | Sigma |
| A | 10 | 83 | 809098 | 3018.56 | 1322 | 1298 | 267.6 |
| A | 6 | 10 | 84765 | 311.9 | 1322 | 1298 | 267.6 |
| A | 2 | 79 | 75475 | 277.18 | 1322 | 1298 | 267.6 |
| B | 4 | 171 | 225706 | 889.25 | 1315 | 1279 | 252.4 |
| B | 5 | 172 | 189702 | 746.59 | 1315 | 1279 | 252.4 |
| B | 0 | 190 | 81912 | 319.49 | 1315 | 1279 | 252.4 |
| C | 9 | 187 | 28597004 | 308165.8 | 403 | 406 | 92.8 |
| C | 15 | 214 | 165535 | 1779.48 | 403 | 406 | 92.8 |
| C | 9 | 203 | 47396 | 506.38 | 403 | 406 | 92.8 |
| D | 12 | 227 | 590206 | 1906.21 | 1276 | 1240 | 309.0 |
| D | 13 | 249 | 138885 | 445.49 | 1276 | 1240 | 309.0 |
| D | 1 | 47 | 90416 | 288.62 | 1276 | 1240 | 309.0 |
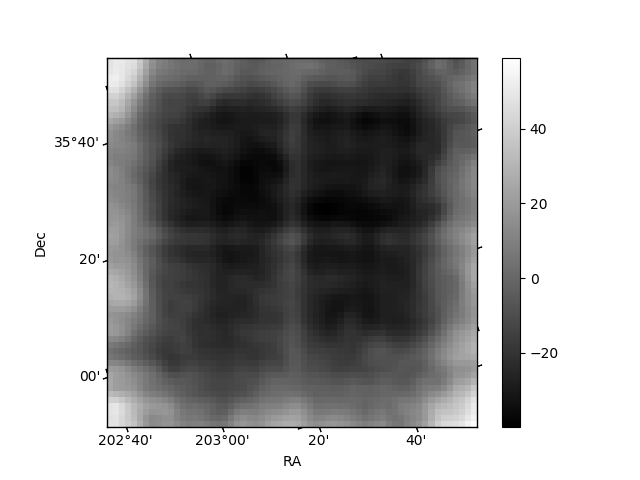
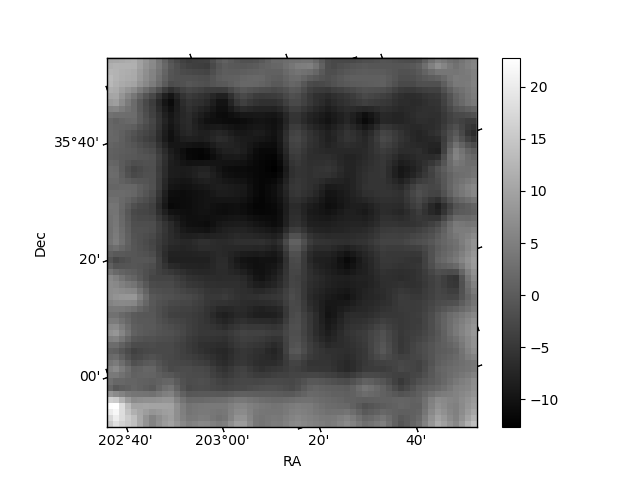
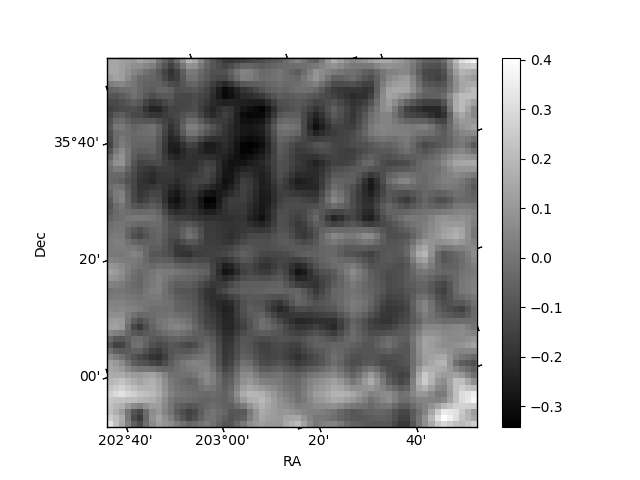
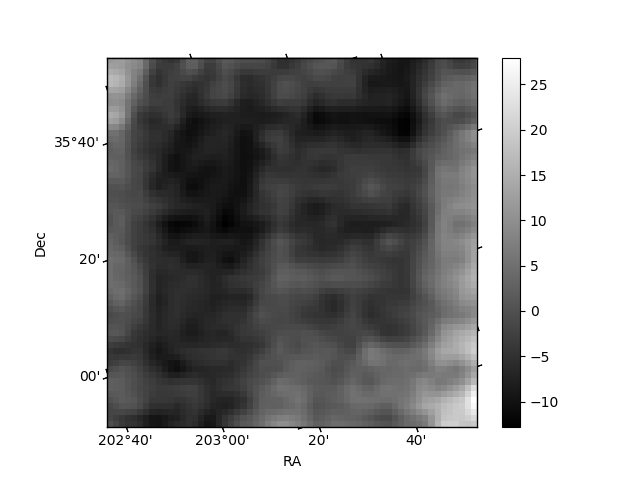
Histogram calculated using DETX and DETY for each event in the final _common_clean file
| Quadrant A | 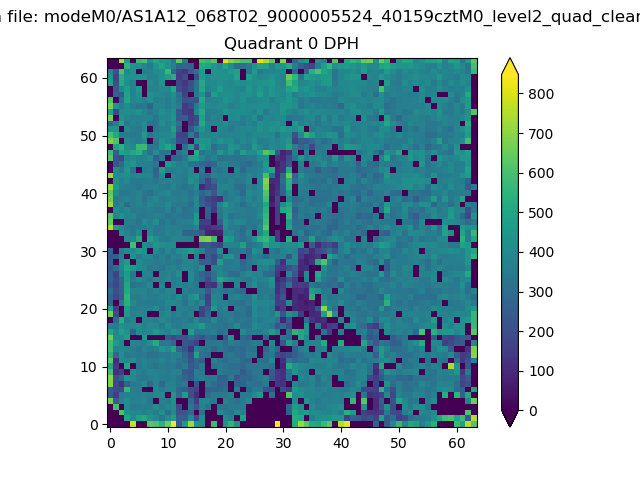 |
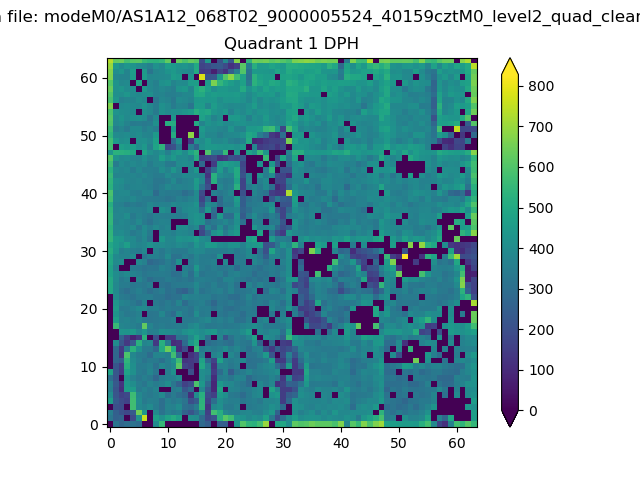 |
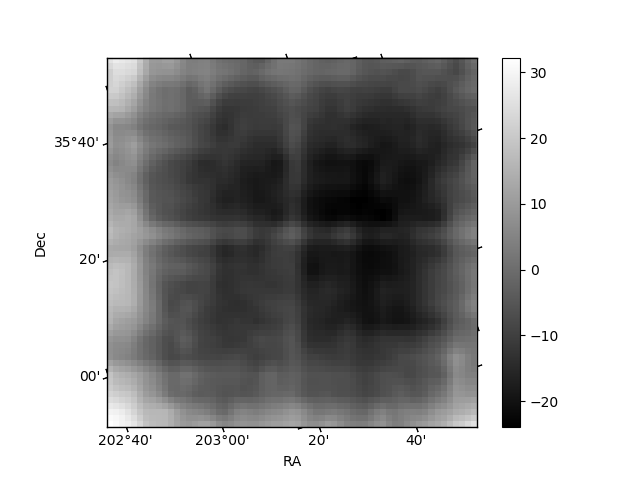
Quadrant B |
|---|---|---|---|
| Quadrant D | 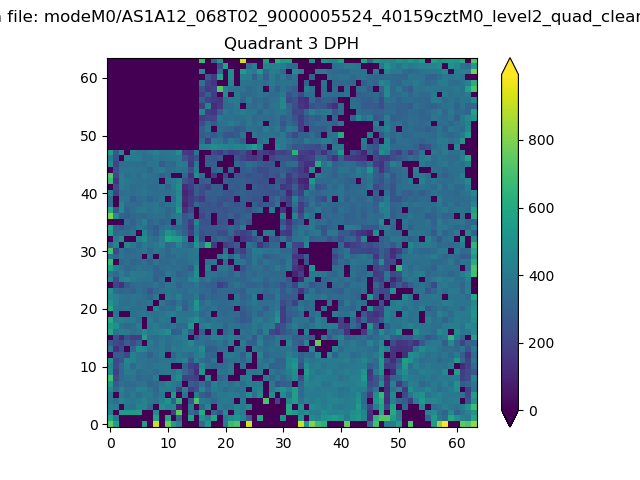 |
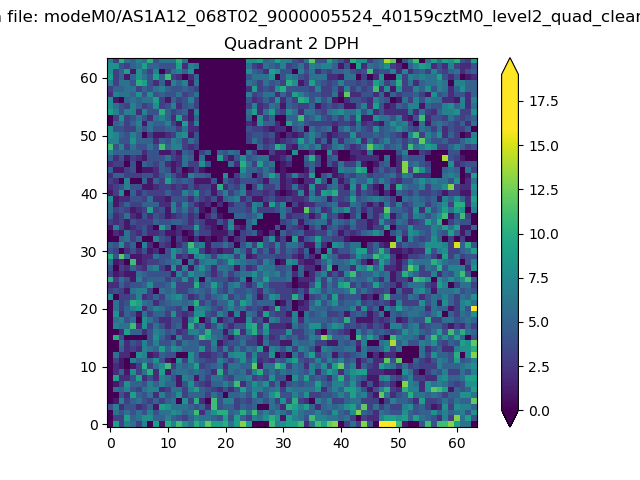 |
Quadrant C |
| Plot type | Count rate plots | Images |
|---|---|---|
| Comparison with Poisson distribution Blue bars denote a histogram of data divided into 1 sec bins. Red curve is a Poisson curve with rate = median count rate of data. |
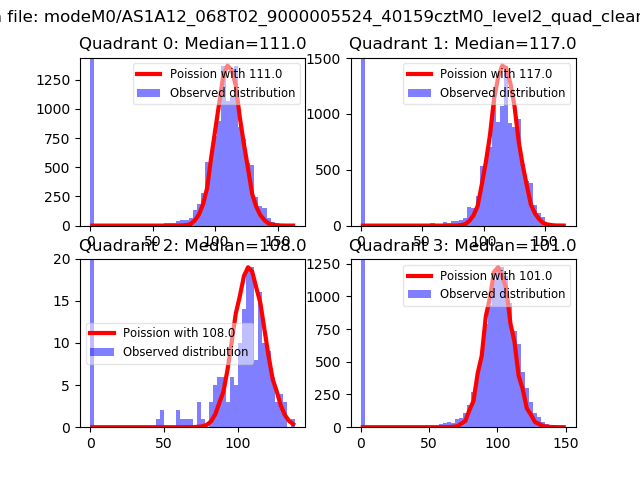 |
 |
| Quadrant-wise count rates Data is divided into 100 sec bins |
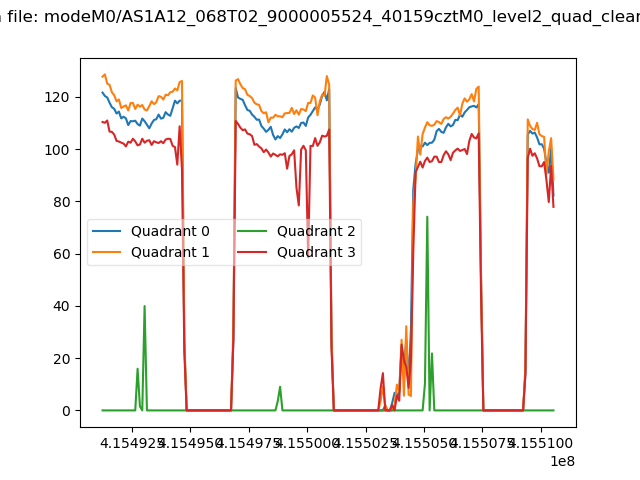 |
|
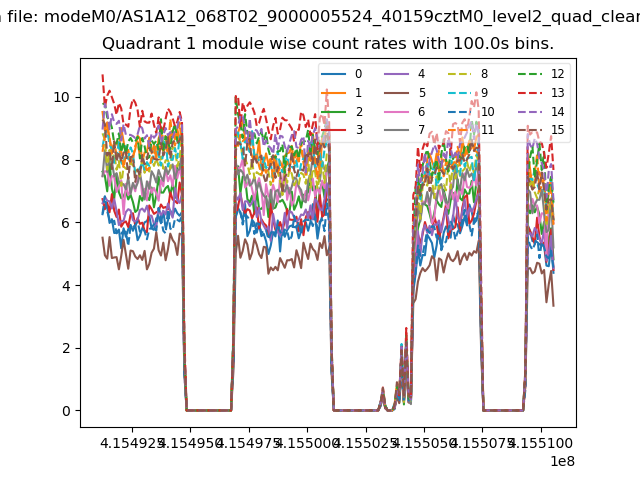
| Module-wise count rates for Quadrant A Data is divided into 100 sec bins |
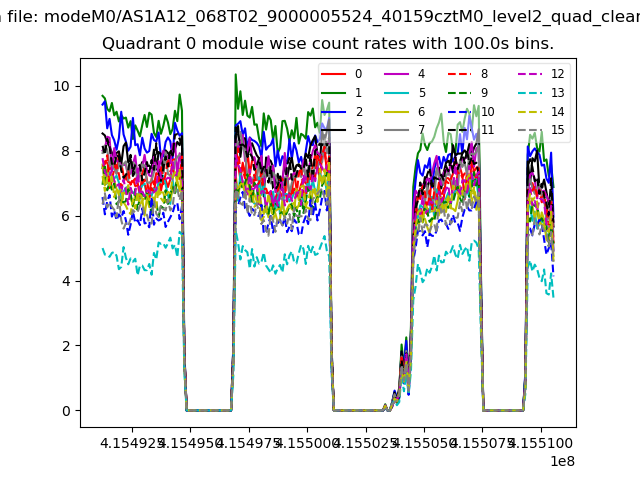 |
 |
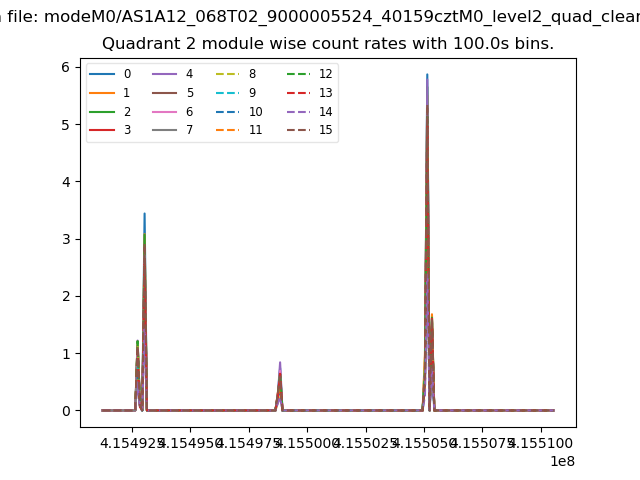
| Module-wise count rates for Quadrant B Data is divided into 100 sec bins |
 |
 |
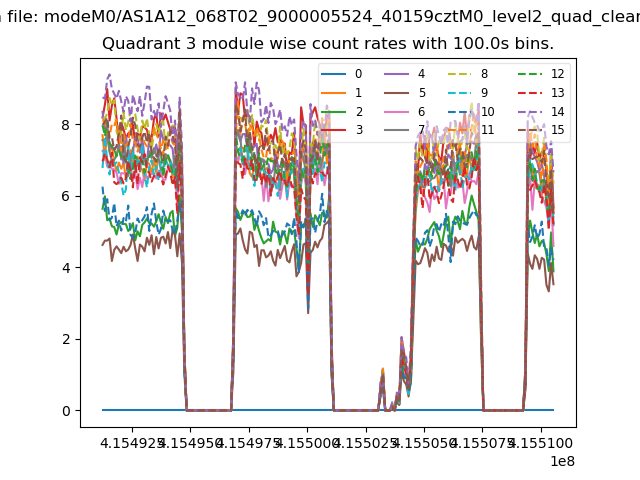
| Module-wise count rates for Quadrant C Data is divided into 100 sec bins |
 |
 |
| Module-wise count rates for Quadrant D Data is divided into 100 sec bins |
 |
 |
| Parameter | Plot |
|---|---|
| CZT HV Monitor |  |
| D_VDD | 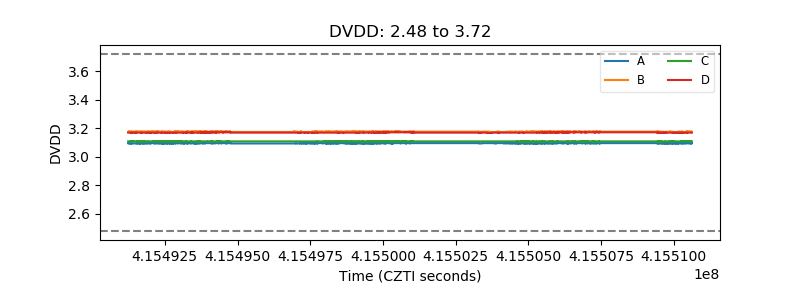 |
| Temperature 1 | 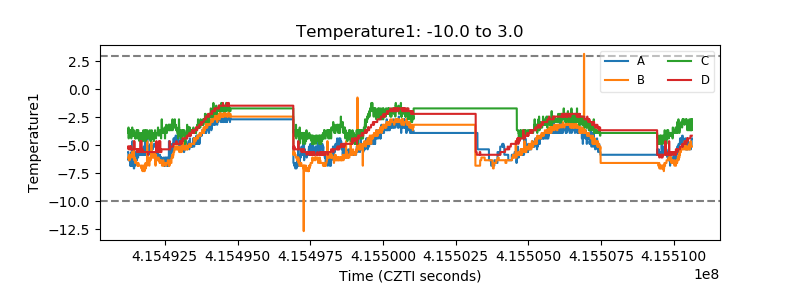 |
| Veto HV Monitor | 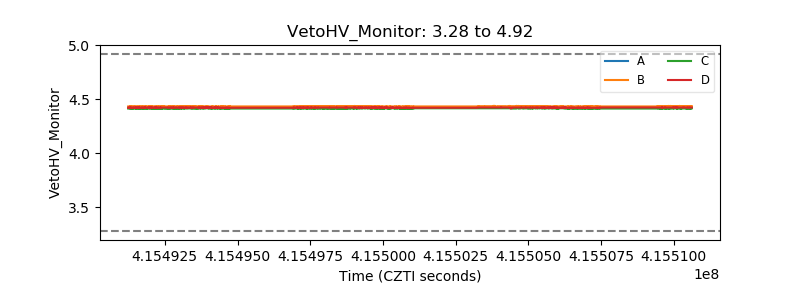 |
| Veto LLD | 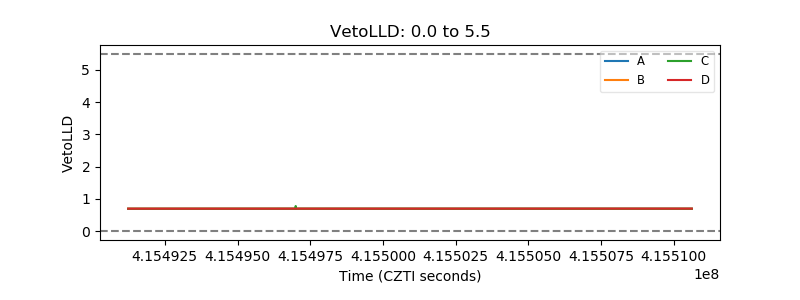 |
| Alpha Counter | 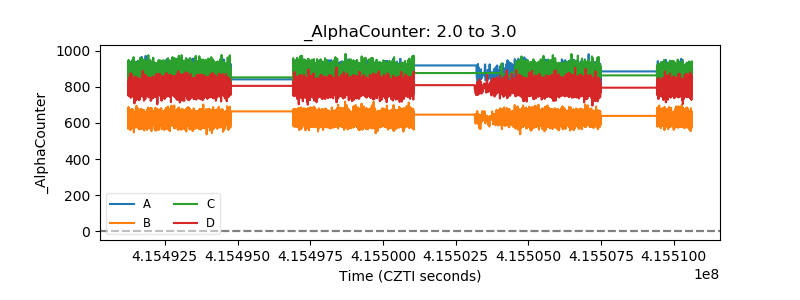 |
| _CPM_Rate | 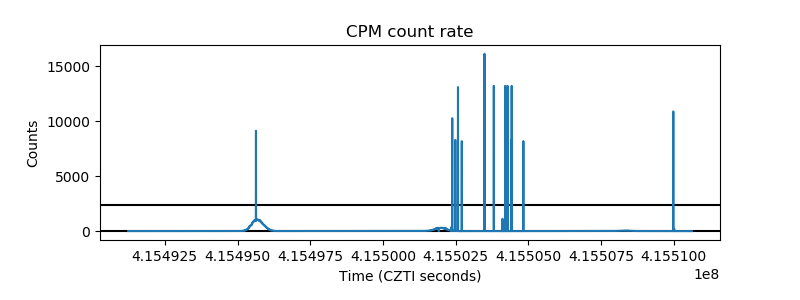 |
| CZT Counter | 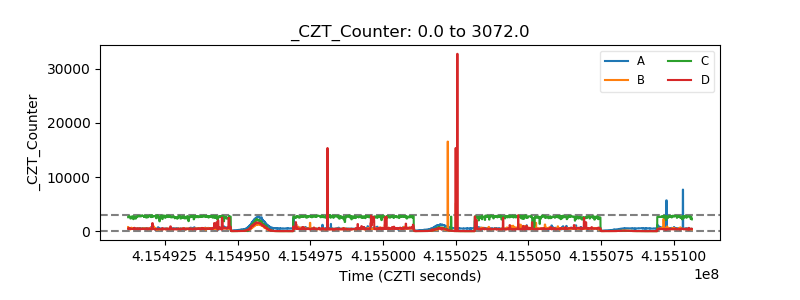 |
| +2.5 Volts monitor | 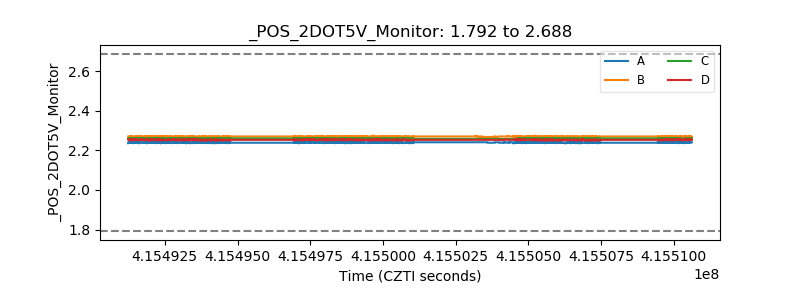 |
| +5 Volts monitor | 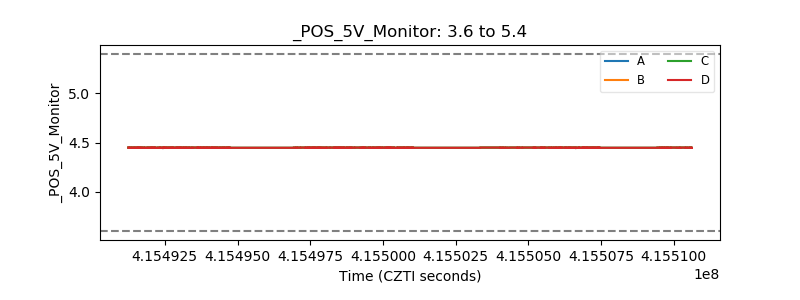 |
| _ROLL_ROT | 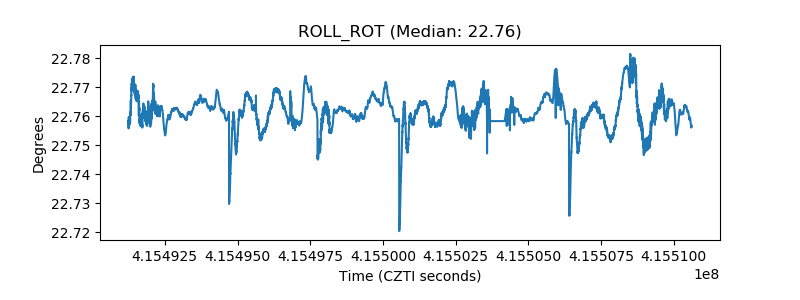 |
| _Roll_DEC | 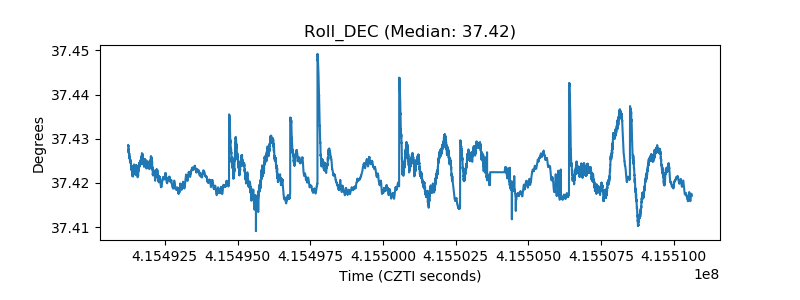 |
| _Roll_RA | 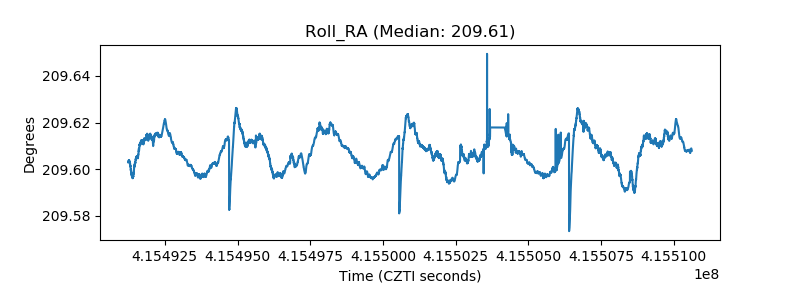 |
| Veto Counter | 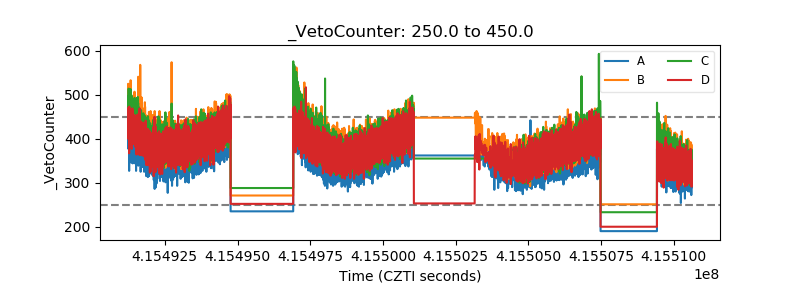 |