| Param | Original file | Final file |
|---|---|---|
| Filename | modeM0/AS1A12_068T02_9000005524_40161cztM0_level2.fits | modeM0/AS1A12_068T02_9000005524_40161cztM0_level2_quad_clean.evt |
| Size (bytes) | 415,247,040 | 45,440,640 |
| Size | 396.0 MB | 43.3 MB |
| Events in quadrant A | 1,777,845 | 386,490 |
| Events in quadrant B | 1,643,844 | 399,865 |
| Events in quadrant C | 9,230,450 | 2,619 |
| Events in quadrant D | 2,434,701 | 330,189 |
| Mode SS | |||
|---|---|---|---|
| Quadrant | BADHDUFLAG | Total packets | Discarded packets |
| A | 0 | 72 | 0 |
| B | 0 | 72 | 0 |
| C | 0 | 72 | 0 |
| D | 0 | 72 | 0 |
| Mode M0 | |||
|---|---|---|---|
| Quadrant | BADHDUFLAG | Total packets | Discarded packets |
| A | 0 | 7367 | 0 |
| B | 0 | 7477 | 0 |
| C | 0 | 29905 | 4 |
| D | 0 | 9855 | 0 |
| Quadrant | Total seconds | Saturated seconds | Saturation percentage |
|---|---|---|---|
| A | 3630 | 2 | 0.055096% |
| B | 3630 | 8 | 0.220386% |
| C | 3629 | 3606 | 99.366217% |
| D | 3630 | 228 | 6.280992% |
Noise dominated data is calculated using 1-second bins in cleaned event files. If a bin has >2000 counts, and if more than 50% of those come from <1% of pixels, then it is considered to be noise-dominated and hence unusable.
| Quadrant | # 1 sec bins | Bins with >0 counts | Bins with >2000 counts | High rate bins dominated by noise | Noise dominated (total time) | Noise dominated (detector-on time) | Marked lightcurve |
|---|---|---|---|---|---|---|---|
| A | 3630 | 3630 | 0 | 0 | 0.00% | 0.00% | 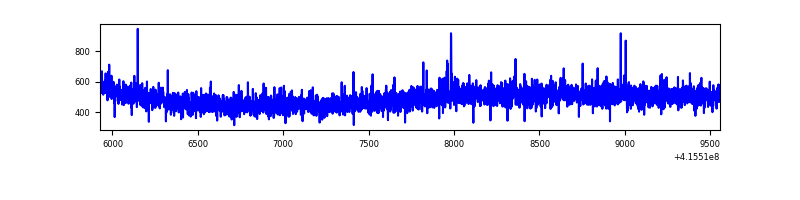 |
| B | 3630 | 3630 | 1 | 1 | 0.03% | 0.03% | 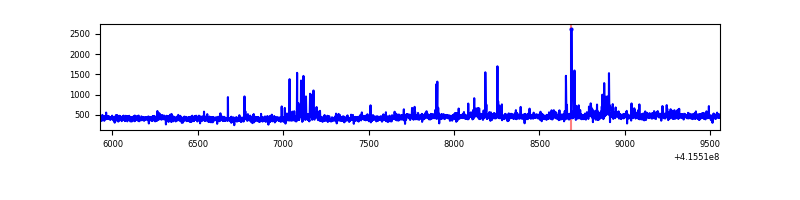 |
| C | 3629 | 3628 | 3539 | 3539 | 97.52% | 97.55% | 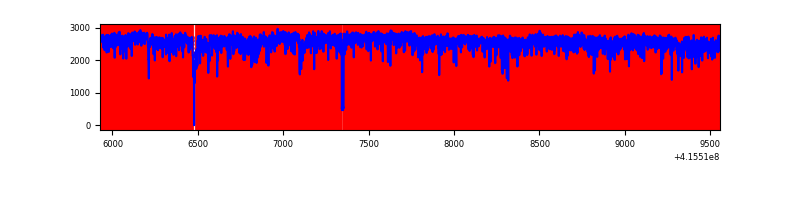 |
| D | 3630 | 3630 | 221 | 221 | 6.09% | 6.09% | 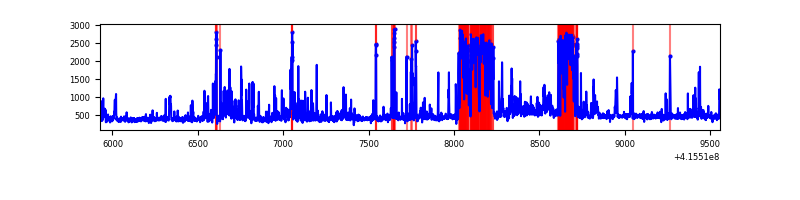 |
Top three noisy pixels from each quadrant. If the there are fewer than three noisy pixels in the level2.evt file, extra rows are filled as -1
| Pixel properties | Quadrant properties | ||||||
|---|---|---|---|---|---|---|---|
| Quadrant | DetID | PixID | Counts | Sigma | Mean | Median | Sigma |
| A | 10 | 83 | 220673 | 2677.3 | 395 | 386 | 82.3 |
| A | 2 | 79 | 13751 | 162.43 | 395 | 386 | 82.3 |
| A | 13 | 6 | 8704 | 101.09 | 395 | 386 | 82.3 |
| B | 4 | 171 | 61568 | 795.37 | 390 | 379 | 76.9 |
| B | 5 | 172 | 26054 | 333.74 | 390 | 379 | 76.9 |
| B | 12 | 111 | 9619 | 120.11 | 390 | 379 | 76.9 |
| C | 9 | 187 | 8575187 | 241499.62 | 147 | 147 | 35.5 |
| C | 15 | 214 | 60164 | 1690.26 | 147 | 147 | 35.5 |
| C | 9 | 203 | 11437 | 317.96 | 147 | 147 | 35.5 |
| D | 12 | 233 | 623183 | 6736.93 | 373 | 361 | 92.4 |
| D | 12 | 0 | 107770 | 1161.82 | 373 | 361 | 92.4 |
| D | 13 | 249 | 85911 | 925.38 | 373 | 361 | 92.4 |
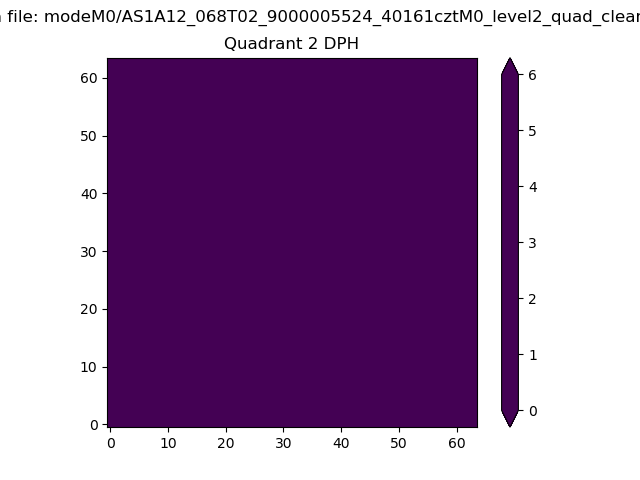
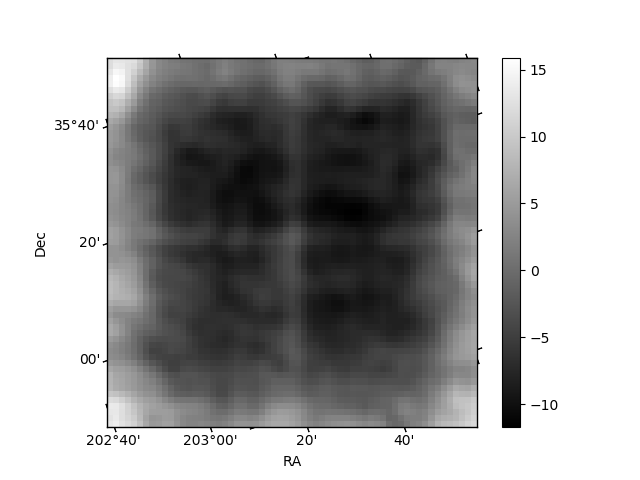
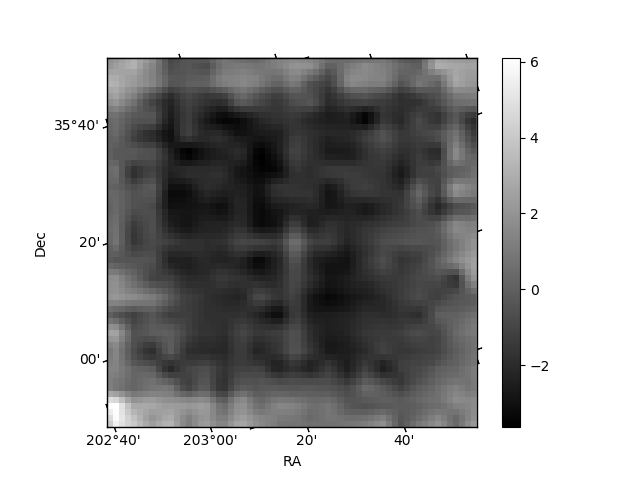
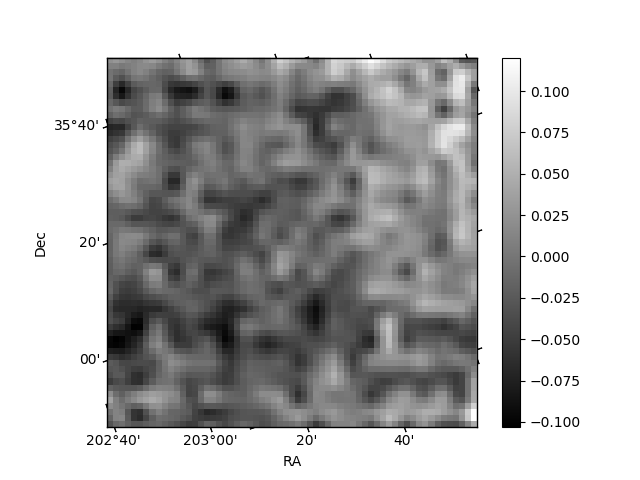
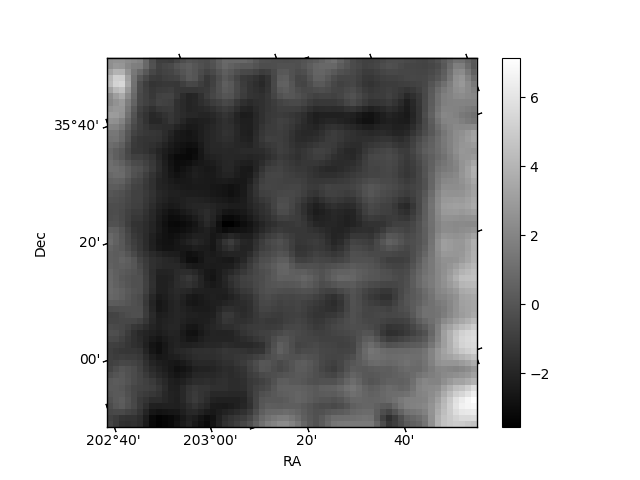
Histogram calculated using DETX and DETY for each event in the final _common_clean file
| Quadrant A | 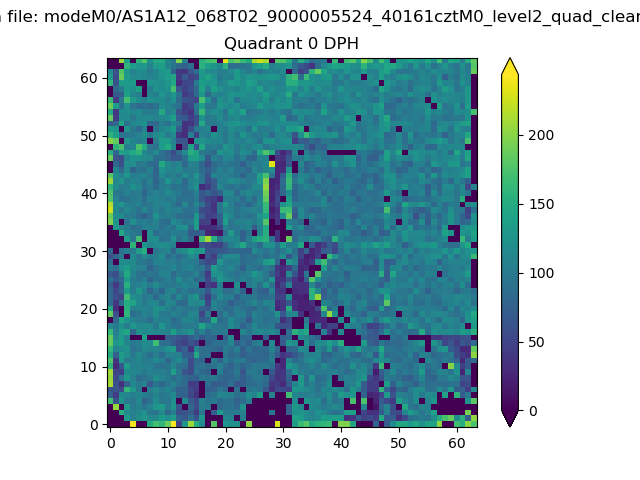 |
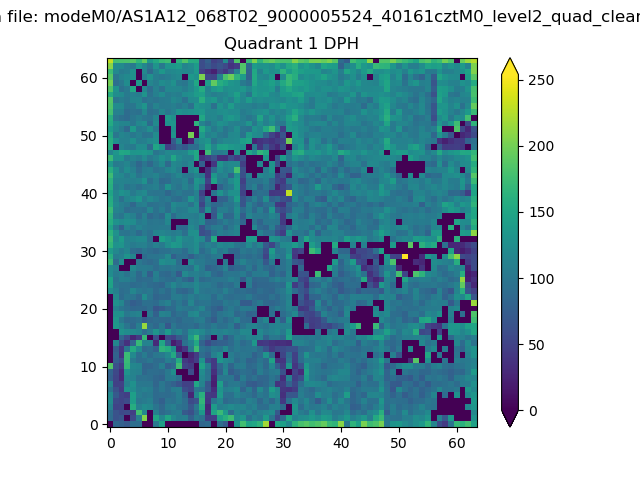 |
Quadrant B |
|---|---|---|---|
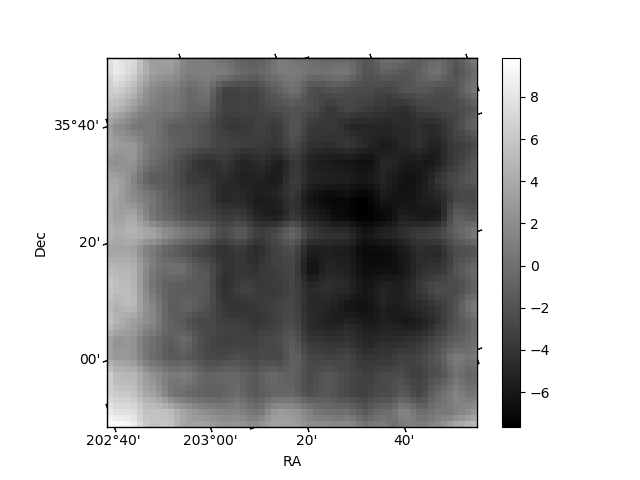
| Quadrant D | 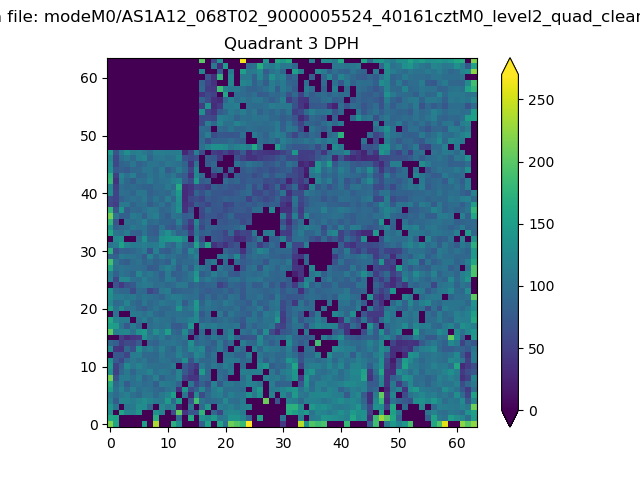 |
 |
Quadrant C |
| Plot type | Count rate plots | Images |
|---|---|---|
| Comparison with Poisson distribution Blue bars denote a histogram of data divided into 1 sec bins. Red curve is a Poisson curve with rate = median count rate of data. |
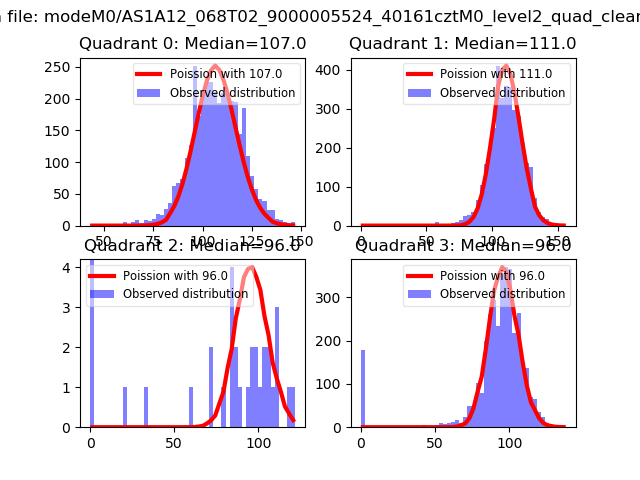 |
 |
| Quadrant-wise count rates Data is divided into 100 sec bins |
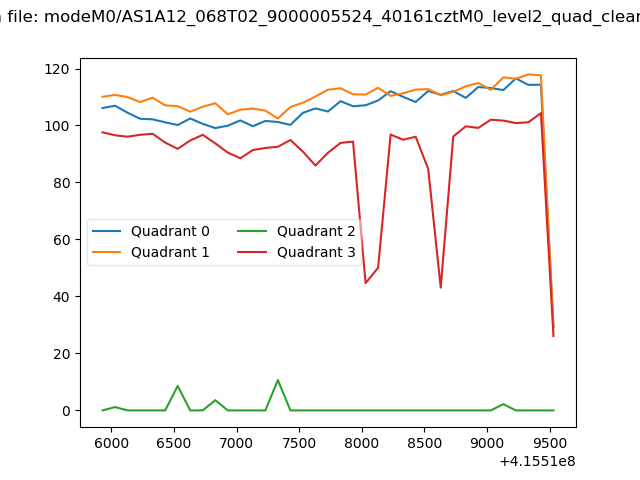 |
|
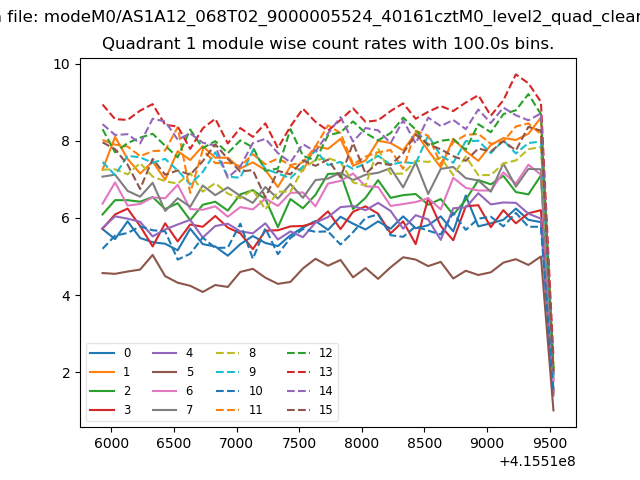
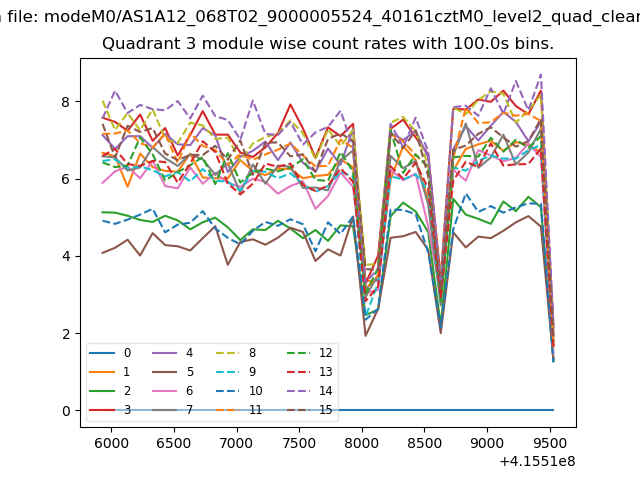
| Module-wise count rates for Quadrant A Data is divided into 100 sec bins |
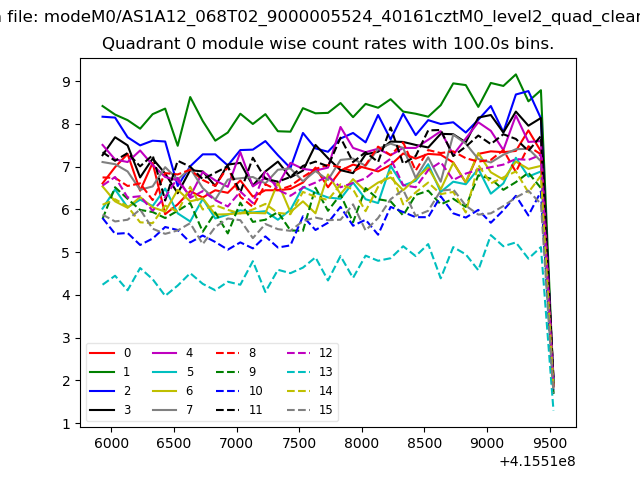 |
 |
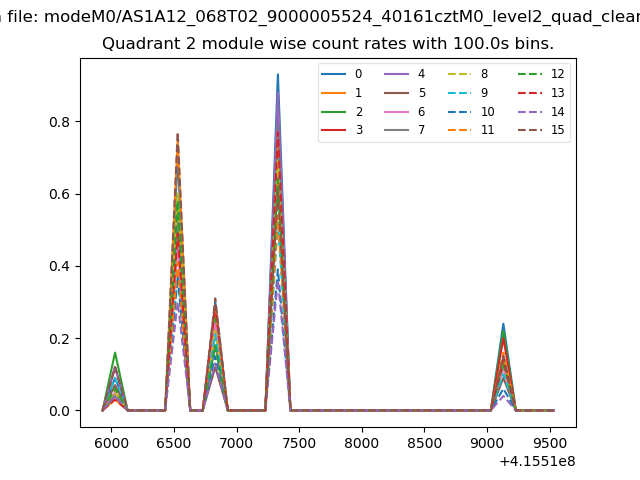
| Module-wise count rates for Quadrant B Data is divided into 100 sec bins |
 |
 |
| Module-wise count rates for Quadrant C Data is divided into 100 sec bins |
 |
 |
| Module-wise count rates for Quadrant D Data is divided into 100 sec bins |
 |
 |
| Parameter | Plot |
|---|---|
| CZT HV Monitor | 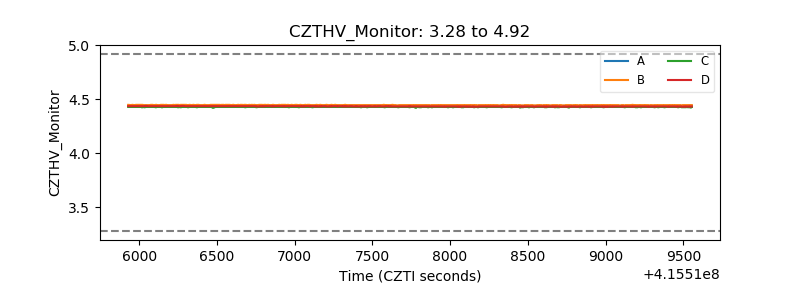 |
| D_VDD | 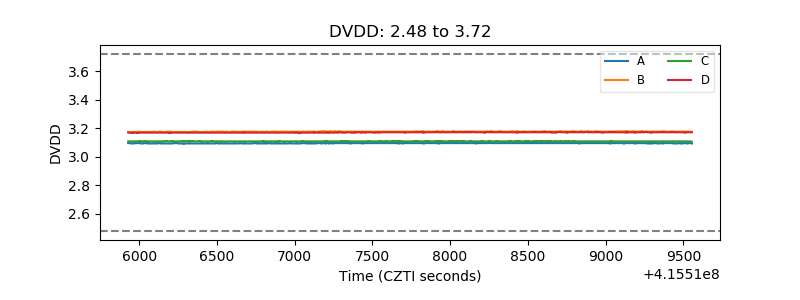 |
| Temperature 1 | 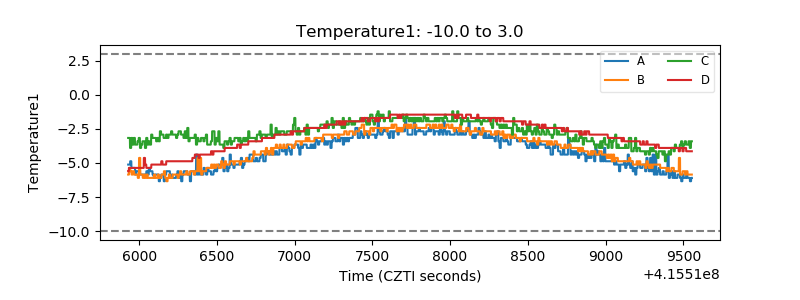 |
| Veto HV Monitor | 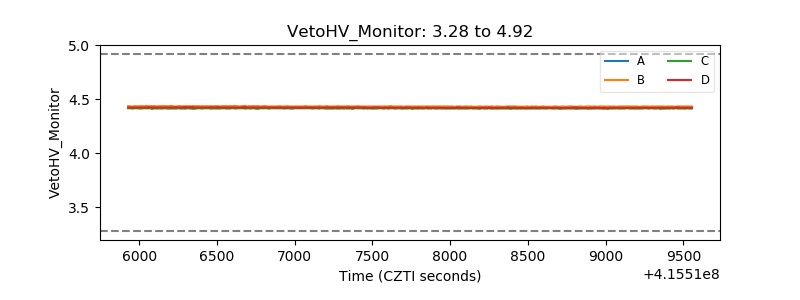 |
| Veto LLD | 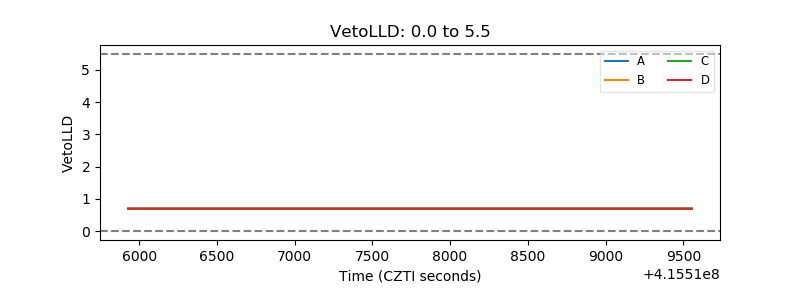 |
| Alpha Counter | 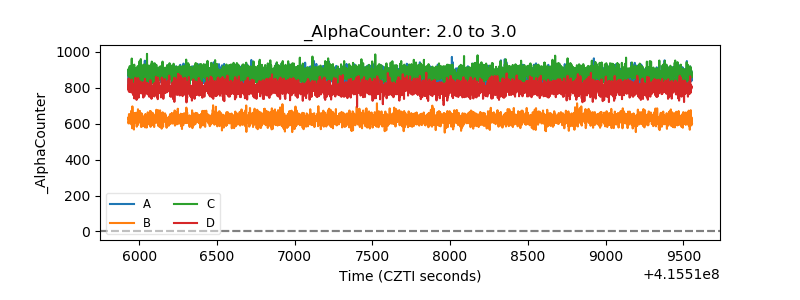 |
| _CPM_Rate |  |
| CZT Counter | 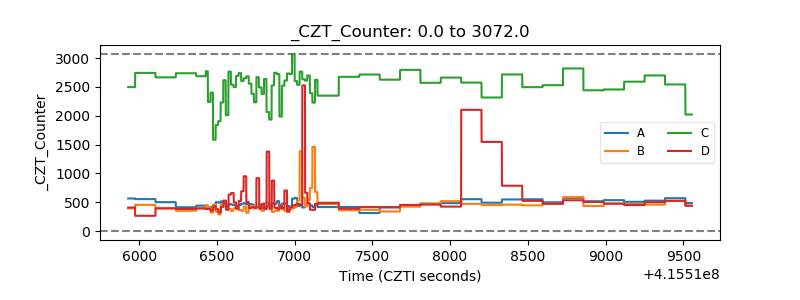 |
| +2.5 Volts monitor | 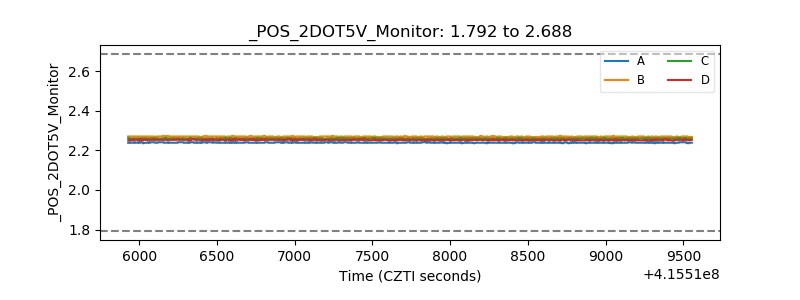 |
| +5 Volts monitor | 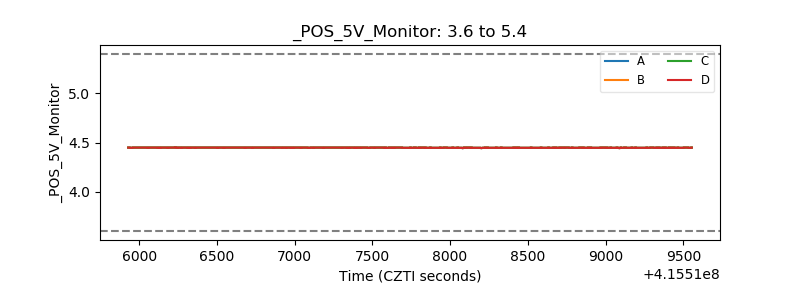 |
| _ROLL_ROT | 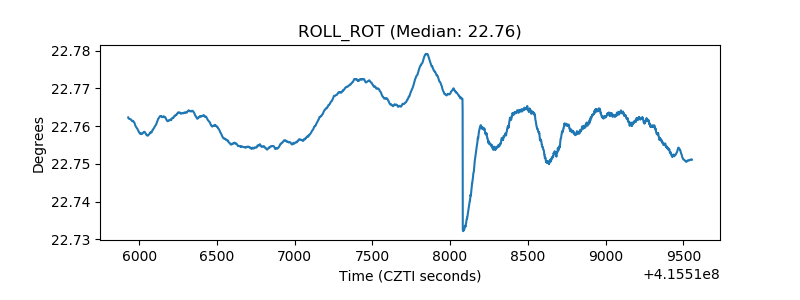 |
| _Roll_DEC | 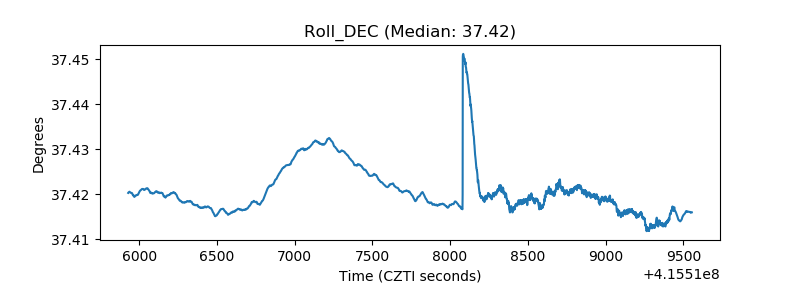 |
| _Roll_RA | 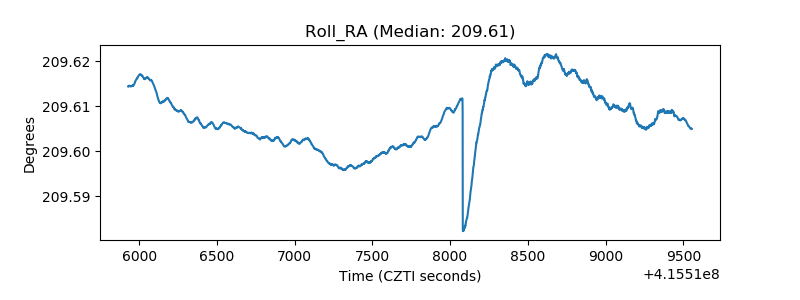 |
| Veto Counter | 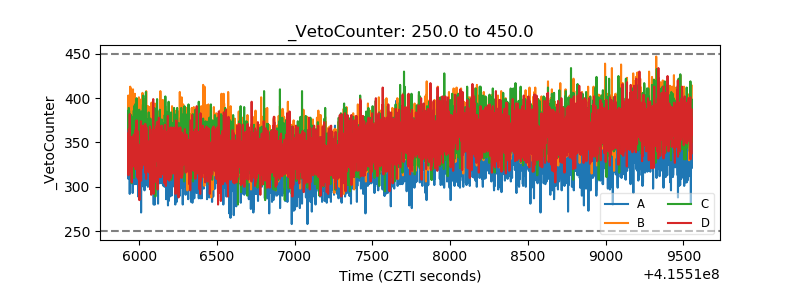 |