| Param | Original file | Final file |
|---|---|---|
| Filename | modeM0/AS1A12_068T02_9000005524_40166cztM0_level2.fits | modeM0/AS1A12_068T02_9000005524_40166cztM0_level2_quad_clean.evt |
| Size (bytes) | 882,567,360 | 99,262,080 |
| Size | 841.7 MB | 94.7 MB |
| Events in quadrant A | 3,925,956 | 838,667 |
| Events in quadrant B | 3,582,786 | 867,635 |
| Events in quadrant C | 19,944,883 | 15,154 |
| Events in quadrant D | 4,605,336 | 738,093 |
| Mode M9 | |||
|---|---|---|---|
| Quadrant | BADHDUFLAG | Total packets | Discarded packets |
| A | 0 | 16 | 0 |
| B | 0 | 16 | 0 |
| C | 0 | 16 | 0 |
| D | 0 | 16 | 0 |
| Mode SS | |||
|---|---|---|---|
| Quadrant | BADHDUFLAG | Total packets | Discarded packets |
| A | 0 | 158 | 0 |
| B | 0 | 158 | 0 |
| C | 0 | 158 | 0 |
| D | 0 | 158 | 0 |
| Mode M0 | |||
|---|---|---|---|
| Quadrant | BADHDUFLAG | Total packets | Discarded packets |
| A | 0 | 16231 | 1 |
| B | 0 | 16162 | 1 |
| C | 0 | 64662 | 1 |
| D | 0 | 19288 | 1 |
| Quadrant | Total seconds | Saturated seconds | Saturation percentage |
|---|---|---|---|
| A | 7855 | 6 | 0.076384% |
| B | 7855 | 17 | 0.216423% |
| C | 7855 | 7747 | 98.625080% |
| D | 7855 | 259 | 3.297263% |
Noise dominated data is calculated using 1-second bins in cleaned event files. If a bin has >2000 counts, and if more than 50% of those come from <1% of pixels, then it is considered to be noise-dominated and hence unusable.
| Quadrant | # 1 sec bins | Bins with >0 counts | Bins with >2000 counts | High rate bins dominated by noise | Noise dominated (total time) | Noise dominated (detector-on time) | Marked lightcurve |
|---|---|---|---|---|---|---|---|
| A | 9439 | 7855 | 2 | 2 | 0.02% | 0.03% |  |
| B | 9439 | 7855 | 5 | 5 | 0.05% | 0.06% |  |
| C | 9438 | 7854 | 7643 | 7643 | 80.98% | 97.31% | 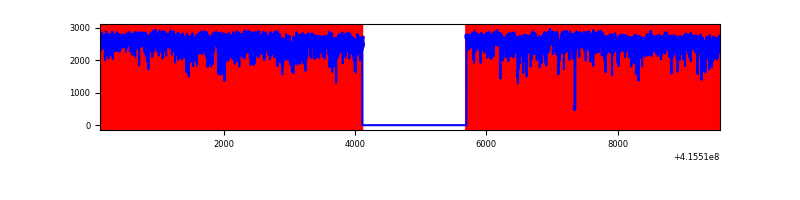 |
| D | 9439 | 7856 | 256 | 256 | 2.71% | 3.26% | 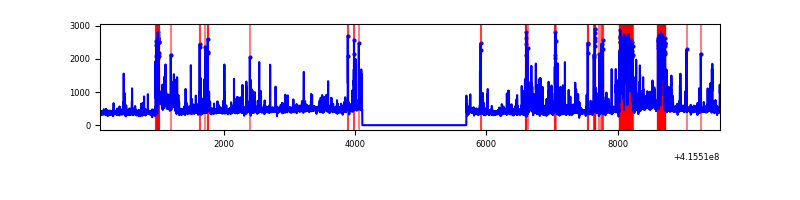 |
Top three noisy pixels from each quadrant. If the there are fewer than three noisy pixels in the level2.evt file, extra rows are filled as -1
| Pixel properties | Quadrant properties | ||||||
|---|---|---|---|---|---|---|---|
| Quadrant | DetID | PixID | Counts | Sigma | Mean | Median | Sigma |
| A | 10 | 83 | 514998 | 2915.76 | 863 | 843 | 176.3 |
| A | 2 | 79 | 44429 | 247.18 | 863 | 843 | 176.3 |
| A | 13 | 6 | 18583 | 100.6 | 863 | 843 | 176.3 |
| B | 4 | 171 | 83438 | 503.4 | 852 | 827 | 164.1 |
| B | 5 | 172 | 81175 | 489.61 | 852 | 827 | 164.1 |
| B | 0 | 230 | 21728 | 127.36 | 852 | 827 | 164.1 |
| C | 9 | 187 | 18410386 | 226726.41 | 348 | 349 | 81.2 |
| C | 15 | 214 | 138262 | 1698.45 | 348 | 349 | 81.2 |
| C | 9 | 203 | 20479 | 247.91 | 348 | 349 | 81.2 |
| D | 12 | 233 | 634689 | 3132.64 | 828 | 802 | 202.3 |
| D | 12 | 0 | 296803 | 1462.82 | 828 | 802 | 202.3 |
| D | 13 | 249 | 159892 | 786.22 | 828 | 802 | 202.3 |
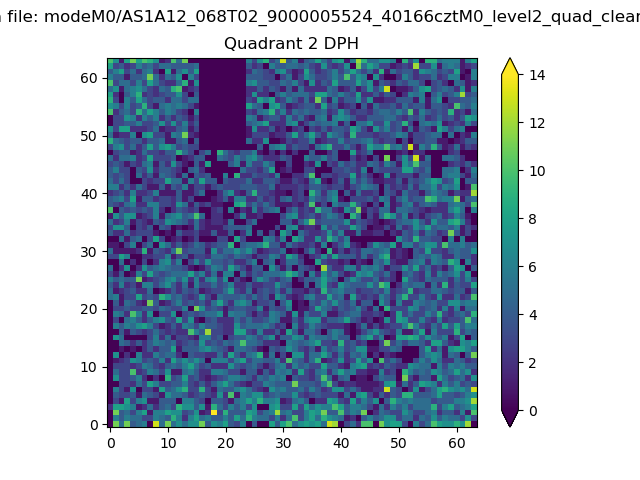
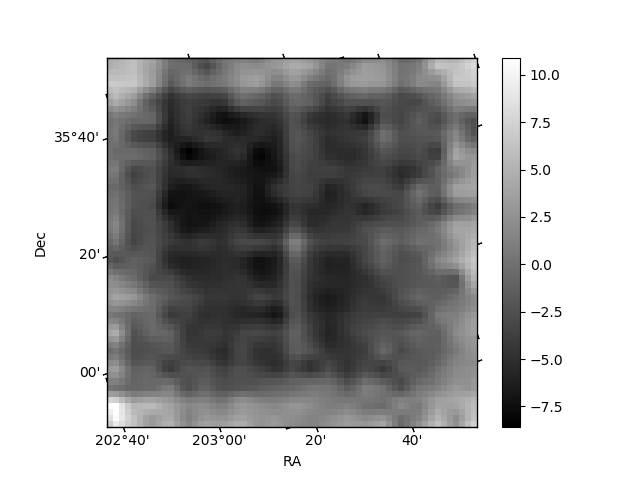
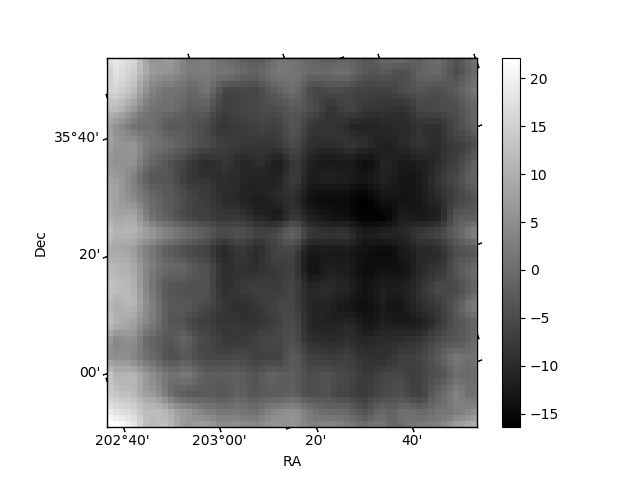
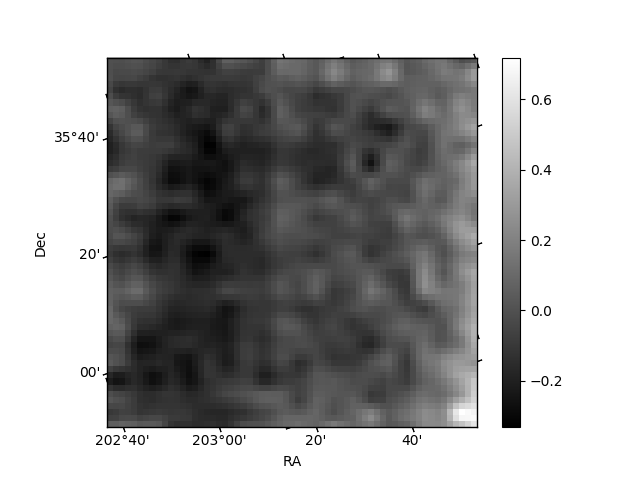
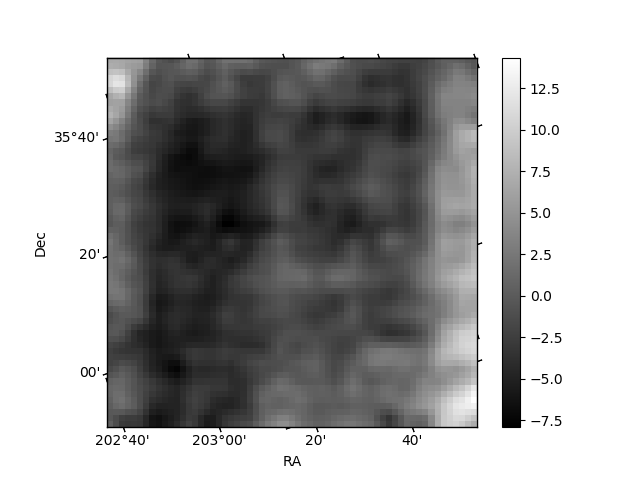
Histogram calculated using DETX and DETY for each event in the final _common_clean file
| Quadrant A | 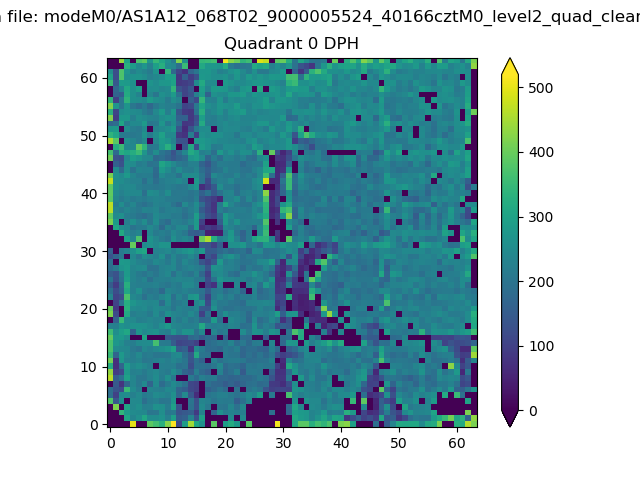 |
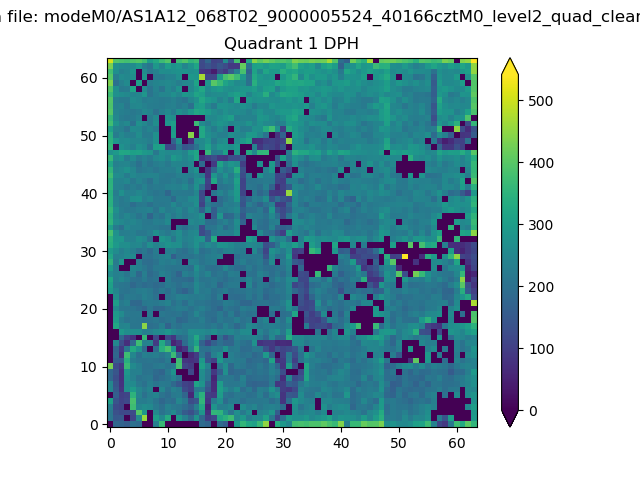 |
Quadrant B |
|---|---|---|---|
| Quadrant D | 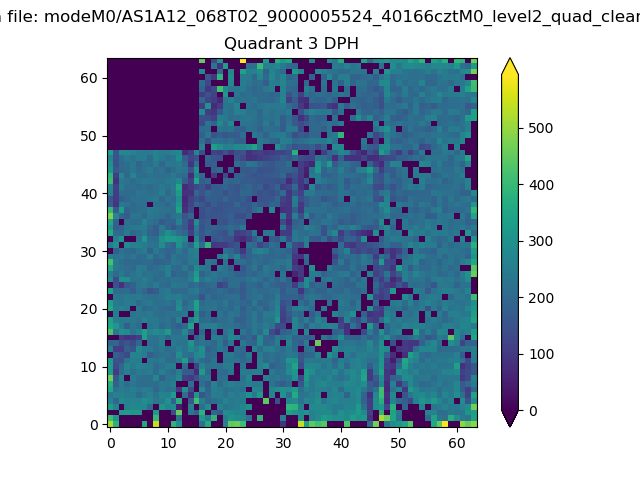 |
 |
Quadrant C |
| Plot type | Count rate plots | Images |
|---|---|---|
| Comparison with Poisson distribution Blue bars denote a histogram of data divided into 1 sec bins. Red curve is a Poisson curve with rate = median count rate of data. |
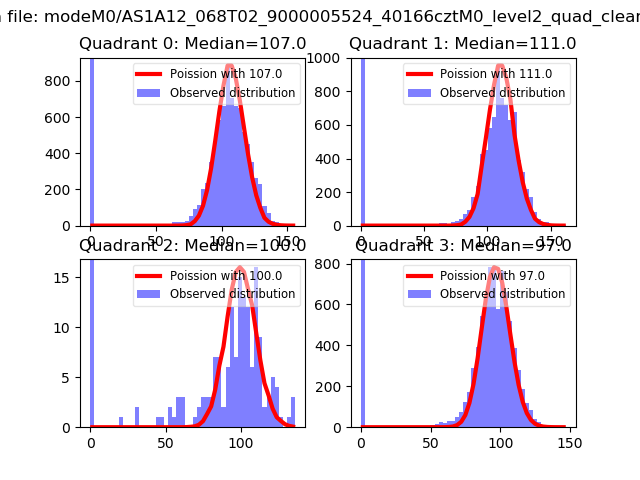 |
 |
| Quadrant-wise count rates Data is divided into 100 sec bins |
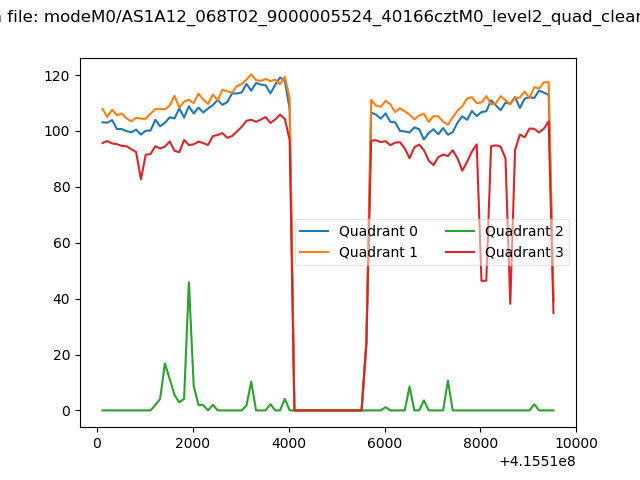 |
|
| Module-wise count rates for Quadrant A Data is divided into 100 sec bins |
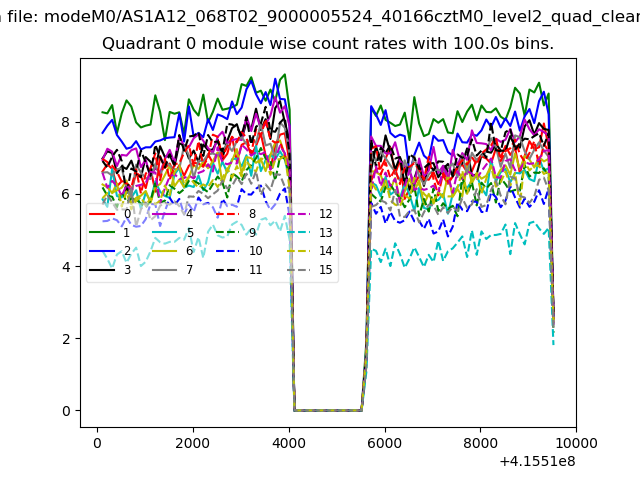 |
 |
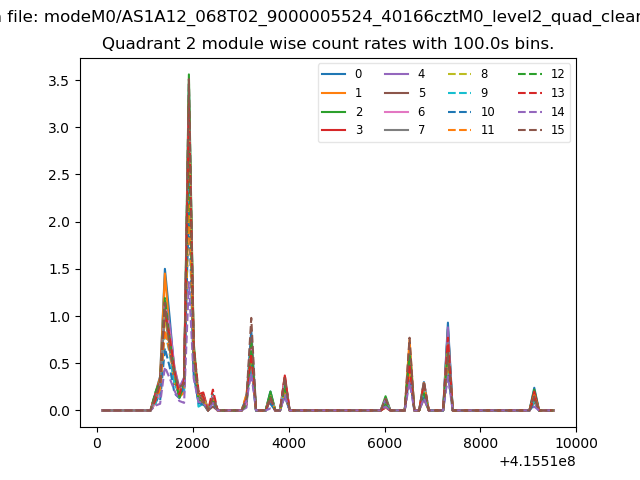
| Module-wise count rates for Quadrant B Data is divided into 100 sec bins |
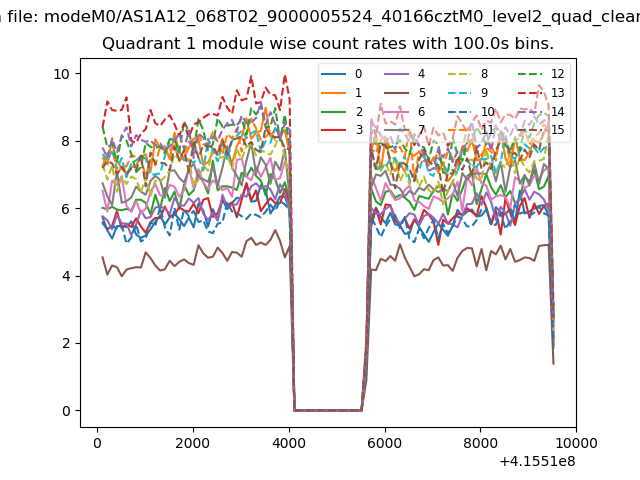 |
 |
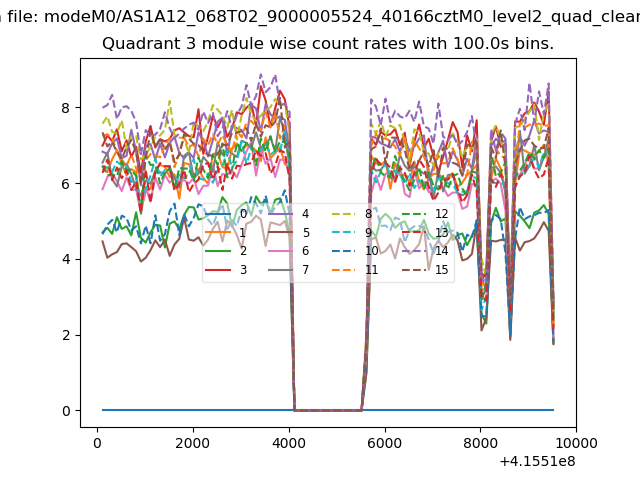
| Module-wise count rates for Quadrant C Data is divided into 100 sec bins |
 |
 |
| Module-wise count rates for Quadrant D Data is divided into 100 sec bins |
 |
 |
| Parameter | Plot |
|---|---|
| CZT HV Monitor | 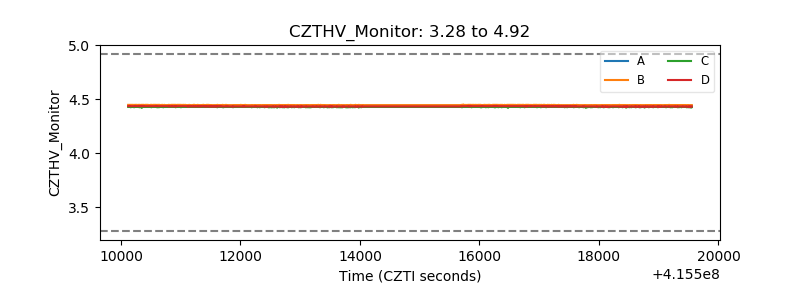 |
| D_VDD | 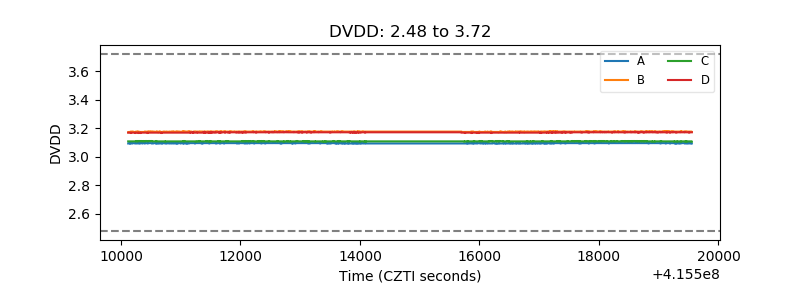 |
| Temperature 1 | 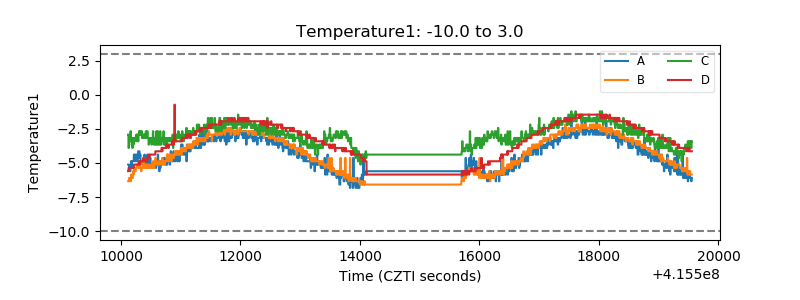 |
| Veto HV Monitor |  |
| Veto LLD | 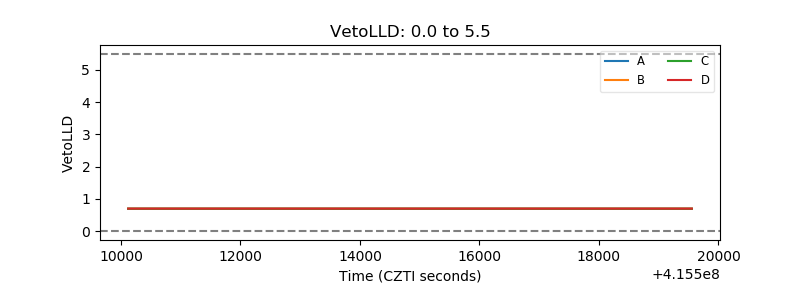 |
| Alpha Counter | 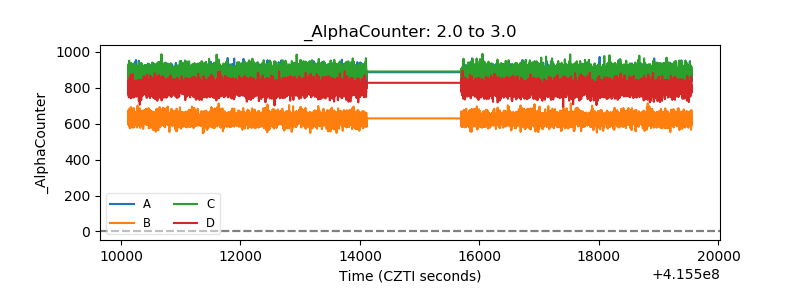 |
| _CPM_Rate | 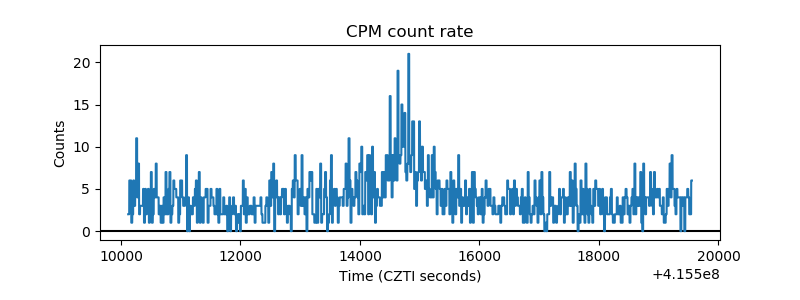 |
| CZT Counter | 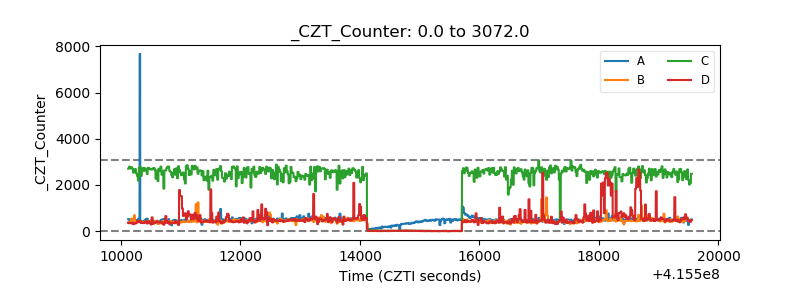 |
| +2.5 Volts monitor | 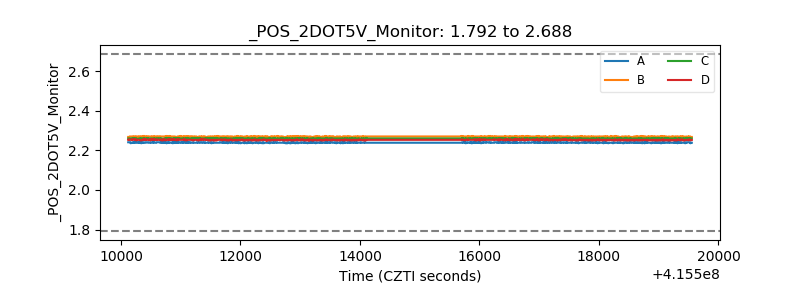 |
| +5 Volts monitor | 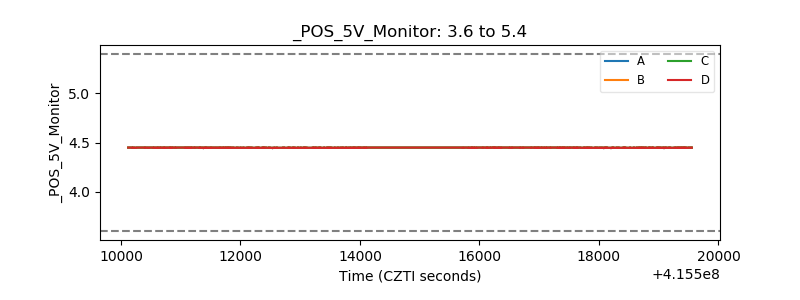 |
| _ROLL_ROT | 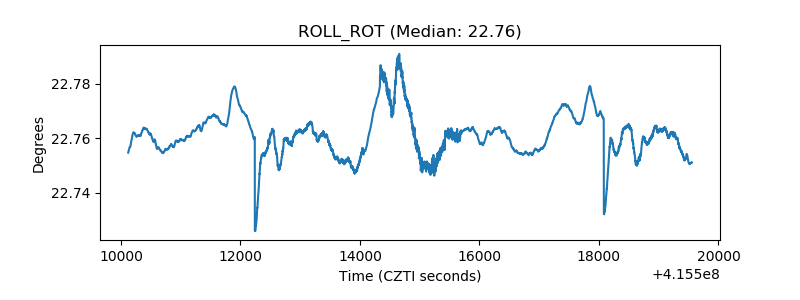 |
| _Roll_DEC | 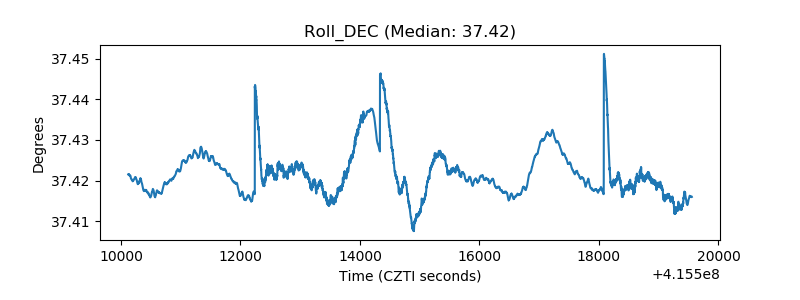 |
| _Roll_RA | 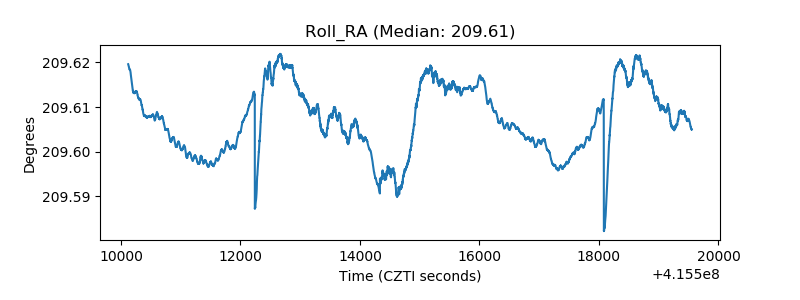 |
| Veto Counter | 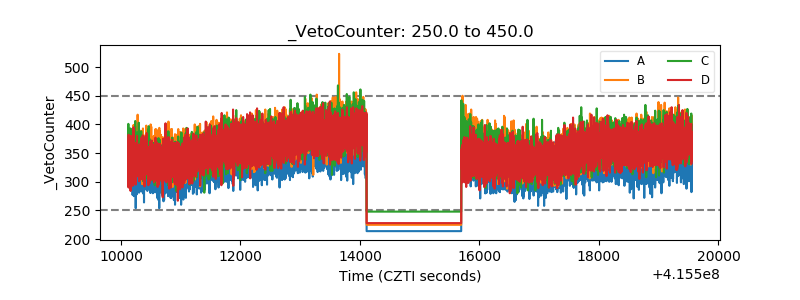 |