| Param | Original file | Final file |
|---|---|---|
| Filename | modeM0/AS1A12_032T04_9000005528_40172cztM0_level2.fits | modeM0/AS1A12_032T04_9000005528_40172cztM0_level2_quad_clean.evt |
| Size (bytes) | 395,231,040 | 61,761,600 |
| Size | 376.9 MB | 58.9 MB |
| Events in quadrant A | 2,022,608 | 471,156 |
| Events in quadrant B | 1,906,510 | 487,723 |
| Events in quadrant C | 7,400,285 | 240,584 |
| Events in quadrant D | 2,991,926 | 391,674 |
| Mode SS | |||
|---|---|---|---|
| Quadrant | BADHDUFLAG | Total packets | Discarded packets |
| A | 0 | 80 | 0 |
| B | 0 | 80 | 0 |
| C | 0 | 80 | 0 |
| D | 0 | 80 | 0 |
| Mode M0 | |||
|---|---|---|---|
| Quadrant | BADHDUFLAG | Total packets | Discarded packets |
| A | 0 | 8428 | 2 |
| B | 0 | 8425 | 1 |
| C | 0 | 24721 | 1 |
| D | 0 | 11735 | 1 |
| Mode M9 | |||
|---|---|---|---|
| Quadrant | BADHDUFLAG | Total packets | Discarded packets |
| A | 0 | 22 | 0 |
| B | 0 | 22 | 0 |
| C | 0 | 22 | 0 |
| D | 0 | 22 | 0 |
| Quadrant | Total seconds | Saturated seconds | Saturation percentage |
|---|---|---|---|
| A | 3958 | 6 | 0.151592% |
| B | 3958 | 34 | 0.859020% |
| C | 3958 | 2096 | 52.956038% |
| D | 3958 | 356 | 8.994442% |
Noise dominated data is calculated using 1-second bins in cleaned event files. If a bin has >2000 counts, and if more than 50% of those come from <1% of pixels, then it is considered to be noise-dominated and hence unusable.
| Quadrant | # 1 sec bins | Bins with >0 counts | Bins with >2000 counts | High rate bins dominated by noise | Noise dominated (total time) | Noise dominated (detector-on time) | Marked lightcurve |
|---|---|---|---|---|---|---|---|
| A | 6111 | 3959 | 3 | 3 | 0.05% | 0.08% | 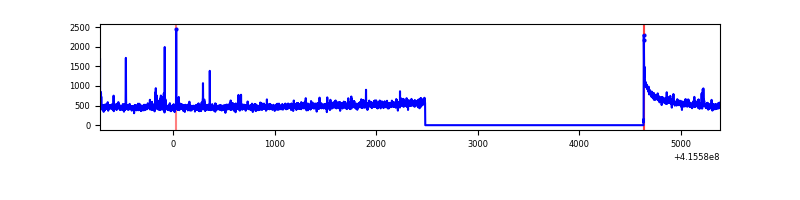 |
| B | 6111 | 3959 | 23 | 23 | 0.38% | 0.58% | 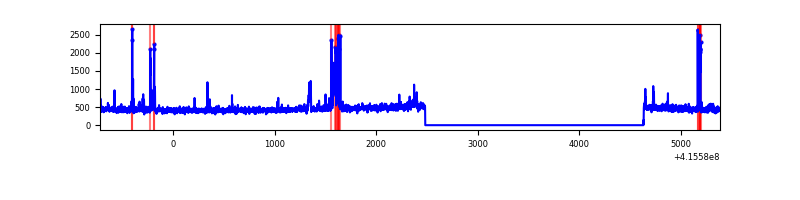 |
| C | 6111 | 3959 | 2171 | 2171 | 35.53% | 54.84% | 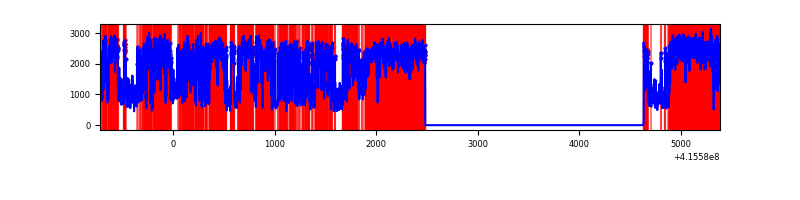 |
| D | 6111 | 3959 | 360 | 360 | 5.89% | 9.09% |  |
Top three noisy pixels from each quadrant. If the there are fewer than three noisy pixels in the level2.evt file, extra rows are filled as -1
| Pixel properties | Quadrant properties | ||||||
|---|---|---|---|---|---|---|---|
| Quadrant | DetID | PixID | Counts | Sigma | Mean | Median | Sigma |
| A | 10 | 83 | 299236 | 3379.63 | 434 | 425 | 88.4 |
| A | 7 | 3 | 21440 | 237.69 | 434 | 425 | 88.4 |
| A | 2 | 79 | 18679 | 206.46 | 434 | 425 | 88.4 |
| B | 5 | 172 | 153630 | 1836.53 | 435 | 425 | 83.4 |
| B | 0 | 245 | 22839 | 268.69 | 435 | 425 | 83.4 |
| B | 4 | 171 | 12243 | 141.67 | 435 | 425 | 83.4 |
| C | 9 | 187 | 5912817 | 74445.18 | 338 | 341 | 79.4 |
| C | 15 | 214 | 129603 | 1627.56 | 338 | 341 | 79.4 |
| C | 0 | 10 | 29453 | 366.56 | 338 | 341 | 79.4 |
| D | 12 | 227 | 742766 | 7538.19 | 409 | 400 | 98.5 |
| D | 1 | 47 | 467382 | 4741.87 | 409 | 400 | 98.5 |
| D | 13 | 249 | 84904 | 858.08 | 409 | 400 | 98.5 |
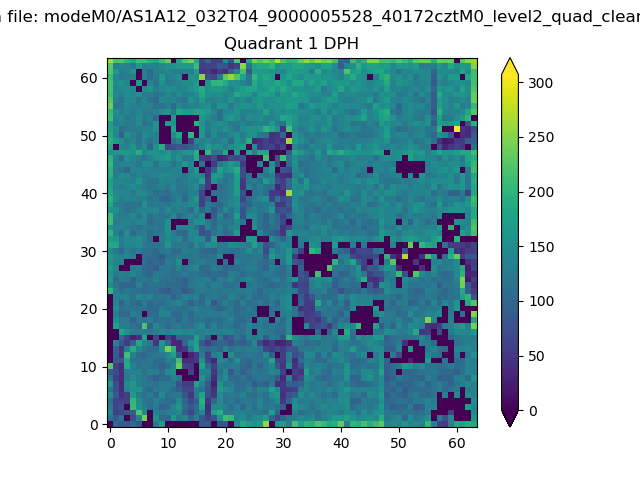
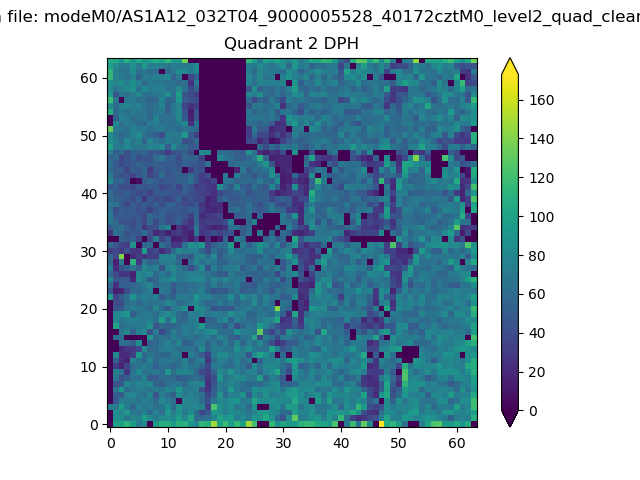
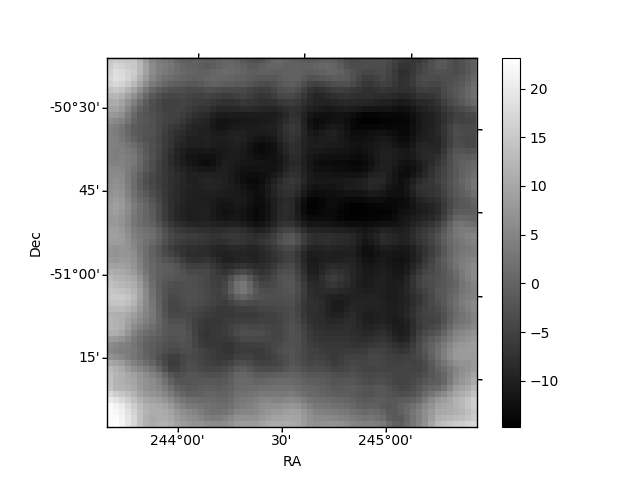
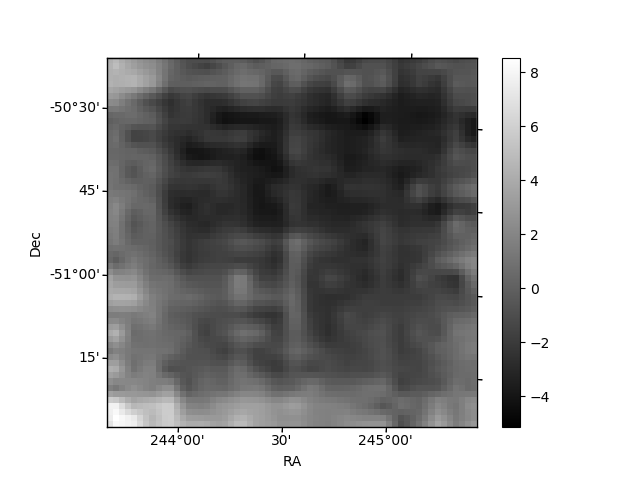
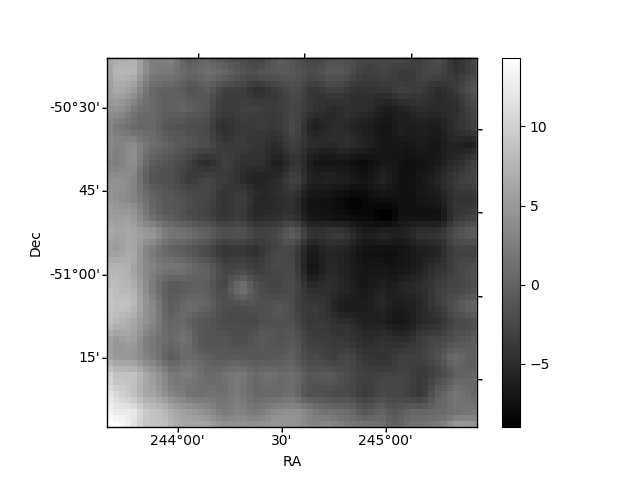
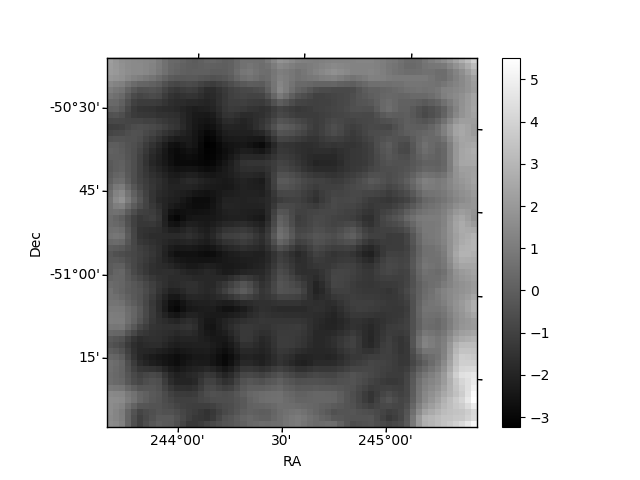
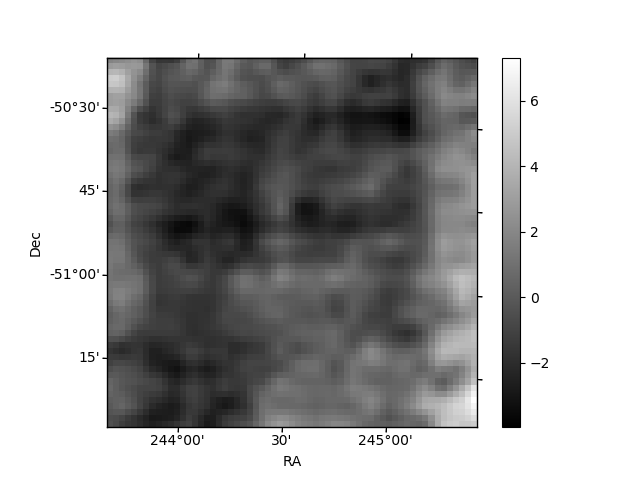
Histogram calculated using DETX and DETY for each event in the final _common_clean file
| Quadrant A | 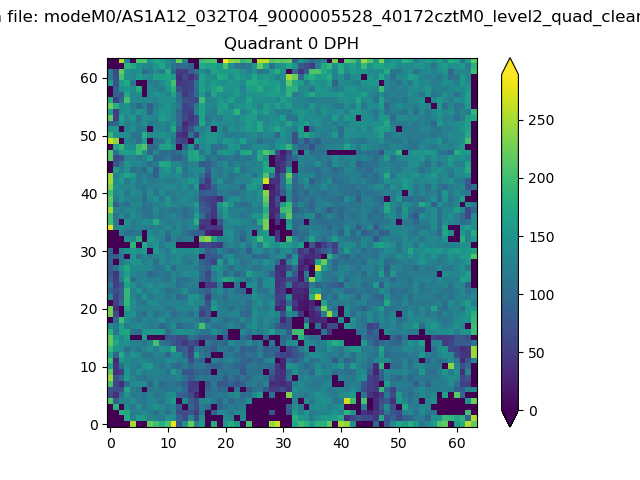 |
 |
Quadrant B |
|---|---|---|---|
| Quadrant D | 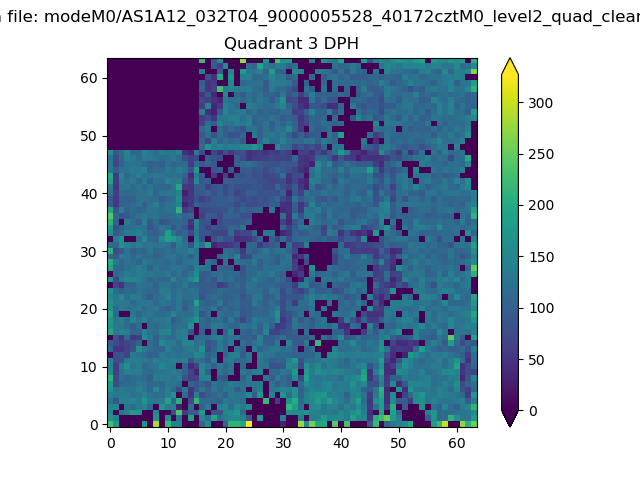 |
 |
Quadrant C |
| Plot type | Count rate plots | Images |
|---|---|---|
| Comparison with Poisson distribution Blue bars denote a histogram of data divided into 1 sec bins. Red curve is a Poisson curve with rate = median count rate of data. |
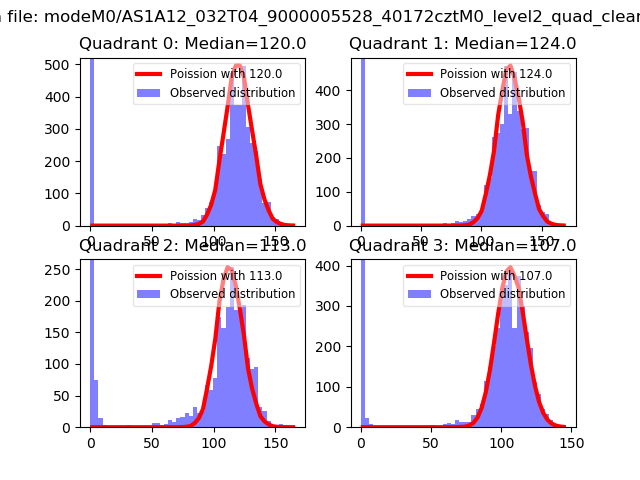 |
 |
| Quadrant-wise count rates Data is divided into 100 sec bins |
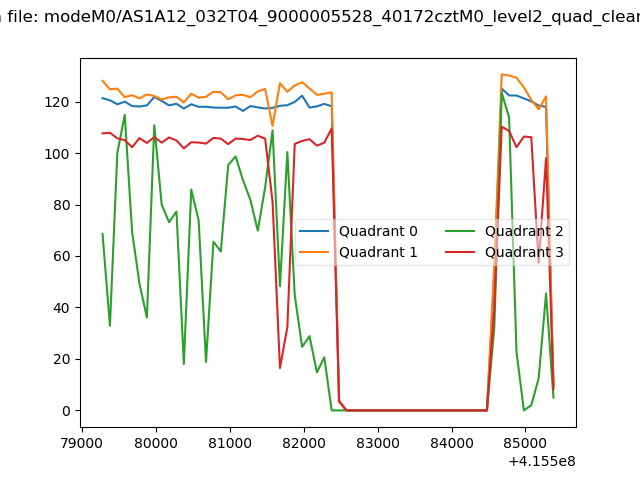 |
|
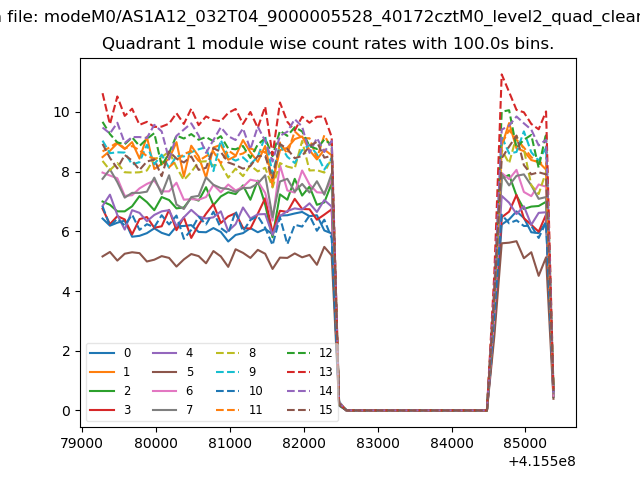
| Module-wise count rates for Quadrant A Data is divided into 100 sec bins |
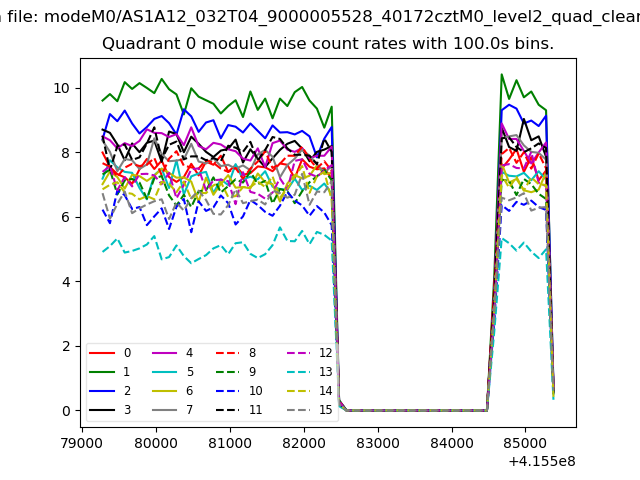 |
 |
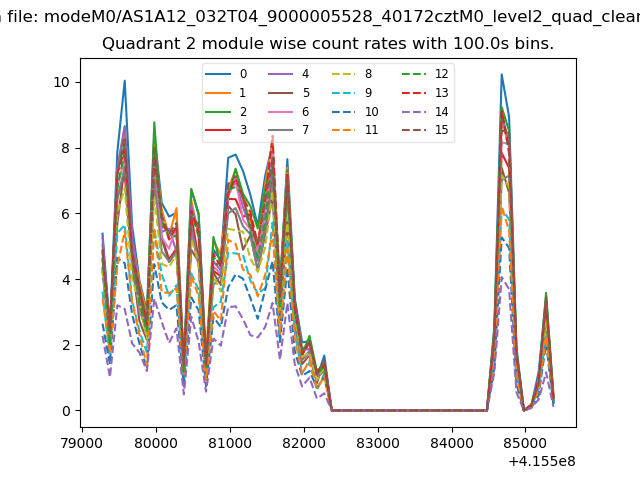
| Module-wise count rates for Quadrant B Data is divided into 100 sec bins |
 |
 |
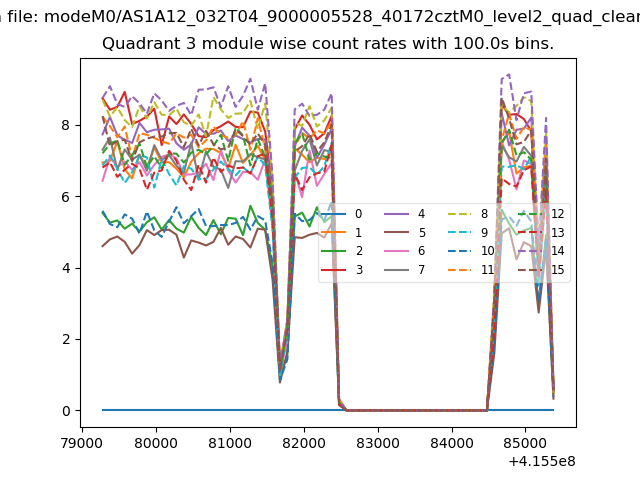
| Module-wise count rates for Quadrant C Data is divided into 100 sec bins |
 |
 |
| Module-wise count rates for Quadrant D Data is divided into 100 sec bins |
 |
 |
| Parameter | Plot |
|---|---|
| CZT HV Monitor | 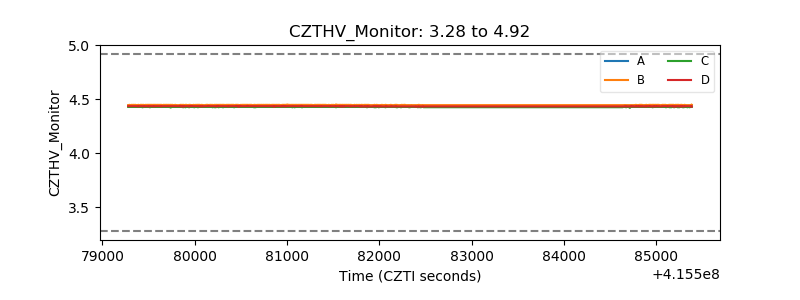 |
| D_VDD | 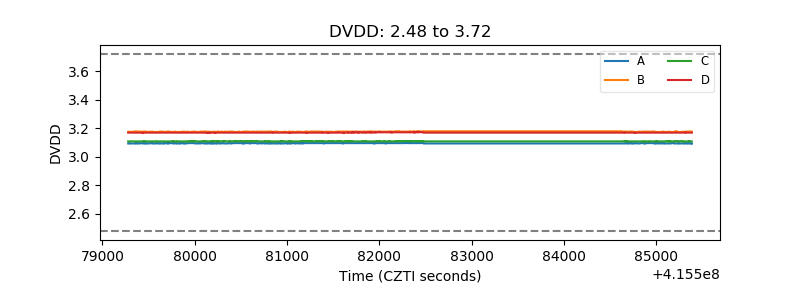 |
| Temperature 1 | 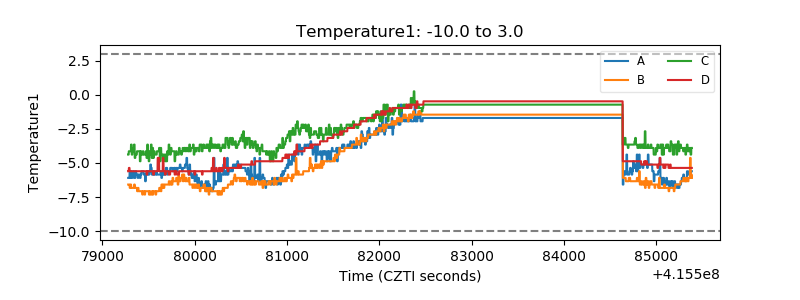 |
| Veto HV Monitor | 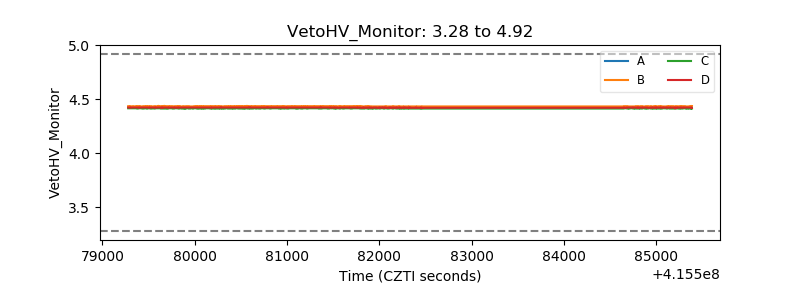 |
| Veto LLD | 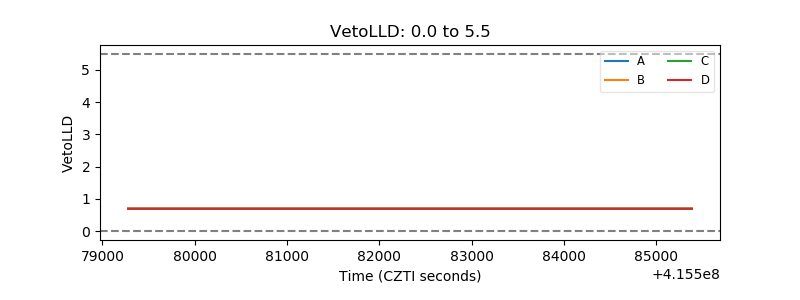 |
| Alpha Counter |  |
| _CPM_Rate | 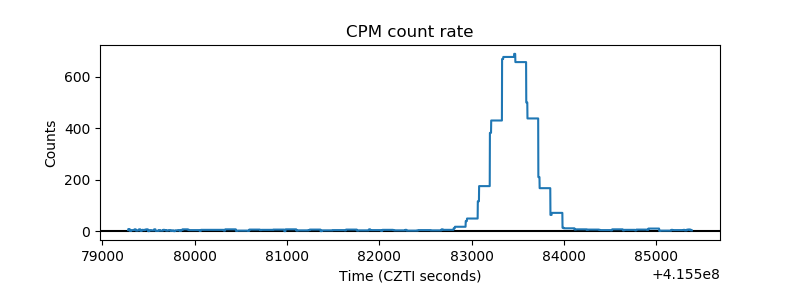 |
| CZT Counter | 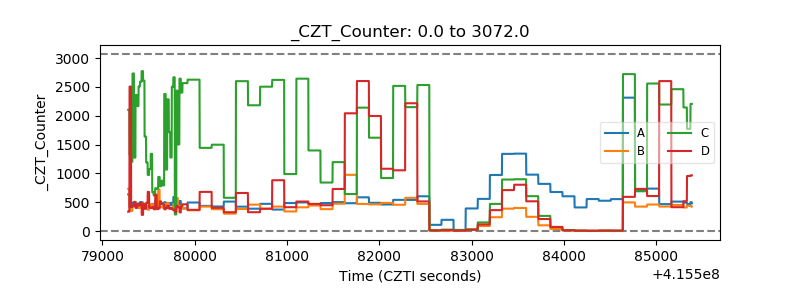 |
| +2.5 Volts monitor | 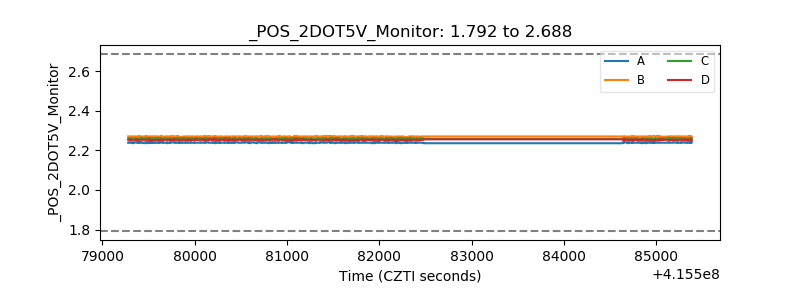 |
| +5 Volts monitor | 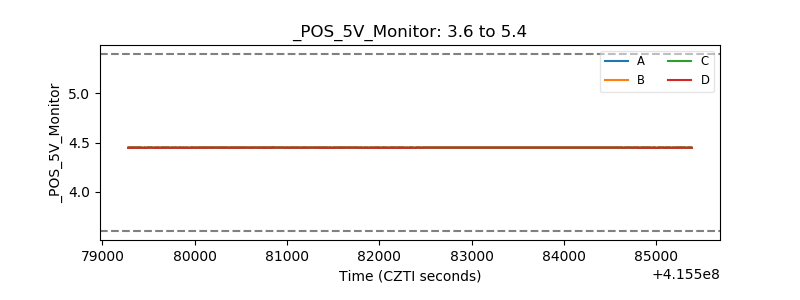 |
| _ROLL_ROT | 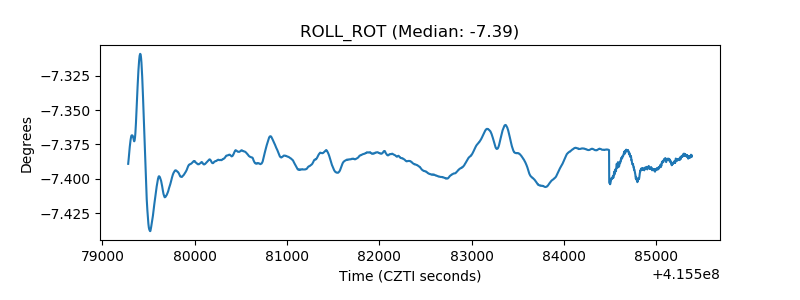 |
| _Roll_DEC | 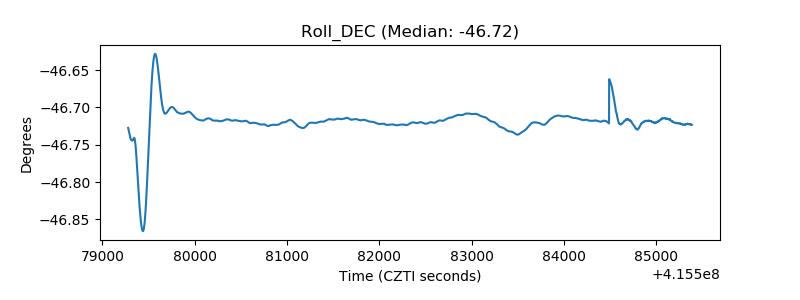 |
| _Roll_RA | 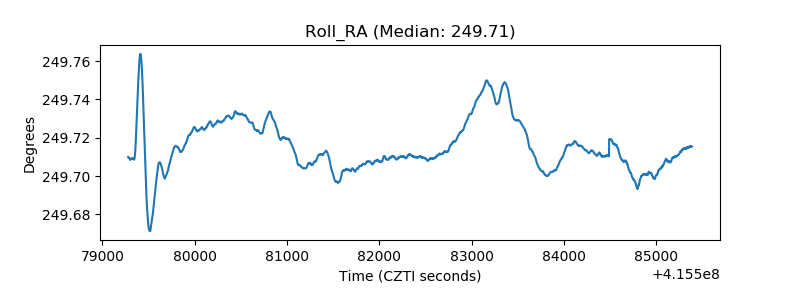 |
| Veto Counter | 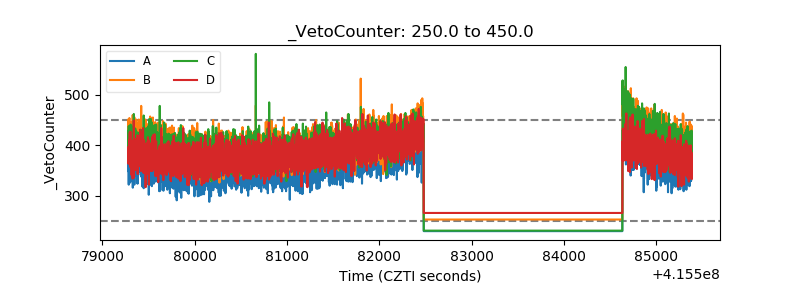 |