| Param | Original file | Final file |
|---|---|---|
| Filename | modeM0/AS1A12_032T04_9000005528_40173cztM0_level2.fits | modeM0/AS1A12_032T04_9000005528_40173cztM0_level2_quad_clean.evt |
| Size (bytes) | 478,016,640 | 76,933,440 |
| Size | 455.9 MB | 73.4 MB |
| Events in quadrant A | 2,554,101 | 573,065 |
| Events in quadrant B | 2,526,677 | 584,704 |
| Events in quadrant C | 8,916,669 | 329,382 |
| Events in quadrant D | 3,311,380 | 494,394 |
| Mode SS | |||
|---|---|---|---|
| Quadrant | BADHDUFLAG | Total packets | Discarded packets |
| A | 0 | 102 | 0 |
| B | 0 | 102 | 0 |
| C | 0 | 102 | 0 |
| D | 0 | 102 | 0 |
| Mode M0 | |||
|---|---|---|---|
| Quadrant | BADHDUFLAG | Total packets | Discarded packets |
| A | 0 | 10670 | 3 |
| B | 0 | 11024 | 2 |
| C | 0 | 29919 | 2 |
| D | 0 | 13358 | 2 |
| Mode M9 | |||
|---|---|---|---|
| Quadrant | BADHDUFLAG | Total packets | Discarded packets |
| A | 0 | 34 | 0 |
| B | 0 | 34 | 0 |
| C | 0 | 34 | 0 |
| D | 0 | 35 | 0 |
| Quadrant | Total seconds | Saturated seconds | Saturation percentage |
|---|---|---|---|
| A | 4958 | 7 | 0.141186% |
| B | 4958 | 119 | 2.400161% |
| C | 4958 | 2376 | 47.922549% |
| D | 4958 | 276 | 5.566761% |
Noise dominated data is calculated using 1-second bins in cleaned event files. If a bin has >2000 counts, and if more than 50% of those come from <1% of pixels, then it is considered to be noise-dominated and hence unusable.
| Quadrant | # 1 sec bins | Bins with >0 counts | Bins with >2000 counts | High rate bins dominated by noise | Noise dominated (total time) | Noise dominated (detector-on time) | Marked lightcurve |
|---|---|---|---|---|---|---|---|
| A | 7021 | 4959 | 5 | 5 | 0.07% | 0.10% | 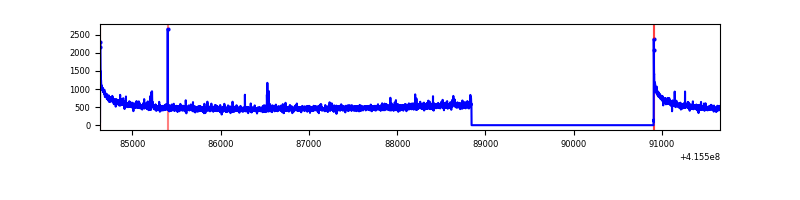 |
| B | 7021 | 4959 | 70 | 70 | 1.00% | 1.41% | 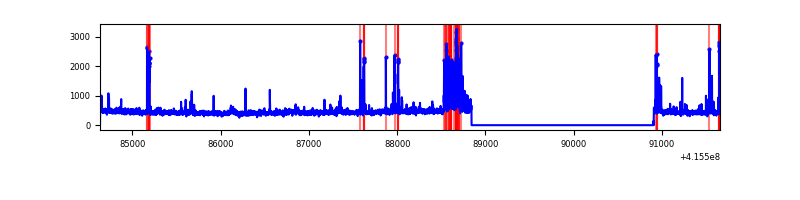 |
| C | 7021 | 4959 | 2420 | 2420 | 34.47% | 48.80% | 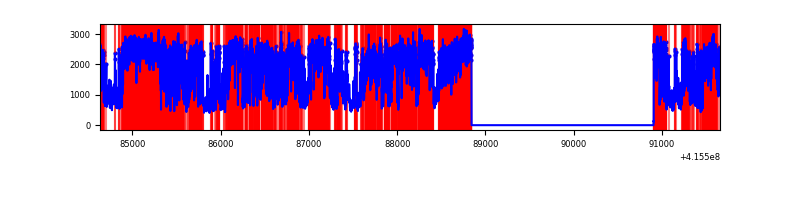 |
| D | 7021 | 4959 | 283 | 283 | 4.03% | 5.71% | 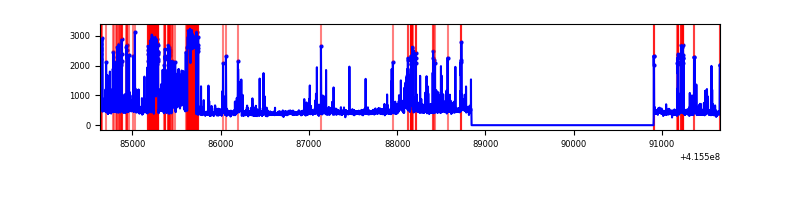 |
Top three noisy pixels from each quadrant. If the there are fewer than three noisy pixels in the level2.evt file, extra rows are filled as -1
| Pixel properties | Quadrant properties | ||||||
|---|---|---|---|---|---|---|---|
| Quadrant | DetID | PixID | Counts | Sigma | Mean | Median | Sigma |
| A | 10 | 83 | 441497 | 4024.45 | 537 | 527 | 109.6 |
| A | 2 | 79 | 16536 | 146.1 | 537 | 527 | 109.6 |
| A | 7 | 3 | 11885 | 103.66 | 537 | 527 | 109.6 |
| B | 5 | 255 | 199132 | 1936.2 | 535 | 521 | 102.6 |
| B | 5 | 172 | 154396 | 1500.08 | 535 | 521 | 102.6 |
| B | 4 | 171 | 46811 | 451.27 | 535 | 521 | 102.6 |
| C | 9 | 187 | 6994846 | 69853.85 | 430 | 433 | 100.1 |
| C | 15 | 214 | 172389 | 1717.34 | 430 | 433 | 100.1 |
| C | 0 | 10 | 36097 | 356.18 | 430 | 433 | 100.1 |
| D | 12 | 227 | 985190 | 7862.7 | 517 | 503 | 125.2 |
| D | 13 | 249 | 126262 | 1004.18 | 517 | 503 | 125.2 |
| D | 9 | 19 | 69457 | 550.6 | 517 | 503 | 125.2 |
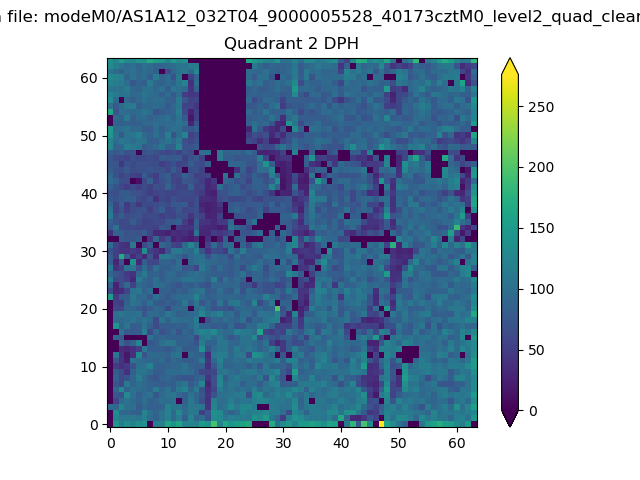
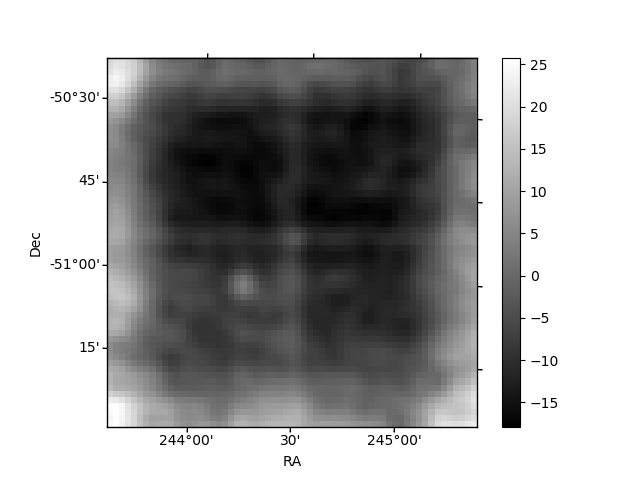
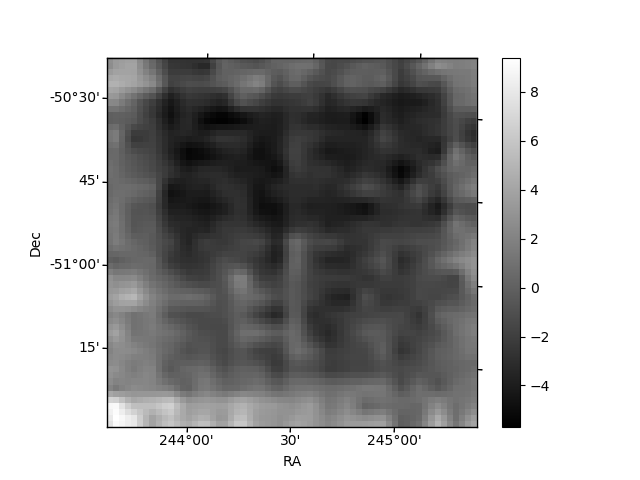
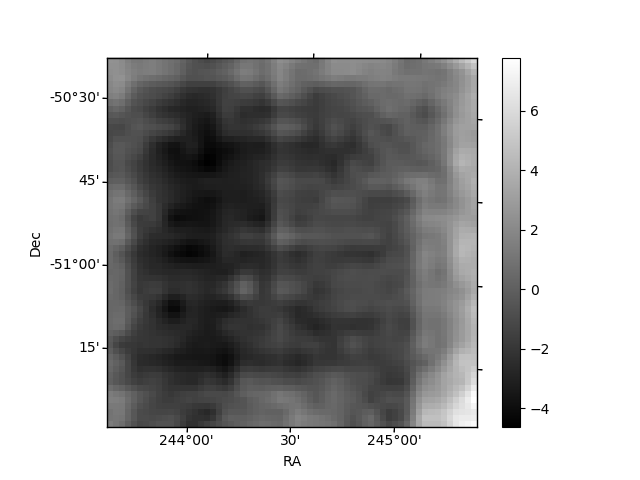
Histogram calculated using DETX and DETY for each event in the final _common_clean file
| Quadrant A | 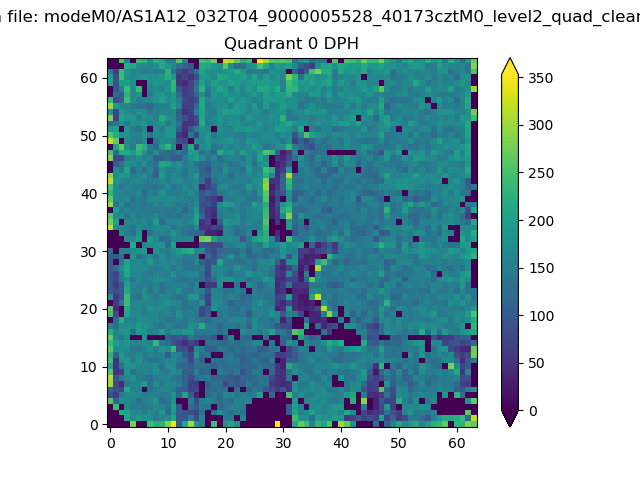 |
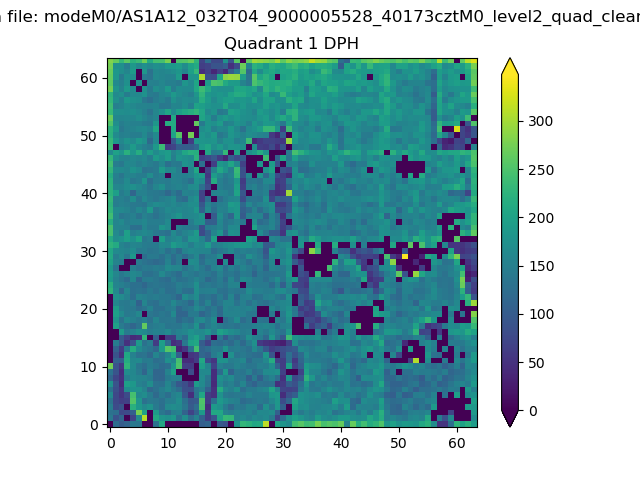 |
Quadrant B |
|---|---|---|---|
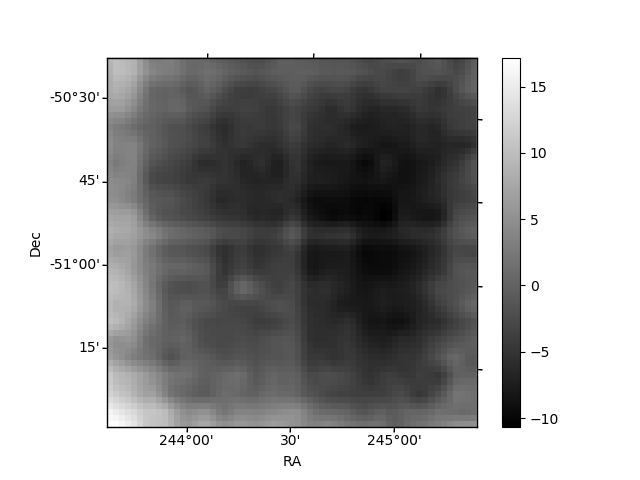
| Quadrant D | 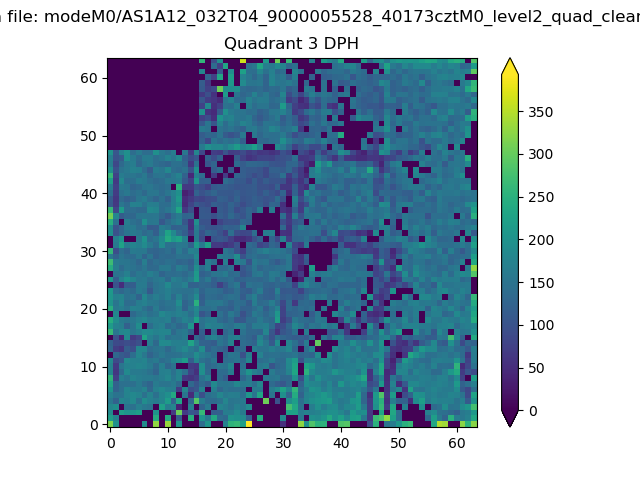 |
 |
Quadrant C |
| Plot type | Count rate plots | Images |
|---|---|---|
| Comparison with Poisson distribution Blue bars denote a histogram of data divided into 1 sec bins. Red curve is a Poisson curve with rate = median count rate of data. |
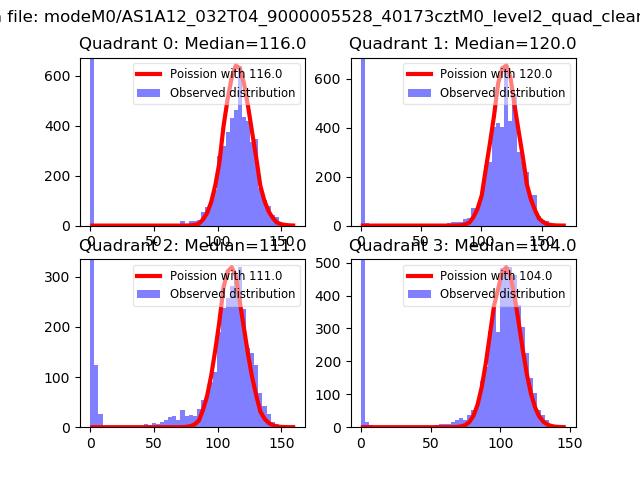 |
 |
| Quadrant-wise count rates Data is divided into 100 sec bins |
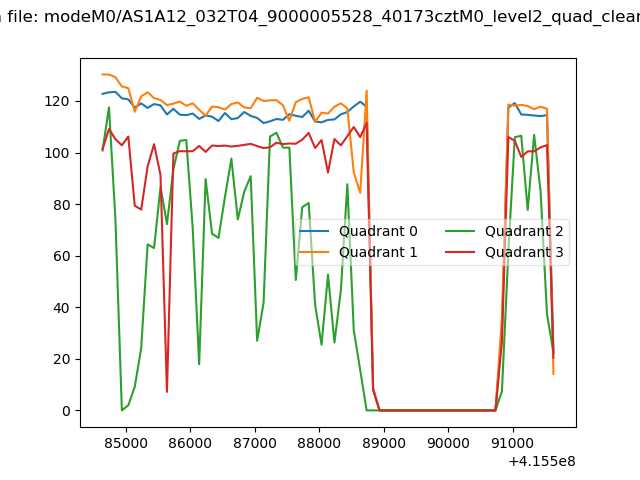 |
|
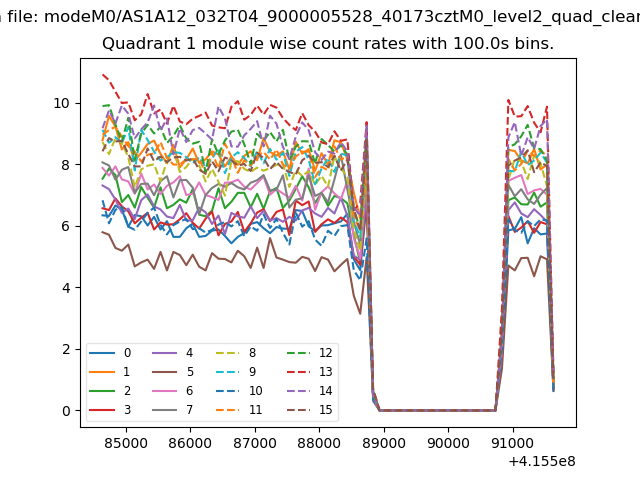
| Module-wise count rates for Quadrant A Data is divided into 100 sec bins |
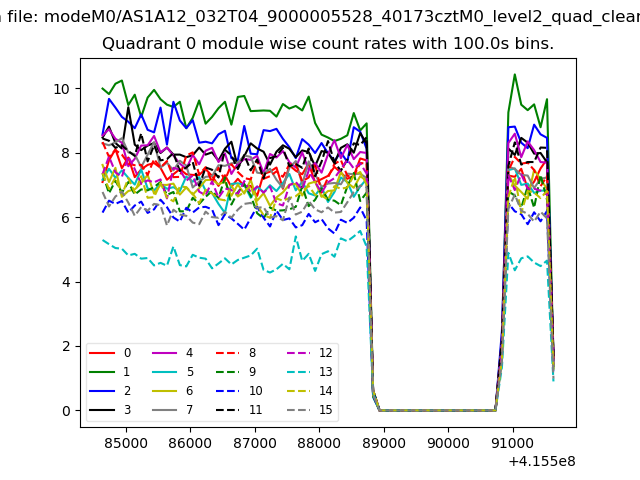 |
 |
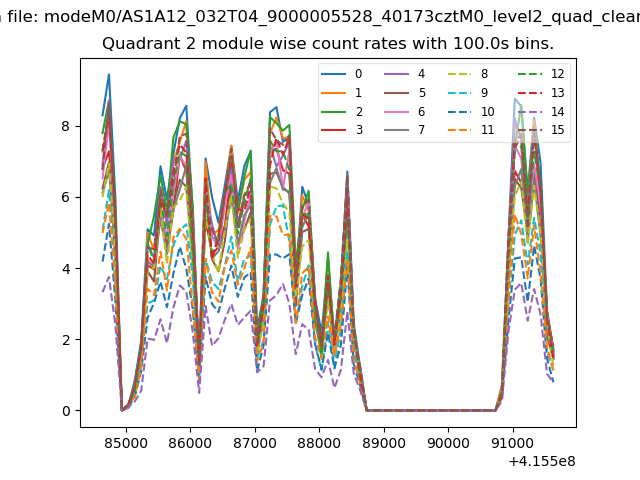
| Module-wise count rates for Quadrant B Data is divided into 100 sec bins |
 |
 |
| Module-wise count rates for Quadrant C Data is divided into 100 sec bins |
 |
 |
| Module-wise count rates for Quadrant D Data is divided into 100 sec bins |
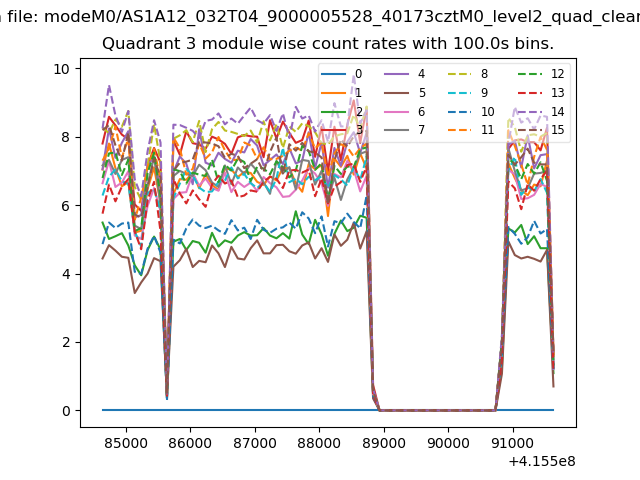 |
 |
| Parameter | Plot |
|---|---|
| CZT HV Monitor | 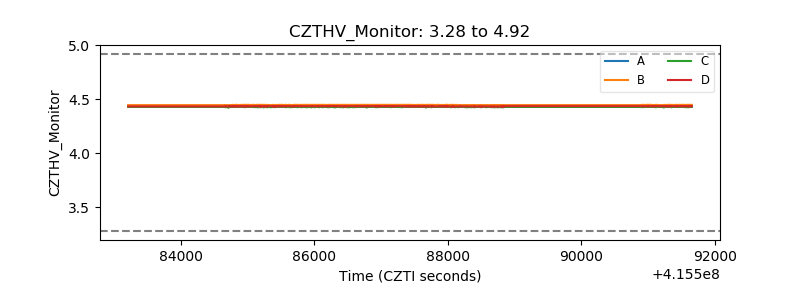 |
| D_VDD | 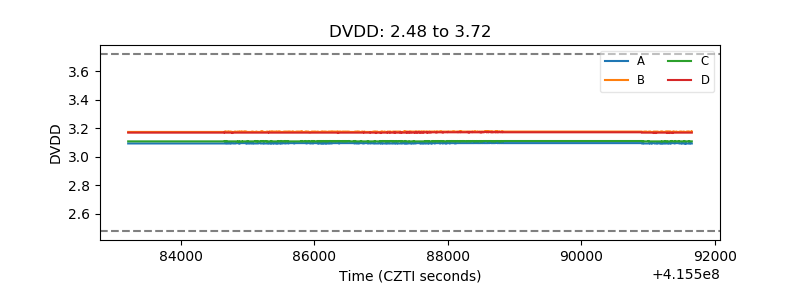 |
| Temperature 1 | 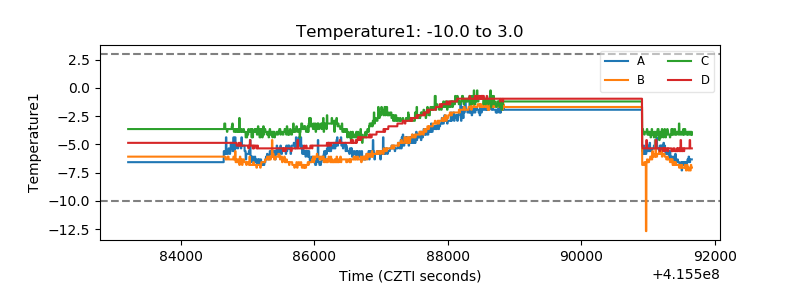 |
| Veto HV Monitor | 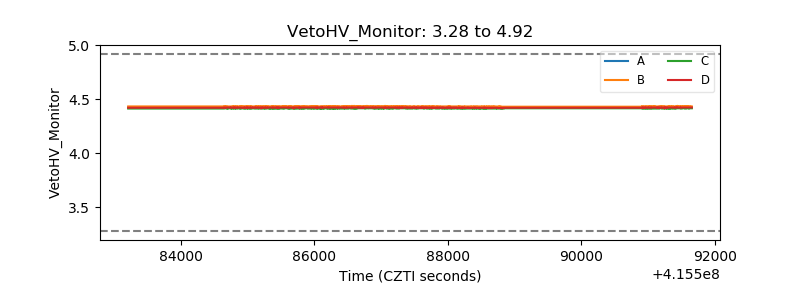 |
| Veto LLD | 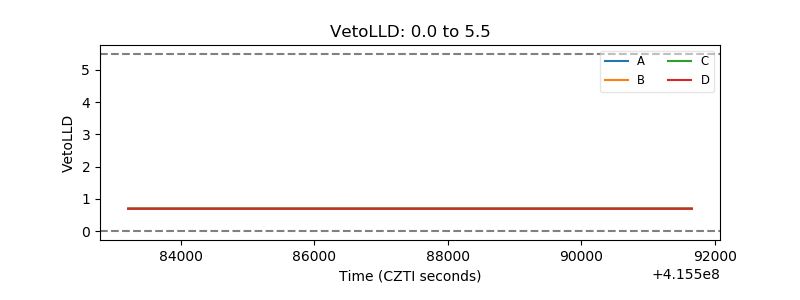 |
| Alpha Counter | 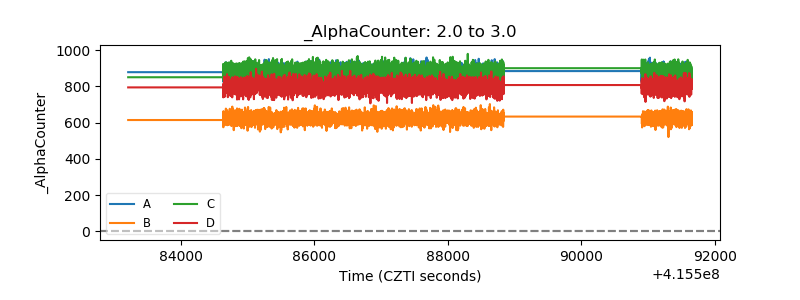 |
| _CPM_Rate |  |
| CZT Counter | 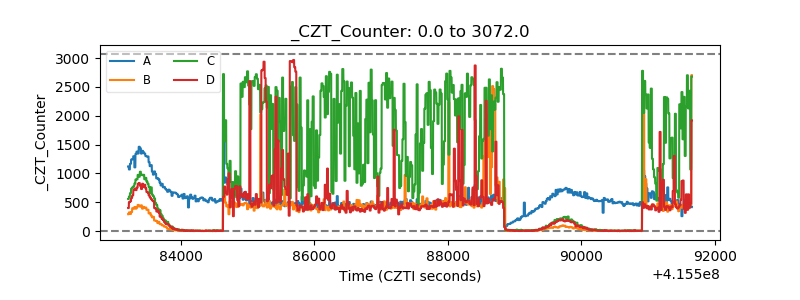 |
| +2.5 Volts monitor | 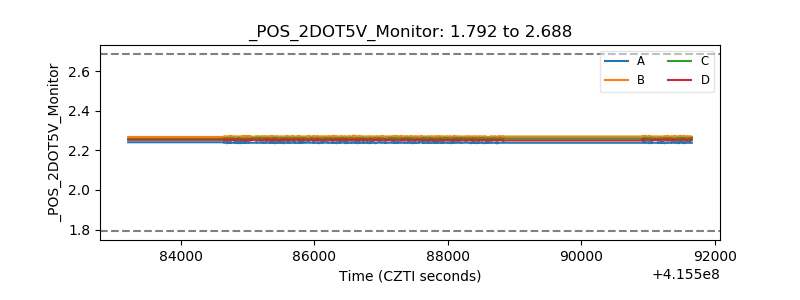 |
| +5 Volts monitor | 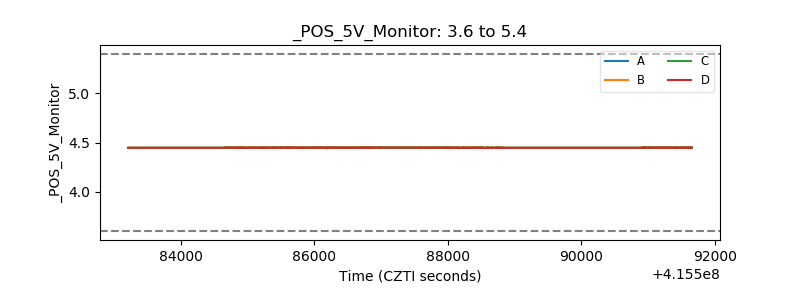 |
| _ROLL_ROT | 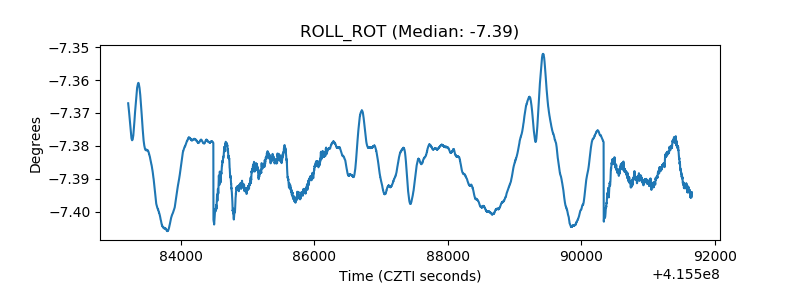 |
| _Roll_DEC | 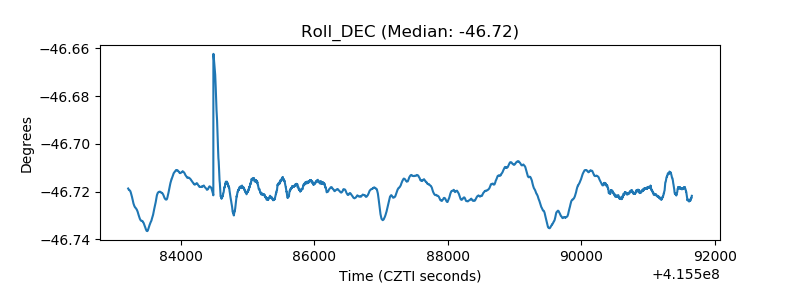 |
| _Roll_RA | 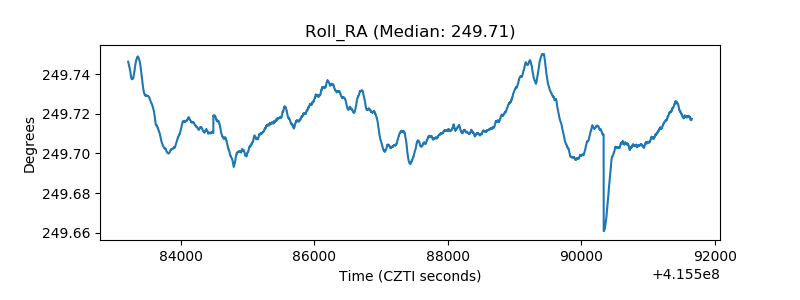 |
| Veto Counter | 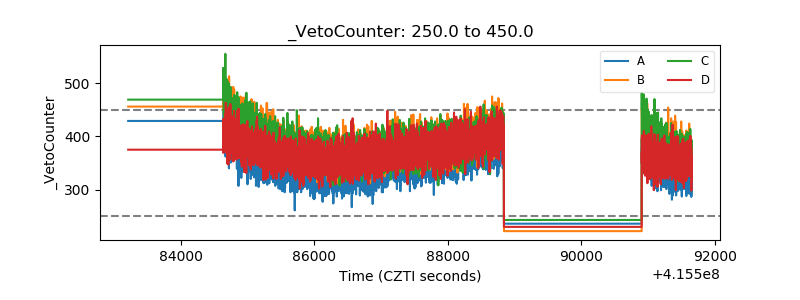 |