| Param | Original file | Final file |
|---|---|---|
| Filename | modeM0/AS1A12_032T04_9000005528_40174cztM0_level2.fits | modeM0/AS1A12_032T04_9000005528_40174cztM0_level2_quad_clean.evt |
| Size (bytes) | 521,507,520 | 79,035,840 |
| Size | 497.3 MB | 75.4 MB |
| Events in quadrant A | 2,797,447 | 587,331 |
| Events in quadrant B | 3,414,599 | 569,645 |
| Events in quadrant C | 9,002,623 | 364,892 |
| Events in quadrant D | 3,680,098 | 501,753 |
| Mode SS | |||
|---|---|---|---|
| Quadrant | BADHDUFLAG | Total packets | Discarded packets |
| A | 0 | 108 | 0 |
| B | 0 | 108 | 0 |
| C | 0 | 108 | 0 |
| D | 0 | 108 | 0 |
| Mode M0 | |||
|---|---|---|---|
| Quadrant | BADHDUFLAG | Total packets | Discarded packets |
| A | 0 | 11671 | 3 |
| B | 0 | 14017 | 2 |
| C | 0 | 30445 | 2 |
| D | 0 | 14810 | 2 |
| Mode M9 | |||
|---|---|---|---|
| Quadrant | BADHDUFLAG | Total packets | Discarded packets |
| A | 0 | 34 | 0 |
| B | 0 | 34 | 0 |
| C | 0 | 34 | 0 |
| D | 0 | 35 | 0 |
| Quadrant | Total seconds | Saturated seconds | Saturation percentage |
|---|---|---|---|
| A | 5272 | 26 | 0.493171% |
| B | 5272 | 418 | 7.928680% |
| C | 5272 | 2291 | 43.455994% |
| D | 5272 | 396 | 7.511381% |
Noise dominated data is calculated using 1-second bins in cleaned event files. If a bin has >2000 counts, and if more than 50% of those come from <1% of pixels, then it is considered to be noise-dominated and hence unusable.
| Quadrant | # 1 sec bins | Bins with >0 counts | Bins with >2000 counts | High rate bins dominated by noise | Noise dominated (total time) | Noise dominated (detector-on time) | Marked lightcurve |
|---|---|---|---|---|---|---|---|
| A | 7034 | 5273 | 14 | 14 | 0.20% | 0.27% | 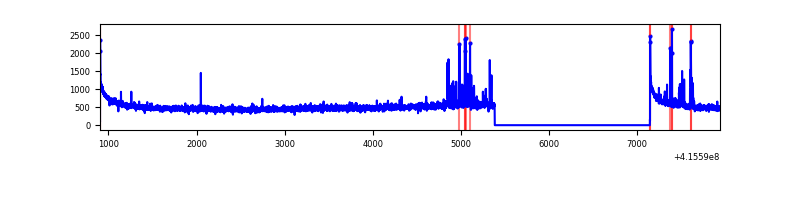 |
| B | 7034 | 5273 | 275 | 275 | 3.91% | 5.22% | 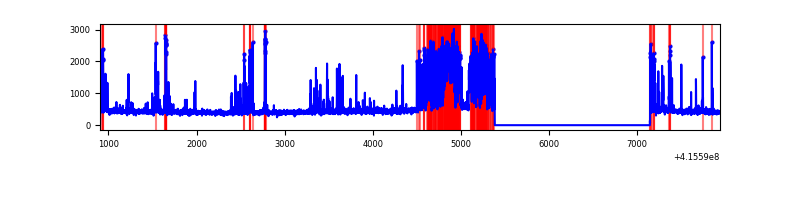 |
| C | 7034 | 5273 | 2248 | 2248 | 31.96% | 42.63% | 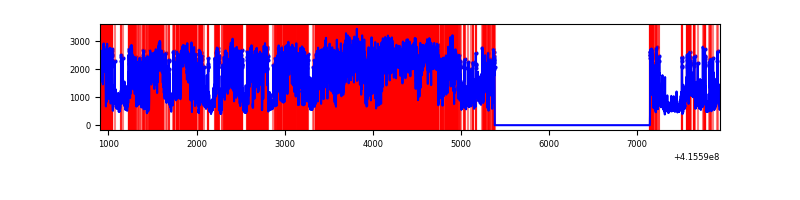 |
| D | 7034 | 5273 | 397 | 397 | 5.64% | 7.53% | 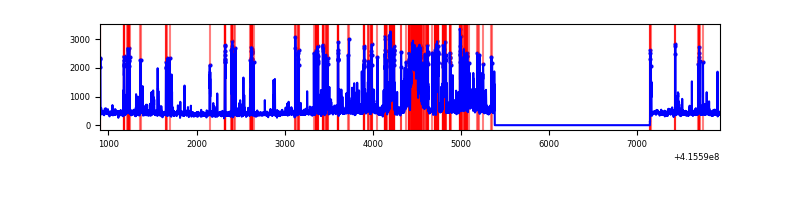 |
Top three noisy pixels from each quadrant. If the there are fewer than three noisy pixels in the level2.evt file, extra rows are filled as -1
| Pixel properties | Quadrant properties | ||||||
|---|---|---|---|---|---|---|---|
| Quadrant | DetID | PixID | Counts | Sigma | Mean | Median | Sigma |
| A | 10 | 83 | 463129 | 4032.43 | 568 | 557 | 114.7 |
| A | 13 | 248 | 73754 | 638.09 | 568 | 557 | 114.7 |
| A | 7 | 3 | 49787 | 429.16 | 568 | 557 | 114.7 |
| B | 5 | 255 | 937137 | 8778.58 | 553 | 537 | 106.7 |
| B | 5 | 172 | 238189 | 2227.47 | 553 | 537 | 106.7 |
| B | 0 | 245 | 26368 | 242.11 | 553 | 537 | 106.7 |
| C | 9 | 187 | 7001536 | 65879.45 | 456 | 459 | 106.3 |
| C | 15 | 214 | 185705 | 1743.15 | 456 | 459 | 106.3 |
| C | 0 | 10 | 18694 | 171.59 | 456 | 459 | 106.3 |
| D | 12 | 227 | 1002559 | 7534.65 | 546 | 531 | 133.0 |
| D | 12 | 233 | 343701 | 2580.43 | 546 | 531 | 133.0 |
| D | 5 | 171 | 63055 | 470.14 | 546 | 531 | 133.0 |
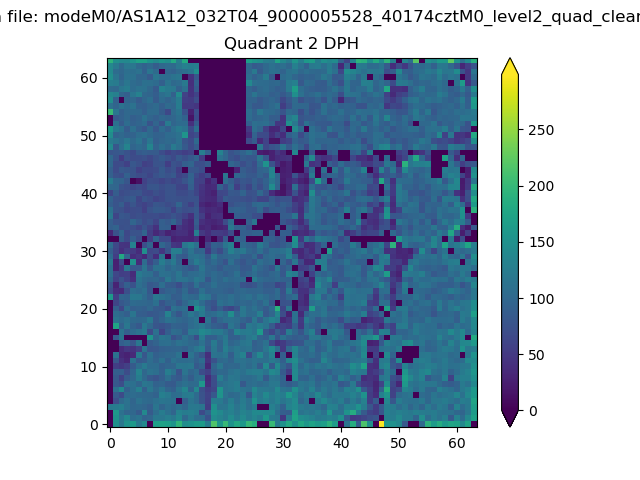
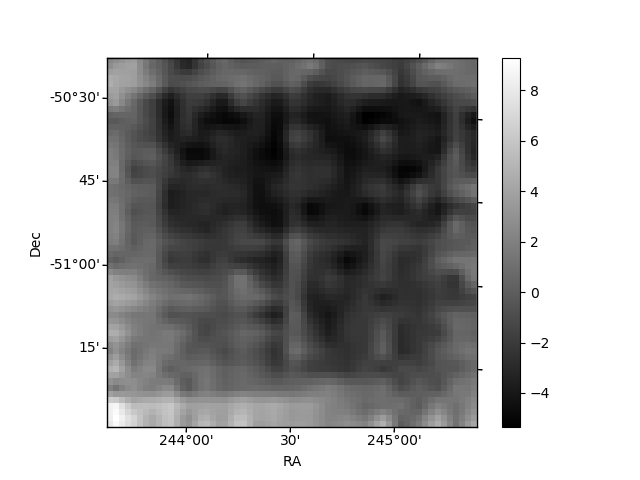
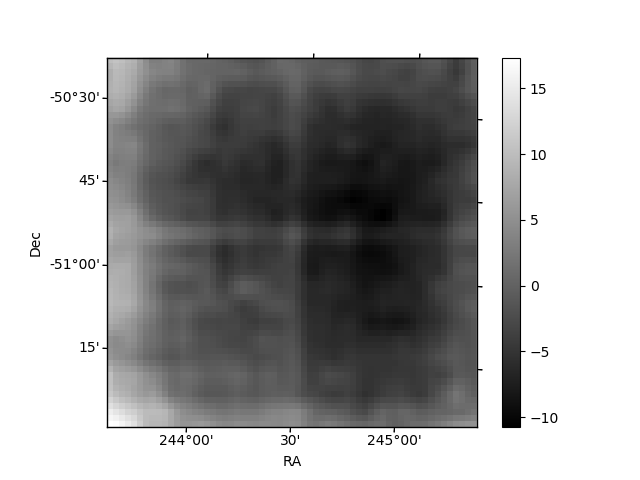
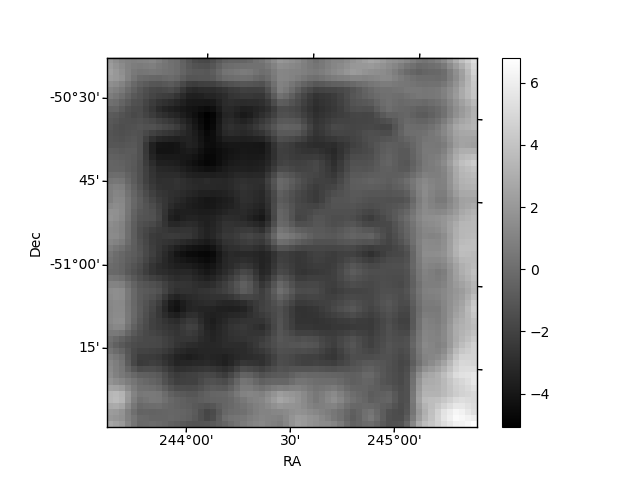
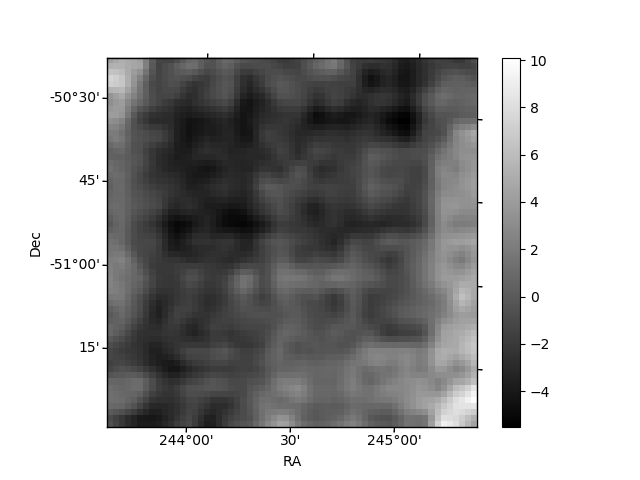
Histogram calculated using DETX and DETY for each event in the final _common_clean file
| Quadrant A | 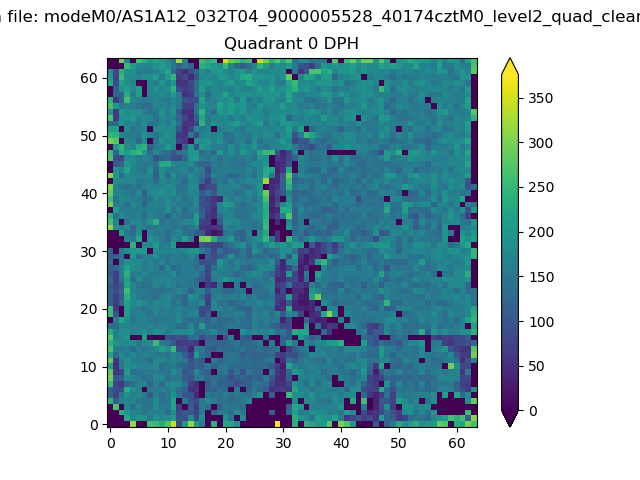 |
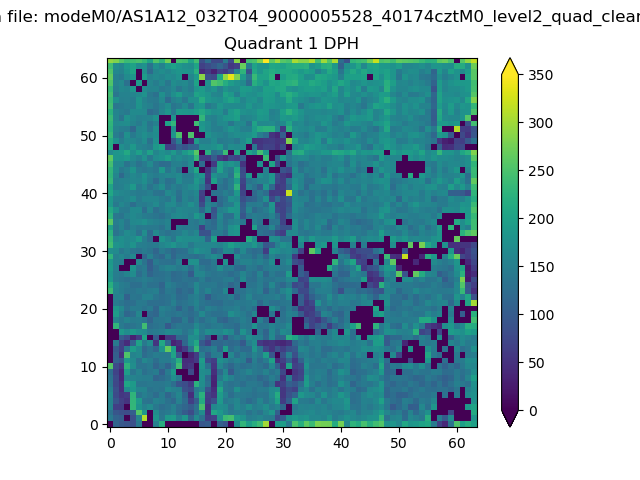 |
Quadrant B |
|---|---|---|---|
| Quadrant D | 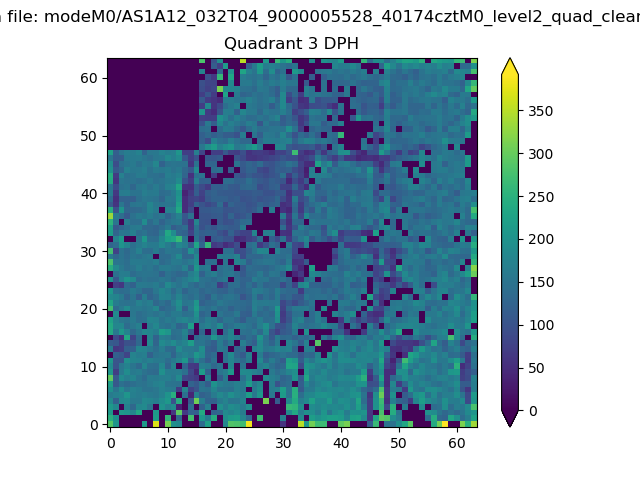 |
 |
Quadrant C |
| Plot type | Count rate plots | Images |
|---|---|---|
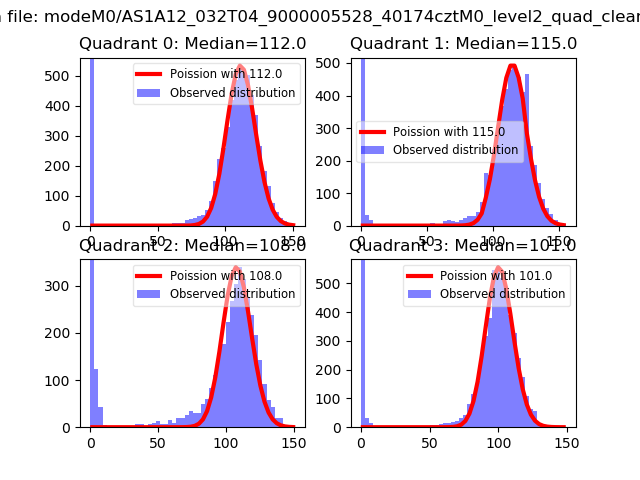
| Comparison with Poisson distribution Blue bars denote a histogram of data divided into 1 sec bins. Red curve is a Poisson curve with rate = median count rate of data. |
 |
 |
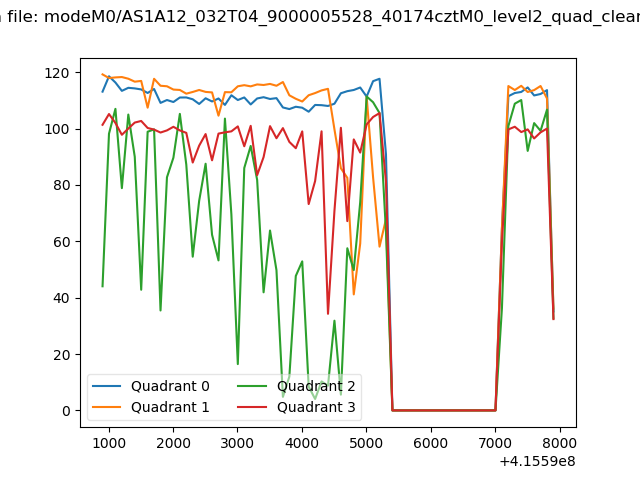
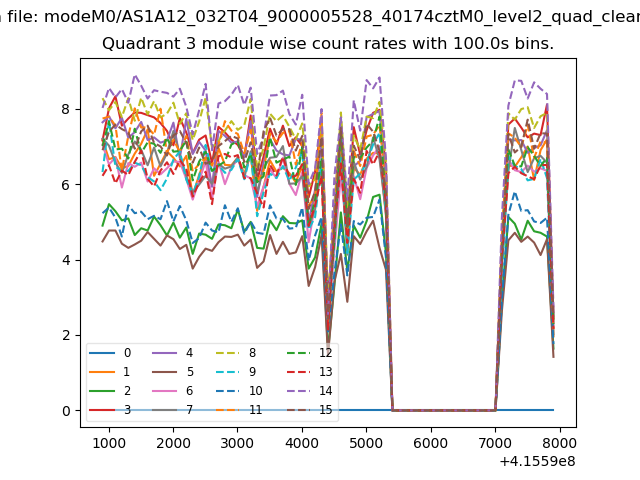
| Quadrant-wise count rates Data is divided into 100 sec bins |
 |
|
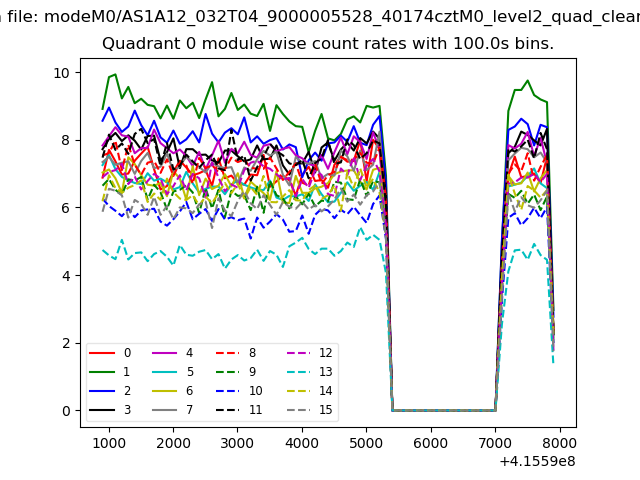
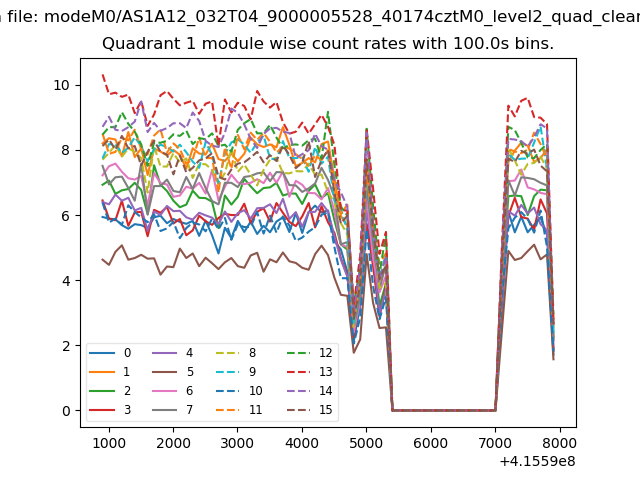
| Module-wise count rates for Quadrant A Data is divided into 100 sec bins |
 |
 |
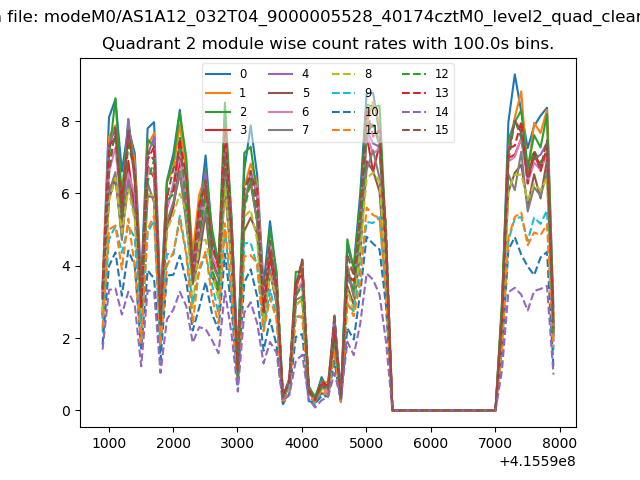
| Module-wise count rates for Quadrant B Data is divided into 100 sec bins |
 |
 |
| Module-wise count rates for Quadrant C Data is divided into 100 sec bins |
 |
 |
| Module-wise count rates for Quadrant D Data is divided into 100 sec bins |
 |
 |
| Parameter | Plot |
|---|---|
| CZT HV Monitor | 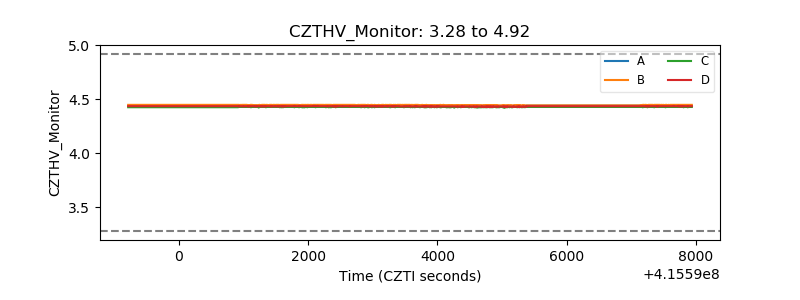 |
| D_VDD | 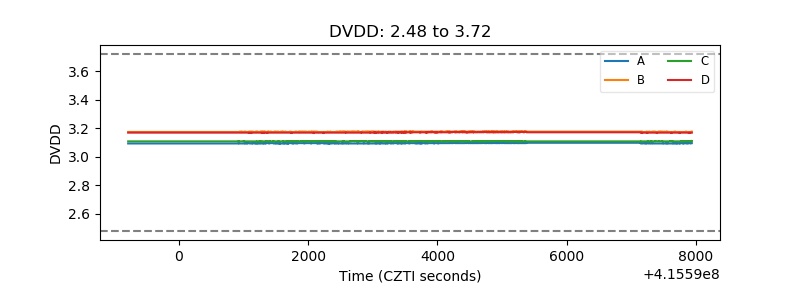 |
| Temperature 1 | 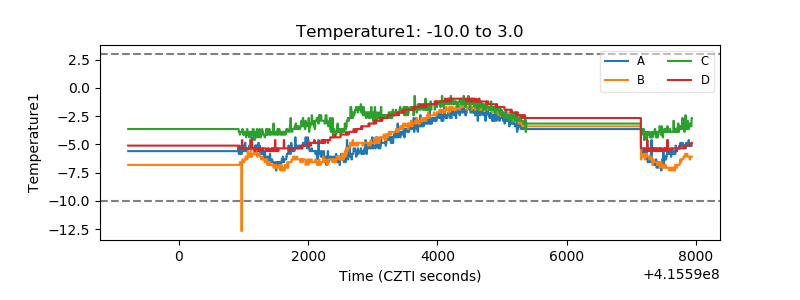 |
| Veto HV Monitor | 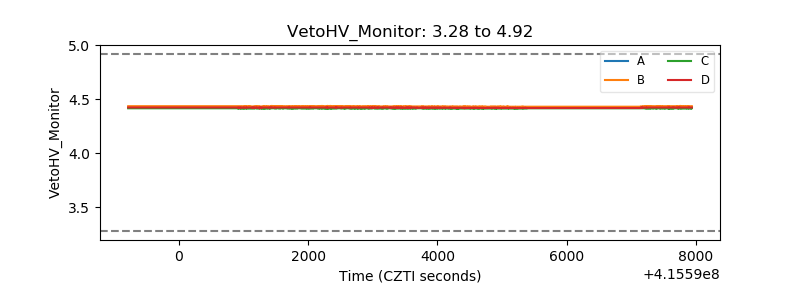 |
| Veto LLD | 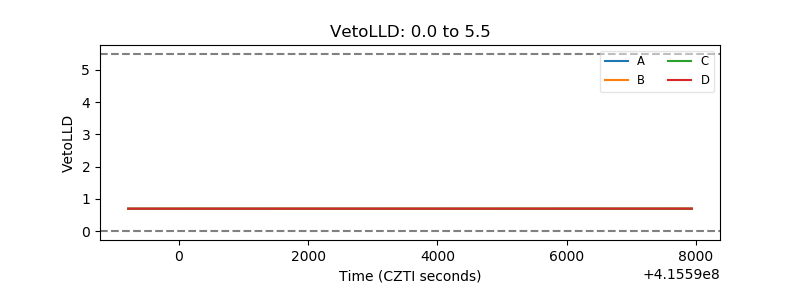 |
| Alpha Counter | 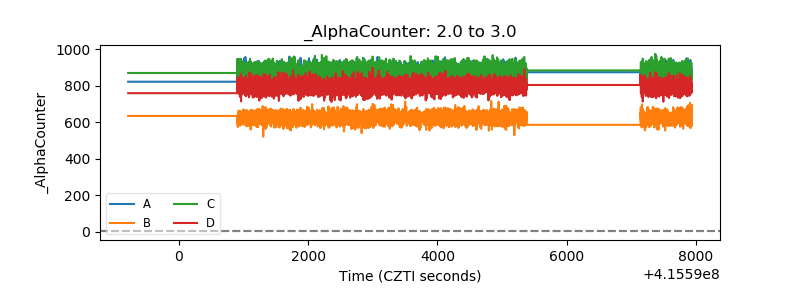 |
| _CPM_Rate | 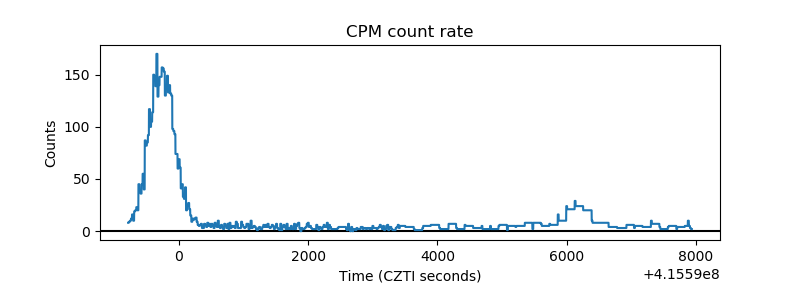 |
| CZT Counter | 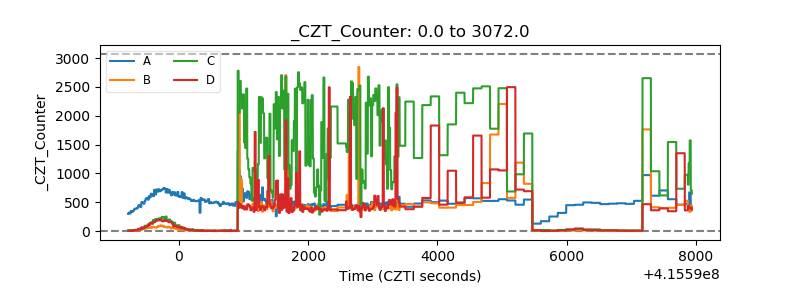 |
| +2.5 Volts monitor |  |
| +5 Volts monitor | 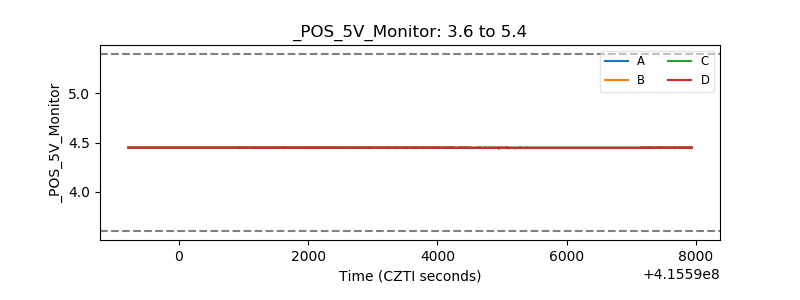 |
| _ROLL_ROT | 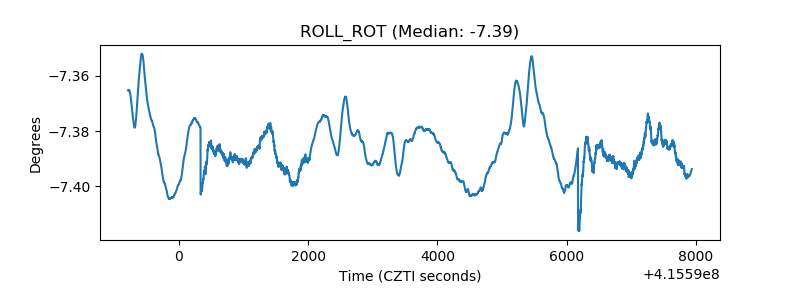 |
| _Roll_DEC | 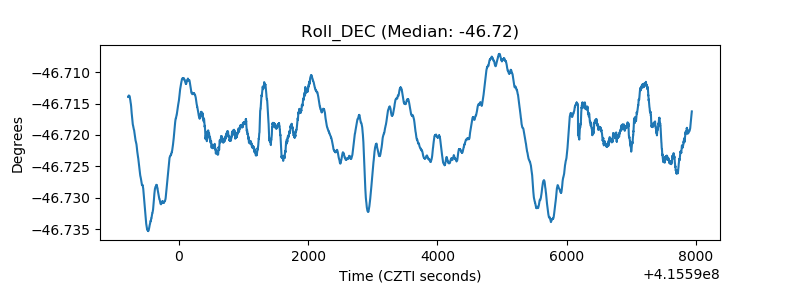 |
| _Roll_RA | 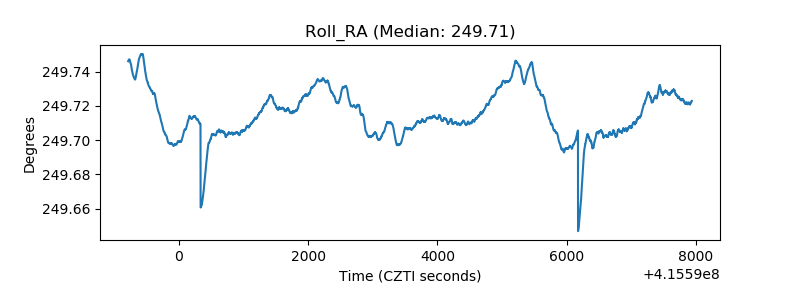 |
| Veto Counter | 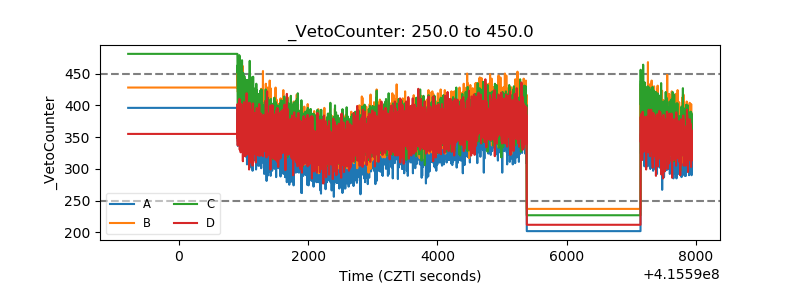 |