| Param | Original file | Final file |
|---|---|---|
| Filename | modeM0/AS1A12_032T04_9000005528_40179cztM0_level2.fits | modeM0/AS1A12_032T04_9000005528_40179cztM0_level2_quad_clean.evt |
| Size (bytes) | 1,050,364,800 | 159,445,440 |
| Size | 1001.7 MB | 152.1 MB |
| Events in quadrant A | 5,937,935 | 1,159,525 |
| Events in quadrant B | 5,883,140 | 1,162,554 |
| Events in quadrant C | 17,941,612 | 744,977 |
| Events in quadrant D | 8,291,360 | 1,020,292 |
| Mode SS | |||
|---|---|---|---|
| Quadrant | BADHDUFLAG | Total packets | Discarded packets |
| A | 0 | 218 | 0 |
| B | 0 | 218 | 0 |
| C | 0 | 218 | 0 |
| D | 0 | 218 | 0 |
| Mode M0 | |||
|---|---|---|---|
| Quadrant | BADHDUFLAG | Total packets | Discarded packets |
| A | 0 | 24113 | 4 |
| B | 0 | 25051 | 3 |
| C | 0 | 60769 | 3 |
| D | 0 | 32157 | 3 |
| Mode M9 | |||
|---|---|---|---|
| Quadrant | BADHDUFLAG | Total packets | Discarded packets |
| A | 0 | 46 | 0 |
| B | 0 | 46 | 0 |
| C | 0 | 46 | 0 |
| D | 0 | 46 | 0 |
| Quadrant | Total seconds | Saturated seconds | Saturation percentage |
|---|---|---|---|
| A | 10690 | 114 | 1.066417% |
| B | 10690 | 400 | 3.741815% |
| C | 10690 | 4456 | 41.683817% |
| D | 10690 | 693 | 6.482694% |
Noise dominated data is calculated using 1-second bins in cleaned event files. If a bin has >2000 counts, and if more than 50% of those come from <1% of pixels, then it is considered to be noise-dominated and hence unusable.
| Quadrant | # 1 sec bins | Bins with >0 counts | Bins with >2000 counts | High rate bins dominated by noise | Noise dominated (total time) | Noise dominated (detector-on time) | Marked lightcurve |
|---|---|---|---|---|---|---|---|
| A | 15197 | 10693 | 90 | 90 | 0.59% | 0.84% | 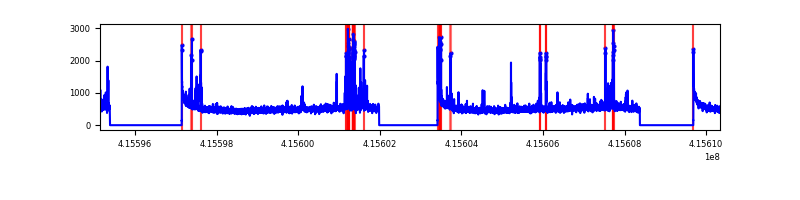 |
| B | 15197 | 10693 | 243 | 243 | 1.60% | 2.27% | 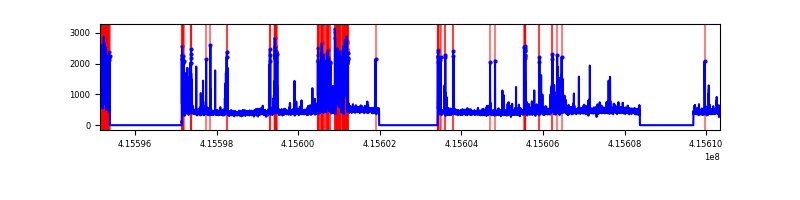 |
| C | 15197 | 10693 | 4433 | 4433 | 29.17% | 41.46% | 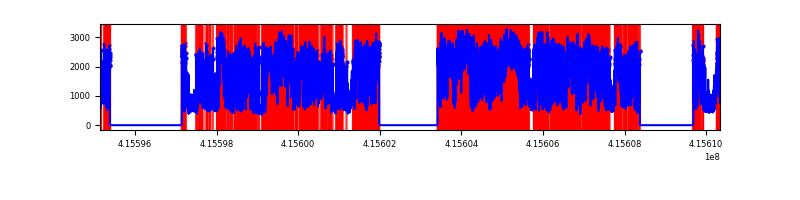 |
| D | 15197 | 10693 | 728 | 728 | 4.79% | 6.81% | 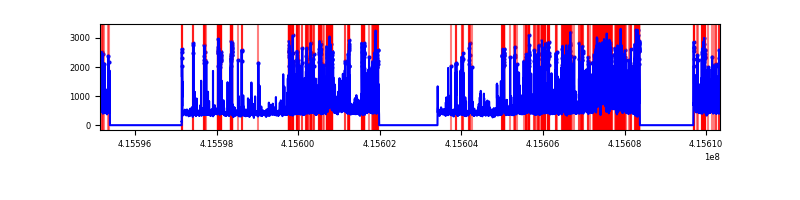 |
Top three noisy pixels from each quadrant. If the there are fewer than three noisy pixels in the level2.evt file, extra rows are filled as -1
| Pixel properties | Quadrant properties | ||||||
|---|---|---|---|---|---|---|---|
| Quadrant | DetID | PixID | Counts | Sigma | Mean | Median | Sigma |
| A | 10 | 83 | 872589 | 3708.6 | 1165 | 1143 | 235.0 |
| A | 13 | 248 | 298860 | 1266.99 | 1165 | 1143 | 235.0 |
| A | 7 | 3 | 158683 | 670.44 | 1165 | 1143 | 235.0 |
| B | 5 | 255 | 1020494 | 4675.83 | 1148 | 1116 | 218.0 |
| B | 5 | 172 | 150639 | 685.85 | 1148 | 1116 | 218.0 |
| B | 15 | 85 | 57112 | 256.85 | 1148 | 1116 | 218.0 |
| C | 9 | 187 | 13750010 | 61655.18 | 957 | 965 | 223.0 |
| C | 15 | 214 | 375722 | 1680.53 | 957 | 965 | 223.0 |
| C | 9 | 54 | 26904 | 116.32 | 957 | 965 | 223.0 |
| D | 12 | 227 | 2567173 | 9316.92 | 1121 | 1091 | 275.4 |
| D | 12 | 233 | 739090 | 2679.52 | 1121 | 1091 | 275.4 |
| D | 13 | 249 | 311869 | 1128.37 | 1121 | 1091 | 275.4 |
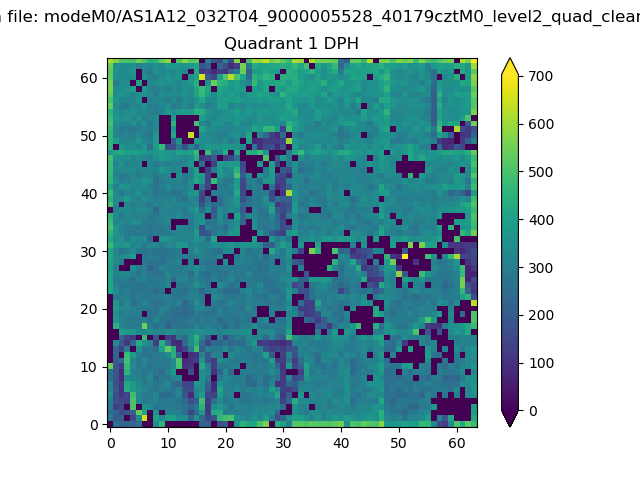
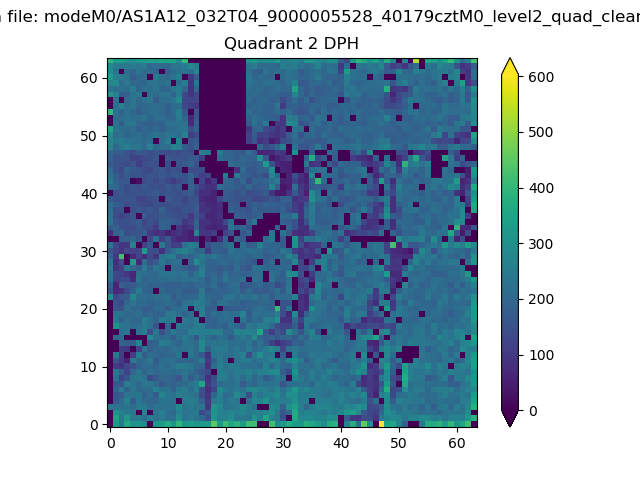
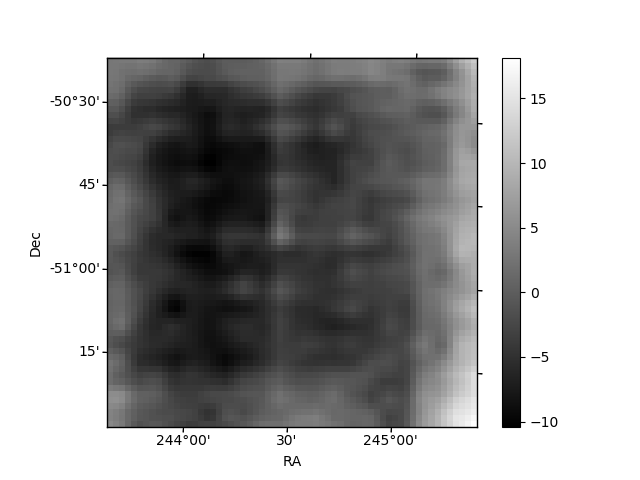
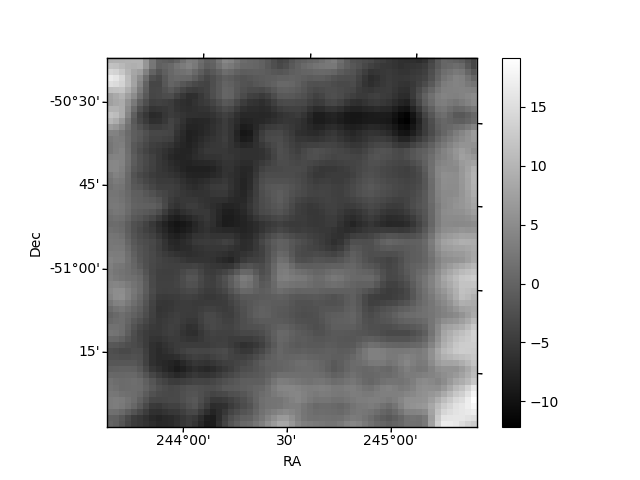
Histogram calculated using DETX and DETY for each event in the final _common_clean file
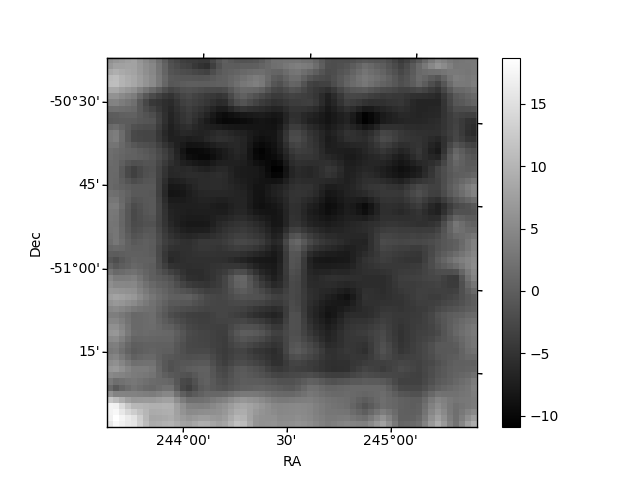
| Quadrant A |  |
 |
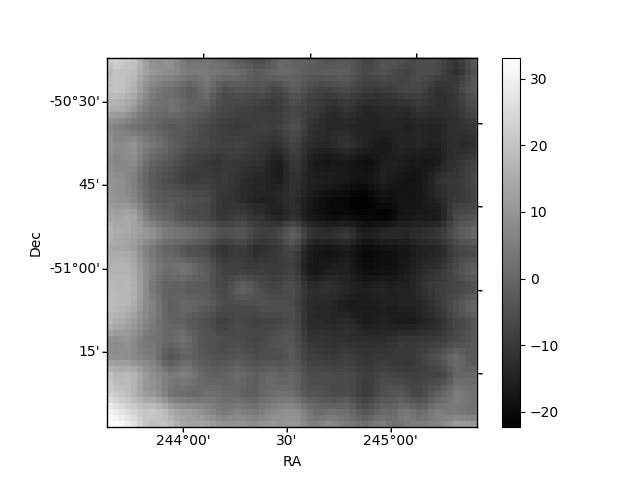
Quadrant B |
|---|---|---|---|
| Quadrant D |  |
 |
Quadrant C |
| Plot type | Count rate plots | Images |
|---|---|---|
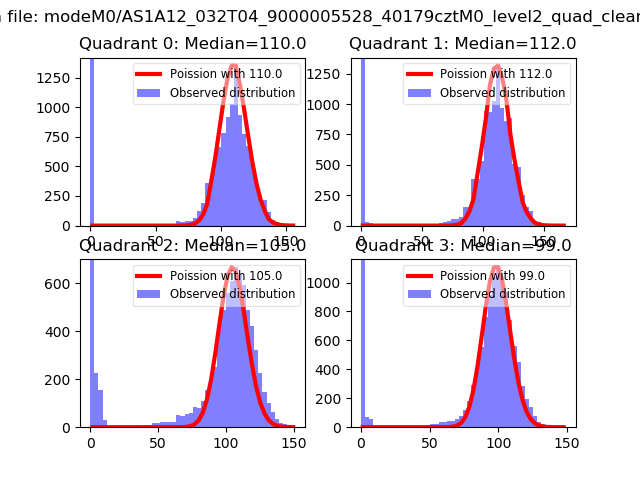
| Comparison with Poisson distribution Blue bars denote a histogram of data divided into 1 sec bins. Red curve is a Poisson curve with rate = median count rate of data. |
 |
 |
| Quadrant-wise count rates Data is divided into 100 sec bins |
 |
|
| Module-wise count rates for Quadrant A Data is divided into 100 sec bins |
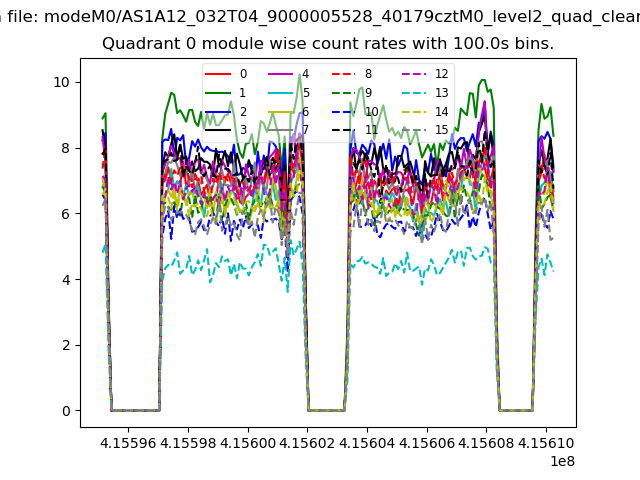 |
 |
| Module-wise count rates for Quadrant B Data is divided into 100 sec bins |
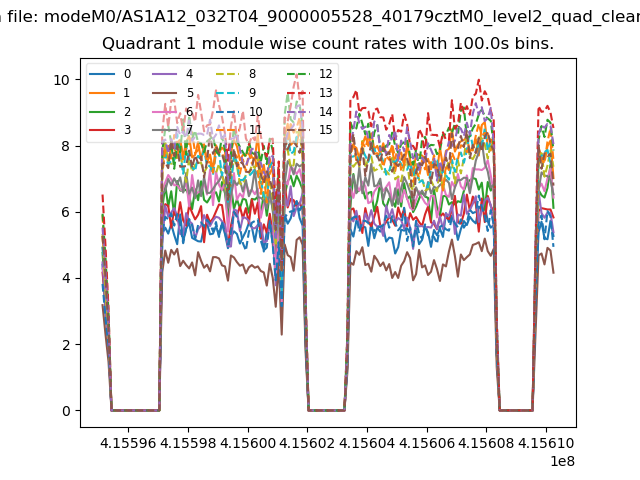 |
 |
| Module-wise count rates for Quadrant C Data is divided into 100 sec bins |
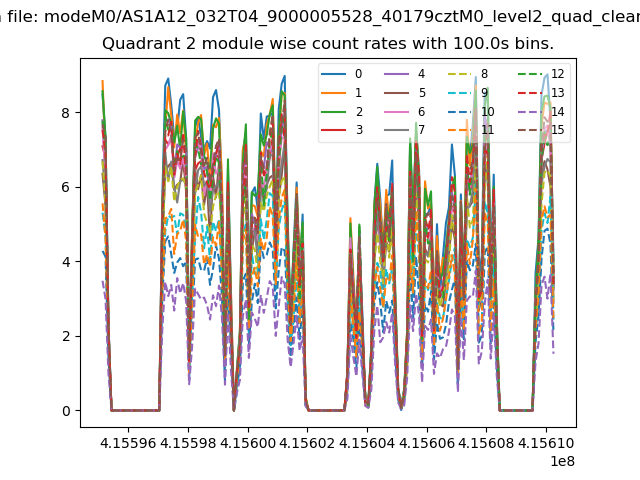 |
 |
| Module-wise count rates for Quadrant D Data is divided into 100 sec bins |
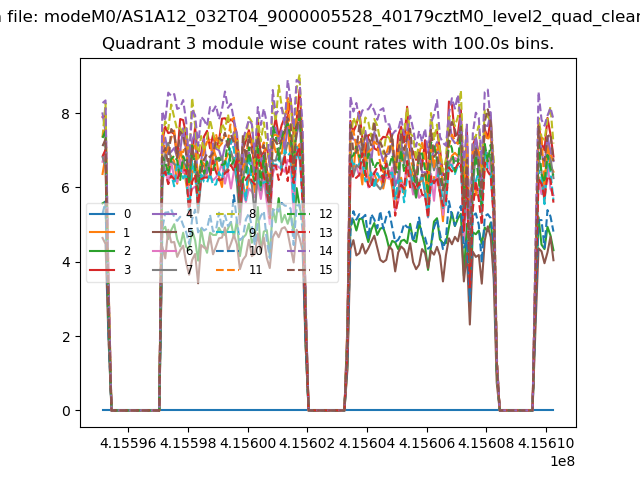 |
 |
| Parameter | Plot |
|---|---|
| CZT HV Monitor | 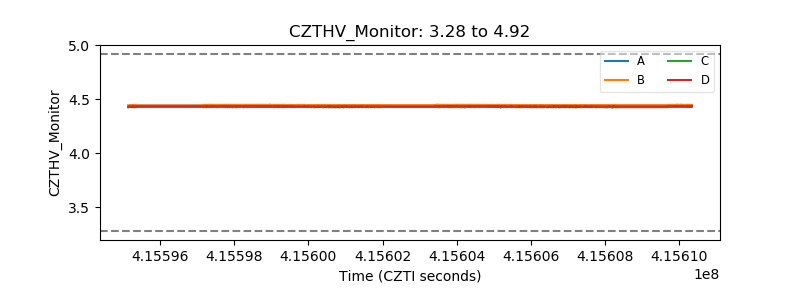 |
| D_VDD | 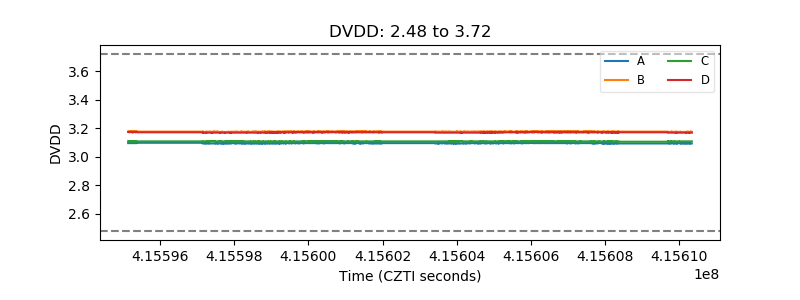 |
| Temperature 1 | 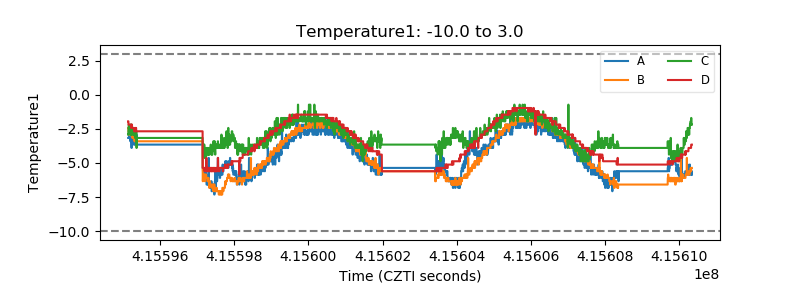 |
| Veto HV Monitor | 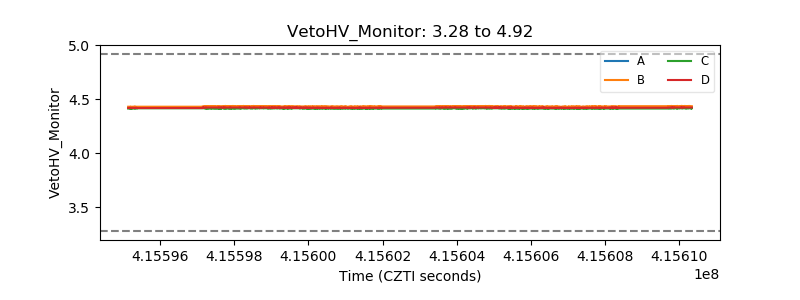 |
| Veto LLD | 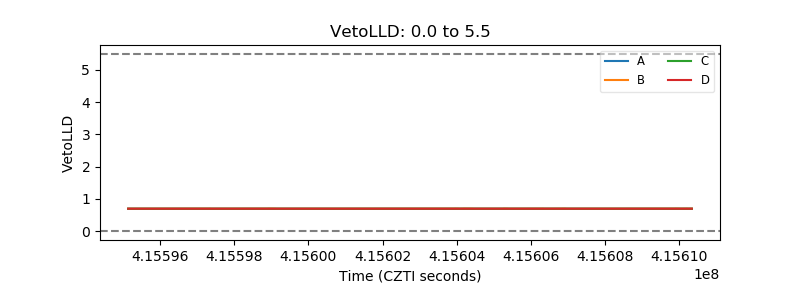 |
| Alpha Counter | 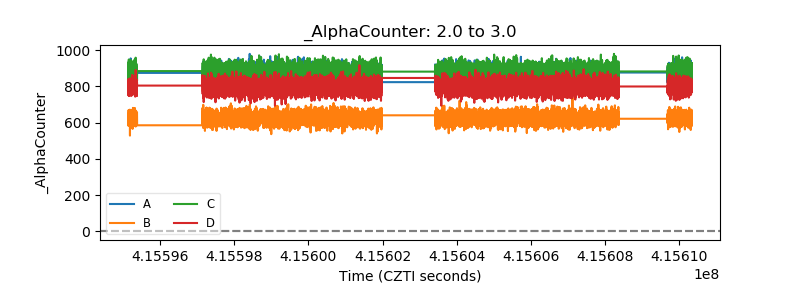 |
| _CPM_Rate | 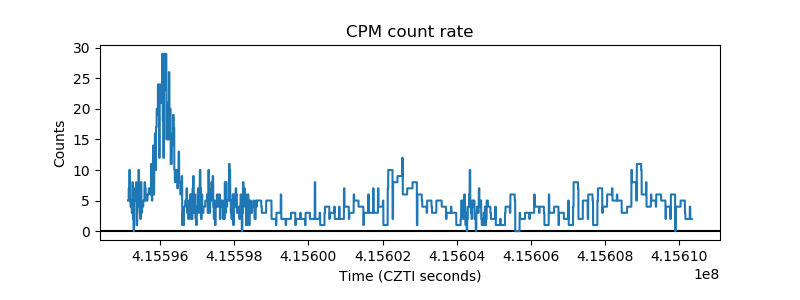 |
| CZT Counter | 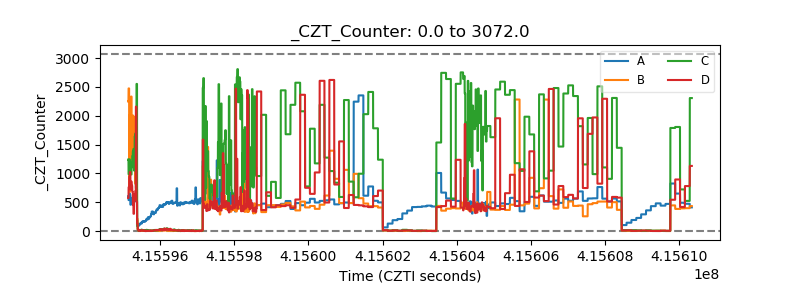 |
| +2.5 Volts monitor | 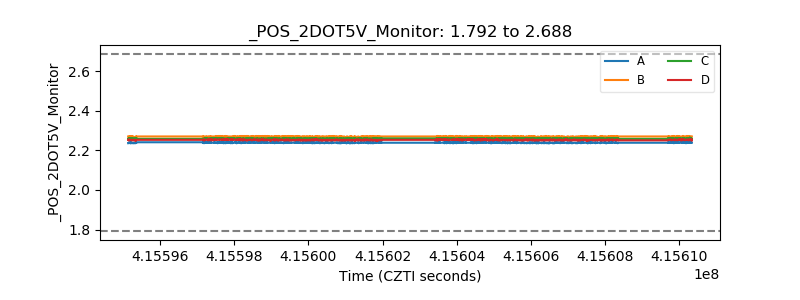 |
| +5 Volts monitor | 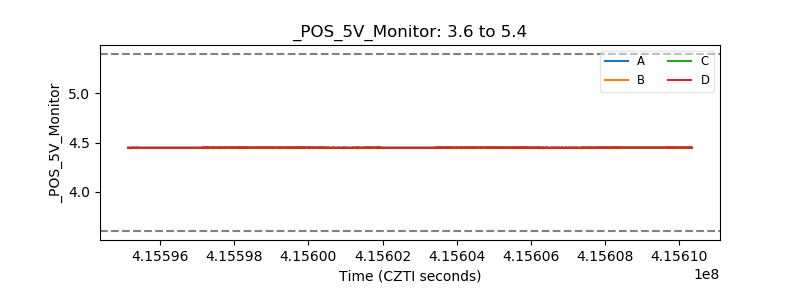 |
| _ROLL_ROT | 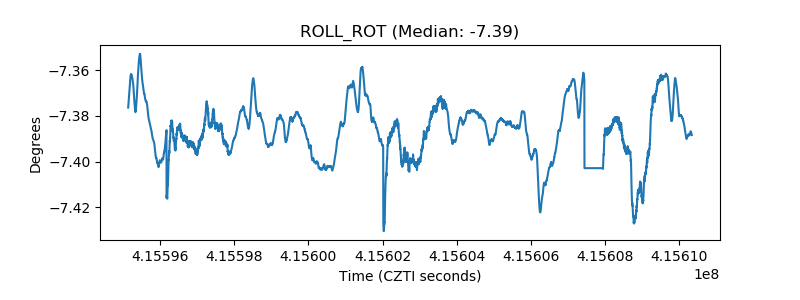 |
| _Roll_DEC | 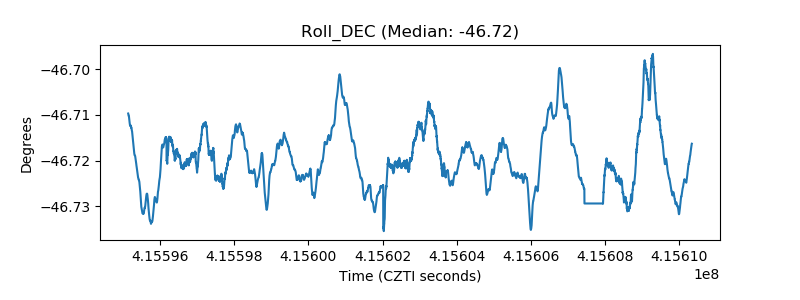 |
| _Roll_RA | 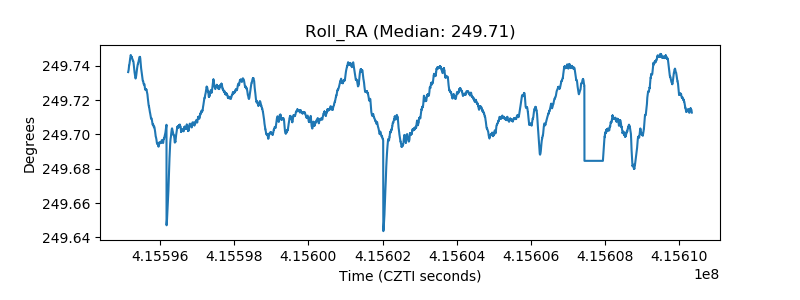 |
| Veto Counter | 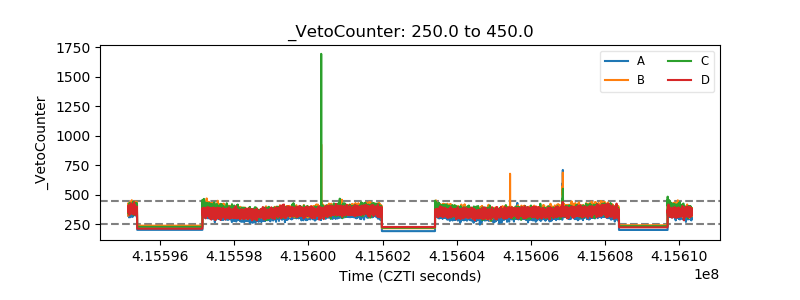 |