| Param | Original file | Final file |
|---|---|---|
| Filename | modeM0/AS1A12_032T04_9000005528_40180cztM0_level2.fits | modeM0/AS1A12_032T04_9000005528_40180cztM0_level2_quad_clean.evt |
| Size (bytes) | 2,188,987,200 | 284,572,800 |
| Size | 2.0 GB | 271.4 MB |
| Events in quadrant A | 10,704,228 | 2,177,736 |
| Events in quadrant B | 10,254,695 | 2,222,329 |
| Events in quadrant C | 39,088,055 | 1,057,879 |
| Events in quadrant D | 19,428,602 | 1,769,738 |
| Mode SS | |||
|---|---|---|---|
| Quadrant | BADHDUFLAG | Total packets | Discarded packets |
| A | 0 | 412 | 0 |
| B | 0 | 412 | 0 |
| C | 0 | 412 | 0 |
| D | 0 | 412 | 0 |
| Mode M0 | |||
|---|---|---|---|
| Quadrant | BADHDUFLAG | Total packets | Discarded packets |
| A | 0 | 43738 | 5 |
| B | 0 | 44225 | 4 |
| C | 0 | 129998 | 4 |
| D | 0 | 71637 | 4 |
| Mode M9 | |||
|---|---|---|---|
| Quadrant | BADHDUFLAG | Total packets | Discarded packets |
| A | 0 | 58 | 0 |
| B | 0 | 58 | 0 |
| C | 0 | 58 | 0 |
| D | 0 | 58 | 0 |
| Quadrant | Total seconds | Saturated seconds | Saturation percentage |
|---|---|---|---|
| A | 20137 | 147 | 0.730000% |
| B | 20137 | 255 | 1.266326% |
| C | 20137 | 11280 | 56.016288% |
| D | 20137 | 2547 | 12.648359% |
Noise dominated data is calculated using 1-second bins in cleaned event files. If a bin has >2000 counts, and if more than 50% of those come from <1% of pixels, then it is considered to be noise-dominated and hence unusable.
| Quadrant | # 1 sec bins | Bins with >0 counts | Bins with >2000 counts | High rate bins dominated by noise | Noise dominated (total time) | Noise dominated (detector-on time) | Marked lightcurve |
|---|---|---|---|---|---|---|---|
| A | 25926 | 20141 | 94 | 94 | 0.36% | 0.47% | 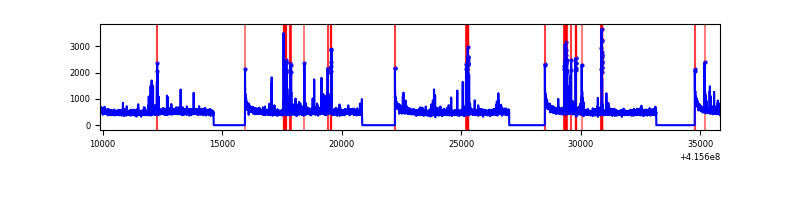 |
| B | 25926 | 20141 | 192 | 192 | 0.74% | 0.95% | 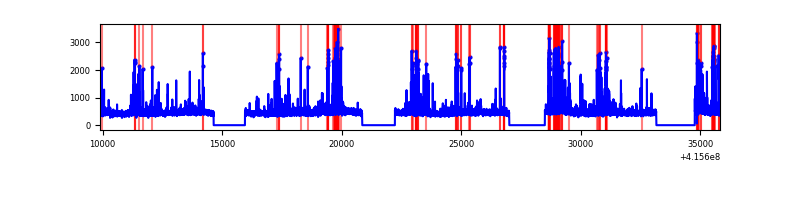 |
| C | 25926 | 20141 | 11327 | 11327 | 43.69% | 56.24% | 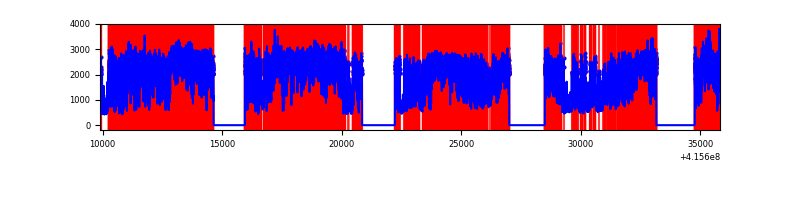 |
| D | 25926 | 20141 | 2699 | 2699 | 10.41% | 13.40% | 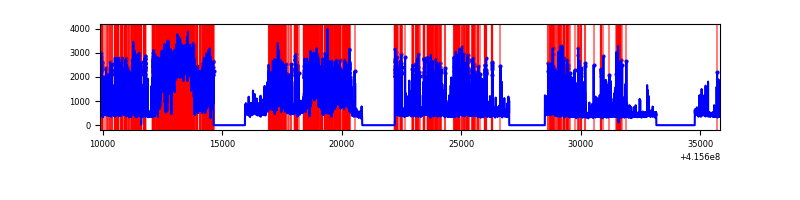 |
Top three noisy pixels from each quadrant. If the there are fewer than three noisy pixels in the level2.evt file, extra rows are filled as -1
| Pixel properties | Quadrant properties | ||||||
|---|---|---|---|---|---|---|---|
| Quadrant | DetID | PixID | Counts | Sigma | Mean | Median | Sigma |
| A | 10 | 83 | 1577544 | 3527.84 | 2198 | 2156 | 446.6 |
| A | 13 | 248 | 477629 | 1064.75 | 2198 | 2156 | 446.6 |
| A | 6 | 10 | 50236 | 107.67 | 2198 | 2156 | 446.6 |
| B | 5 | 255 | 821025 | 1973.86 | 2181 | 2118 | 414.9 |
| B | 0 | 229 | 253287 | 605.41 | 2181 | 2118 | 414.9 |
| B | 5 | 32 | 162674 | 387.0 | 2181 | 2118 | 414.9 |
| C | 9 | 187 | 31983523 | 85337.58 | 1634 | 1646 | 374.8 |
| C | 15 | 214 | 650106 | 1730.29 | 1634 | 1646 | 374.8 |
| C | 14 | 254 | 26081 | 65.2 | 1634 | 1646 | 374.8 |
| D | 12 | 227 | 9786136 | 19826.39 | 2030 | 1978 | 493.5 |
| D | 13 | 249 | 777506 | 1571.51 | 2030 | 1978 | 493.5 |
| D | 12 | 233 | 514450 | 1038.46 | 2030 | 1978 | 493.5 |
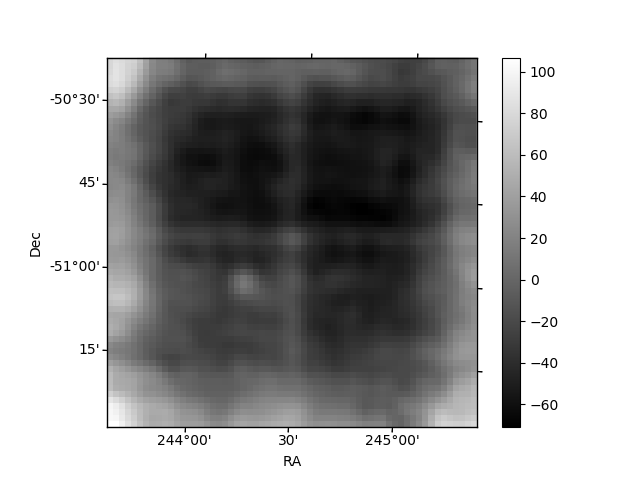
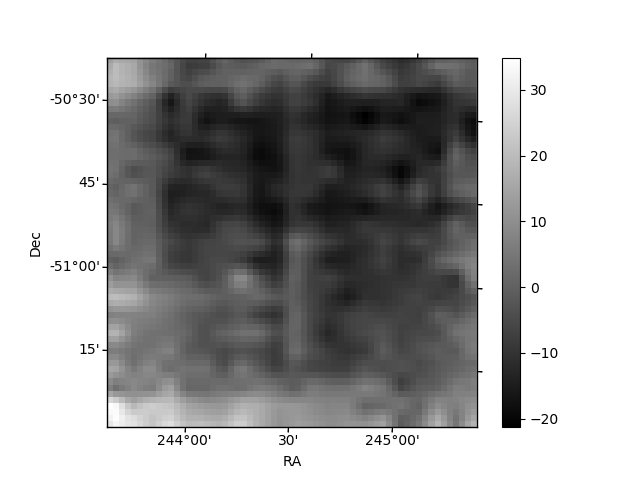
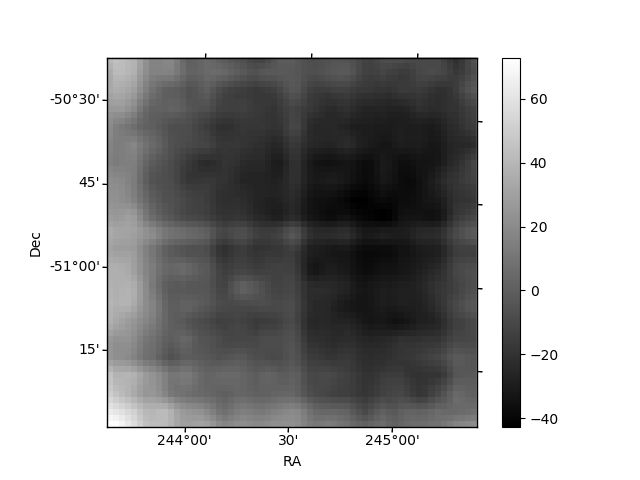
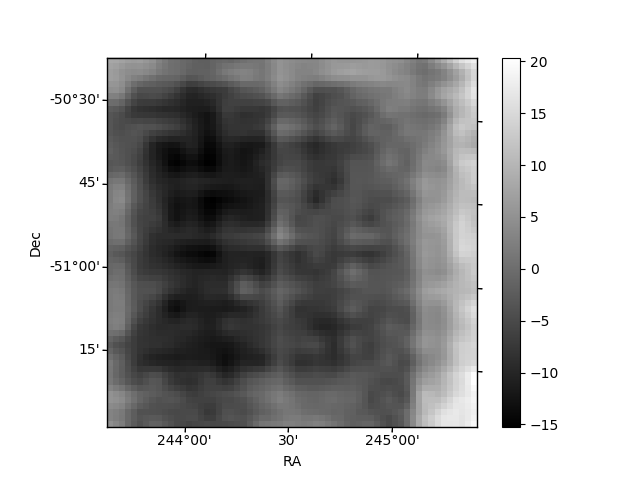
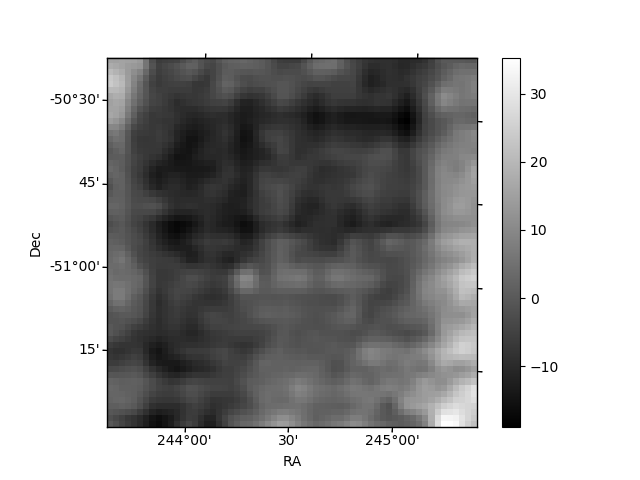
Histogram calculated using DETX and DETY for each event in the final _common_clean file
| Quadrant A | 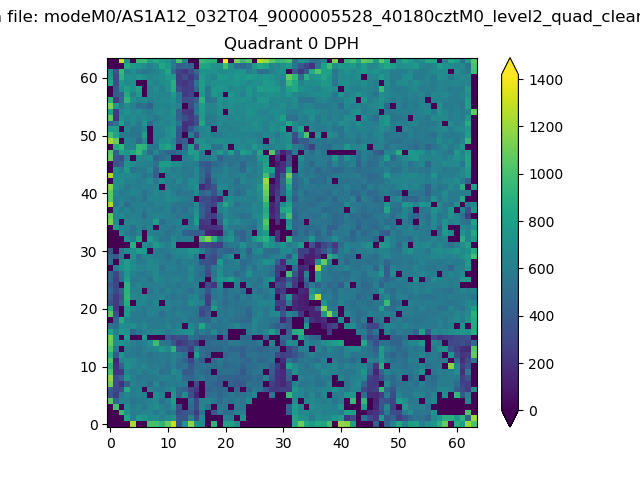 |
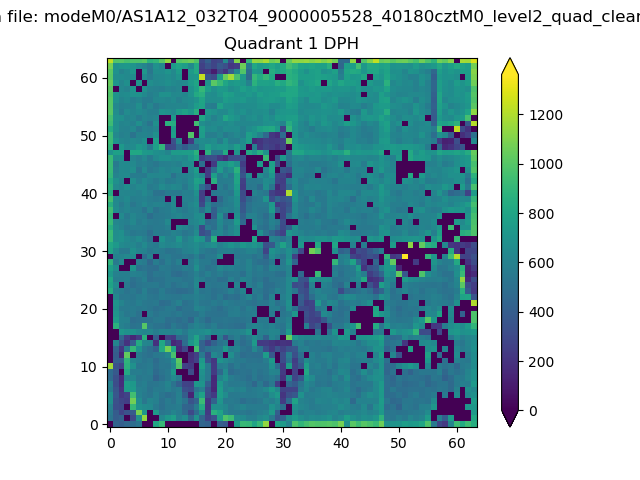 |
Quadrant B |
|---|---|---|---|
| Quadrant D | 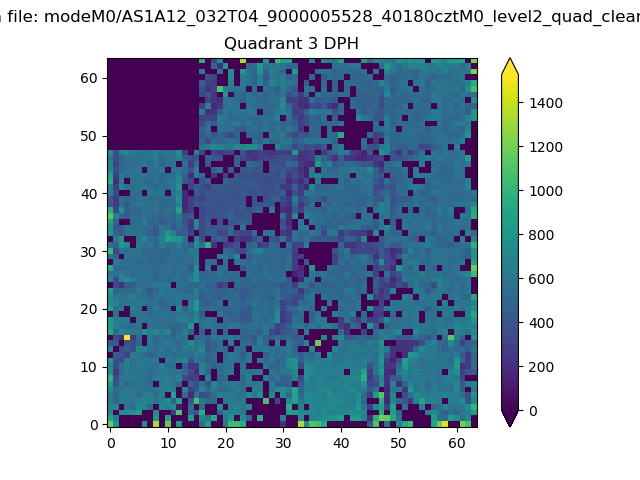 |
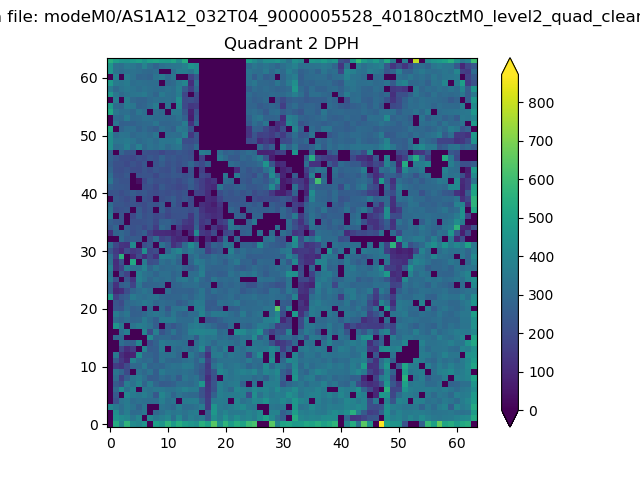 |
Quadrant C |
| Plot type | Count rate plots | Images |
|---|---|---|
| Comparison with Poisson distribution Blue bars denote a histogram of data divided into 1 sec bins. Red curve is a Poisson curve with rate = median count rate of data. |
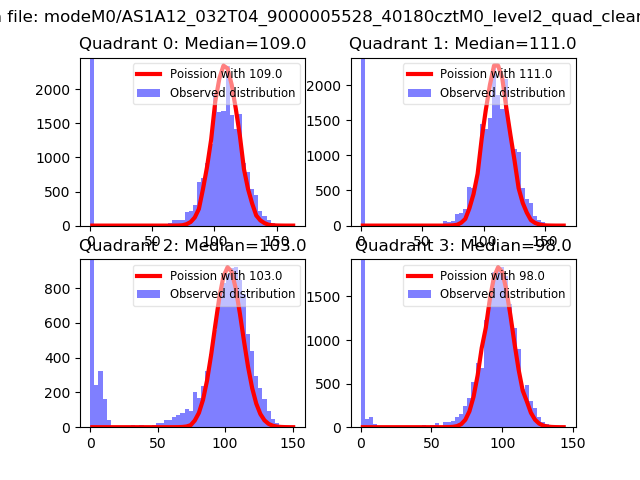 |
 |
| Quadrant-wise count rates Data is divided into 100 sec bins |
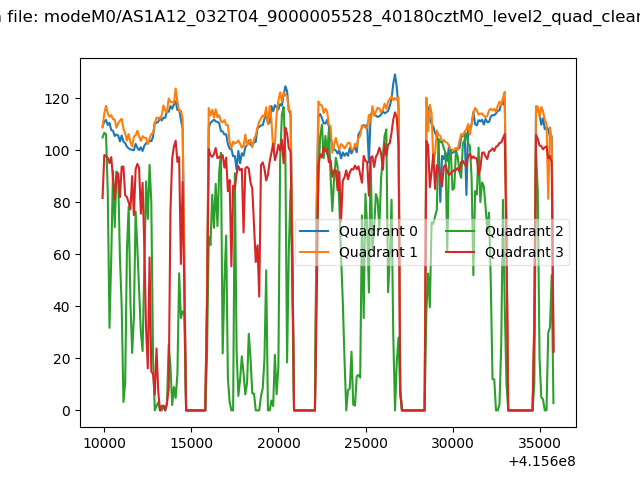 |
|
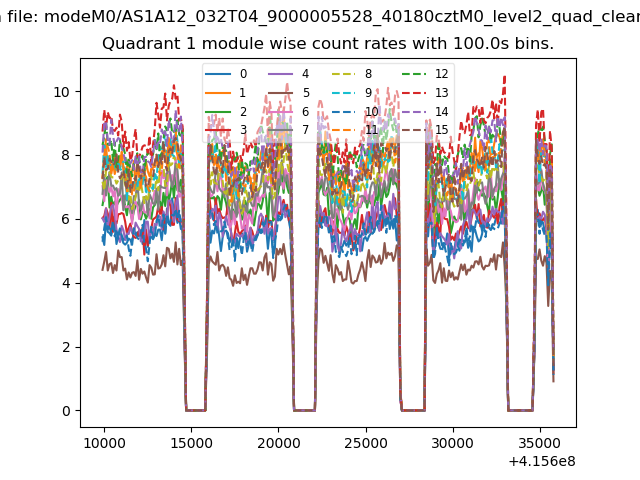
| Module-wise count rates for Quadrant A Data is divided into 100 sec bins |
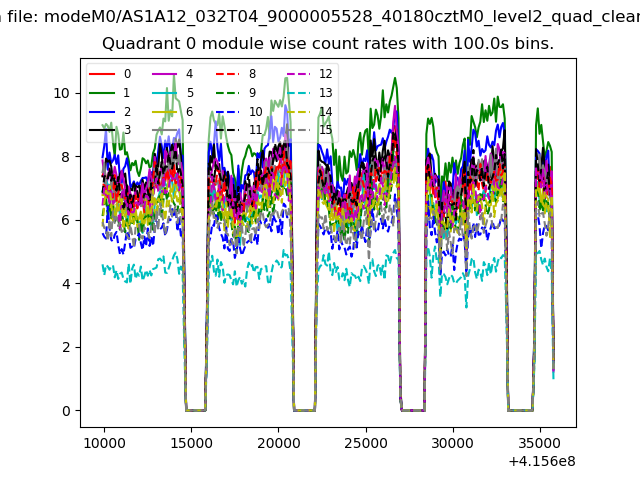 |
 |
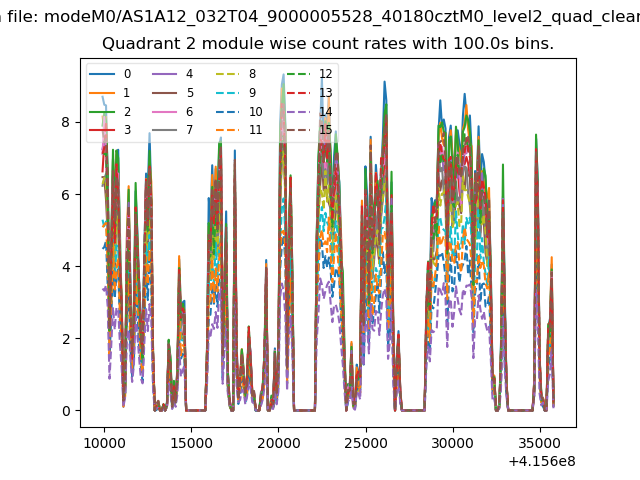
| Module-wise count rates for Quadrant B Data is divided into 100 sec bins |
 |
 |
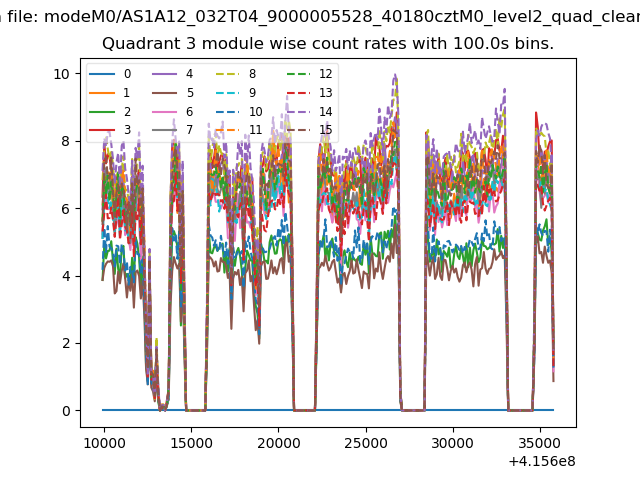
| Module-wise count rates for Quadrant C Data is divided into 100 sec bins |
 |
 |
| Module-wise count rates for Quadrant D Data is divided into 100 sec bins |
 |
 |
| Parameter | Plot |
|---|---|
| CZT HV Monitor | 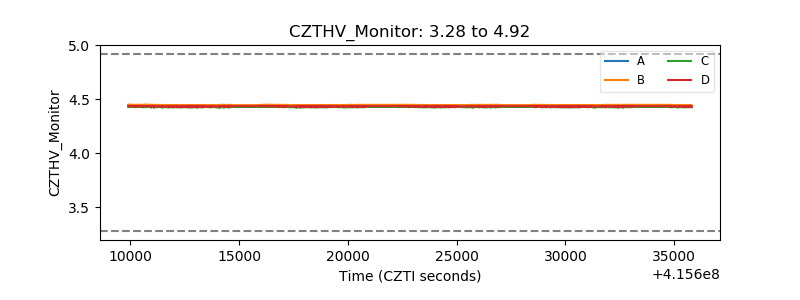 |
| D_VDD | 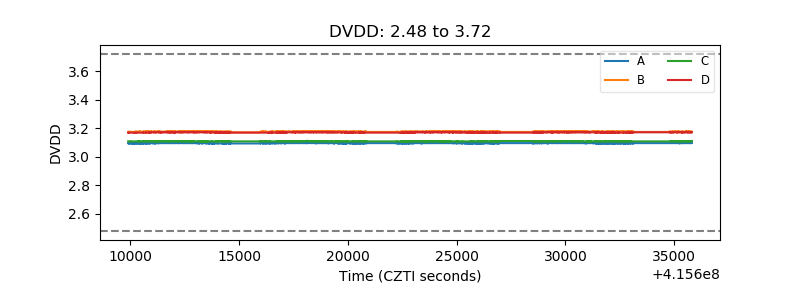 |
| Temperature 1 | 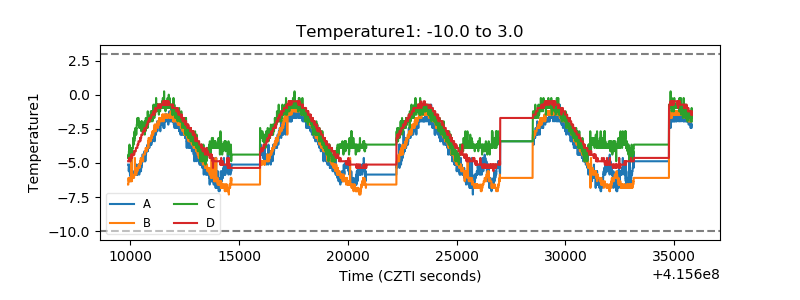 |
| Veto HV Monitor | 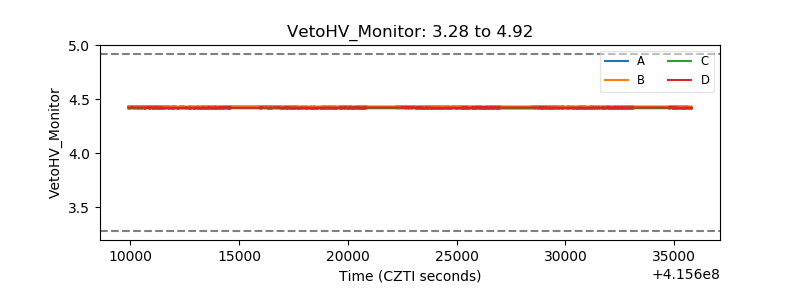 |
| Veto LLD |  |
| Alpha Counter | 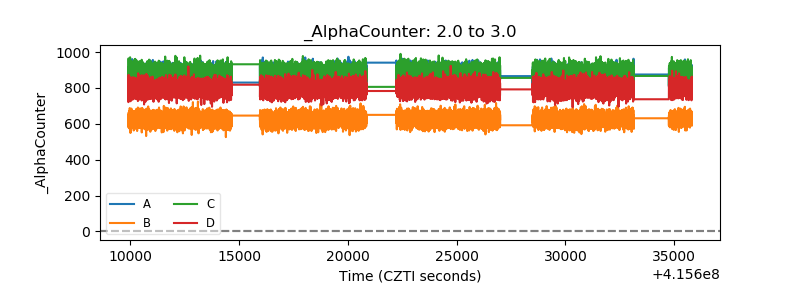 |
| _CPM_Rate | 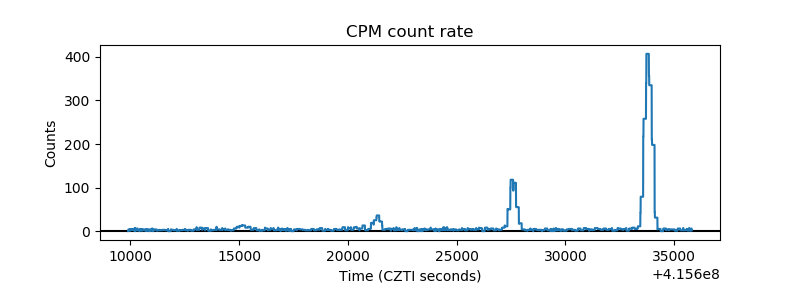 |
| CZT Counter | 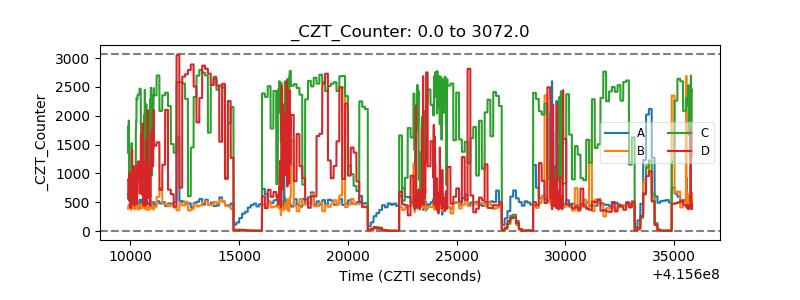 |
| +2.5 Volts monitor | 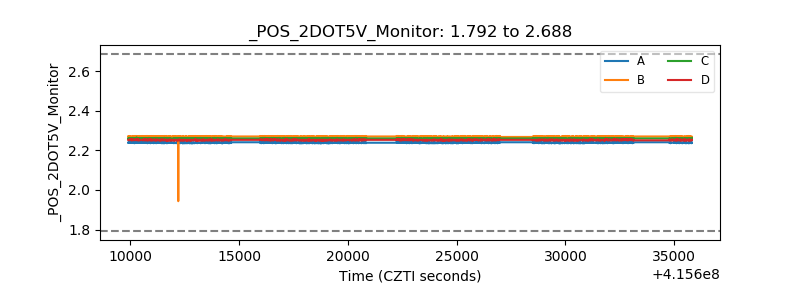 |
| +5 Volts monitor | 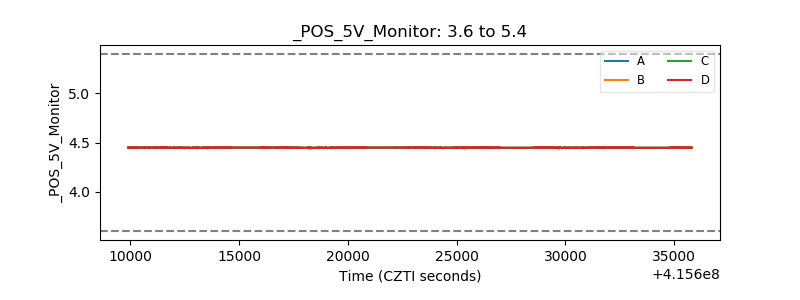 |
| _ROLL_ROT | 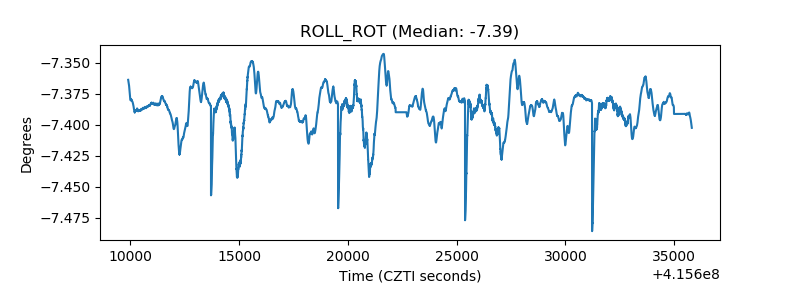 |
| _Roll_DEC | 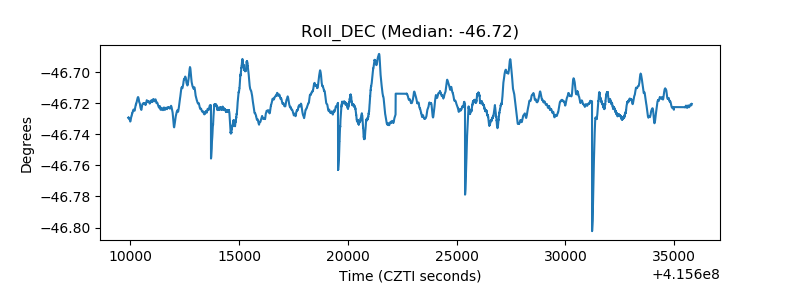 |
| _Roll_RA | 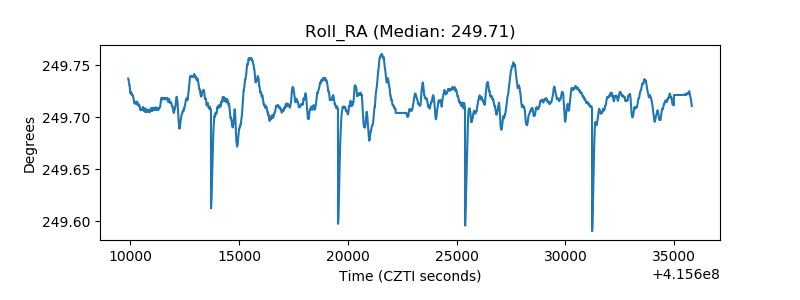 |
| Veto Counter | 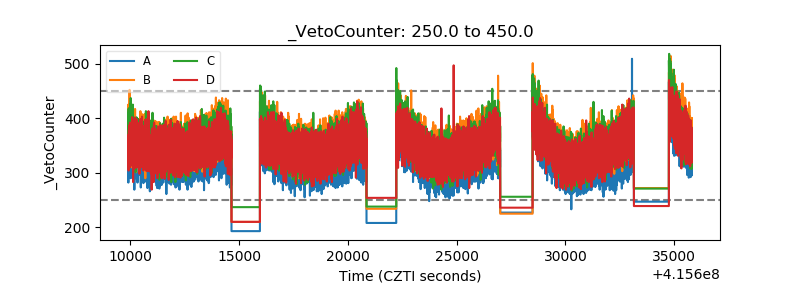 |