| Param | Original file | Final file |
|---|---|---|
| Filename | modeM0/AS1A12_032T04_9000005528_40182cztM0_level2.fits | modeM0/AS1A12_032T04_9000005528_40182cztM0_level2_quad_clean.evt |
| Size (bytes) | 476,513,280 | 87,848,640 |
| Size | 454.4 MB | 83.8 MB |
| Events in quadrant A | 3,212,488 | 631,457 |
| Events in quadrant B | 3,503,115 | 627,866 |
| Events in quadrant C | 7,722,134 | 439,969 |
| Events in quadrant D | 2,770,853 | 573,098 |
| Mode SS | |||
|---|---|---|---|
| Quadrant | BADHDUFLAG | Total packets | Discarded packets |
| A | 0 | 114 | 0 |
| B | 0 | 114 | 0 |
| C | 0 | 114 | 0 |
| D | 0 | 114 | 0 |
| Mode M0 | |||
|---|---|---|---|
| Quadrant | BADHDUFLAG | Total packets | Discarded packets |
| A | 0 | 12974 | 3 |
| B | 0 | 14187 | 2 |
| C | 0 | 26700 | 2 |
| D | 0 | 12194 | 2 |
| Mode M9 | |||
|---|---|---|---|
| Quadrant | BADHDUFLAG | Total packets | Discarded packets |
| A | 0 | 20 | 0 |
| B | 0 | 20 | 0 |
| C | 0 | 20 | 0 |
| D | 0 | 21 | 0 |
| Quadrant | Total seconds | Saturated seconds | Saturation percentage |
|---|---|---|---|
| A | 5534 | 69 | 1.246838% |
| B | 5534 | 212 | 3.830864% |
| C | 5534 | 1825 | 32.977954% |
| D | 5534 | 48 | 0.867365% |
Noise dominated data is calculated using 1-second bins in cleaned event files. If a bin has >2000 counts, and if more than 50% of those come from <1% of pixels, then it is considered to be noise-dominated and hence unusable.
| Quadrant | # 1 sec bins | Bins with >0 counts | Bins with >2000 counts | High rate bins dominated by noise | Noise dominated (total time) | Noise dominated (detector-on time) | Marked lightcurve |
|---|---|---|---|---|---|---|---|
| A | 7267 | 5535 | 31 | 31 | 0.43% | 0.56% | 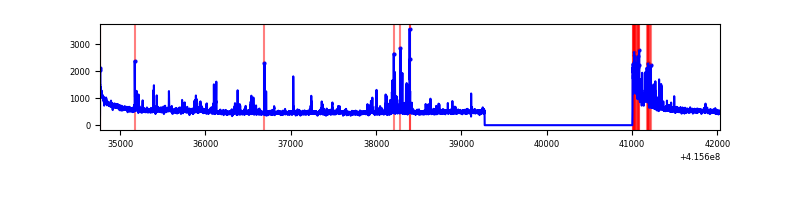 |
| B | 7267 | 5535 | 131 | 131 | 1.80% | 2.37% | 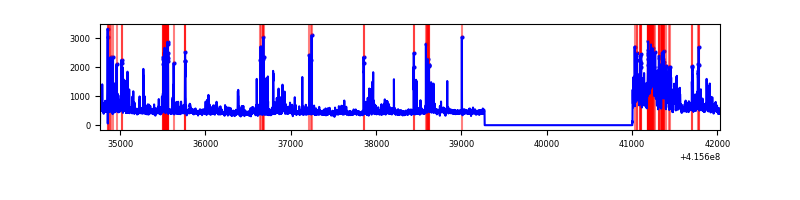 |
| C | 7267 | 5535 | 1775 | 1775 | 24.43% | 32.07% | 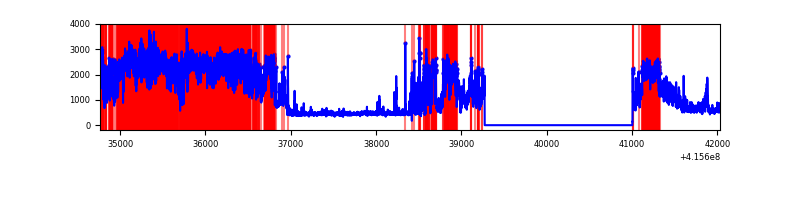 |
| D | 7267 | 5535 | 64 | 64 | 0.88% | 1.16% | 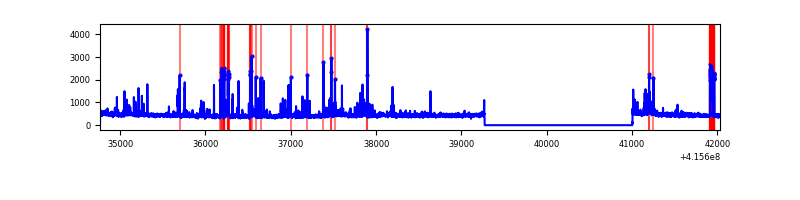 |
Top three noisy pixels from each quadrant. If the there are fewer than three noisy pixels in the level2.evt file, extra rows are filled as -1
| Pixel properties | Quadrant properties | ||||||
|---|---|---|---|---|---|---|---|
| Quadrant | DetID | PixID | Counts | Sigma | Mean | Median | Sigma |
| A | 10 | 83 | 518232 | 4173.15 | 610 | 597 | 124.0 |
| A | 13 | 248 | 289847 | 2331.92 | 610 | 597 | 124.0 |
| A | 6 | 10 | 24513 | 192.81 | 610 | 597 | 124.0 |
| B | 0 | 229 | 624147 | 5403.56 | 602 | 585 | 115.4 |
| B | 5 | 255 | 152078 | 1312.78 | 602 | 585 | 115.4 |
| B | 5 | 32 | 95573 | 823.13 | 602 | 585 | 115.4 |
| C | 9 | 187 | 5443888 | 44630.43 | 522 | 526 | 122.0 |
| C | 15 | 214 | 207241 | 1694.87 | 522 | 526 | 122.0 |
| C | 0 | 10 | 15730 | 124.66 | 522 | 526 | 122.0 |
| D | 12 | 227 | 265728 | 1831.38 | 595 | 579 | 144.8 |
| D | 13 | 249 | 75292 | 516.04 | 595 | 579 | 144.8 |
| D | 12 | 218 | 38256 | 260.23 | 595 | 579 | 144.8 |
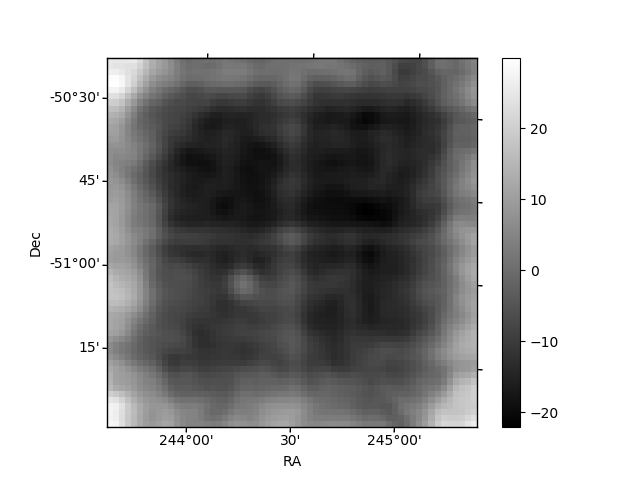
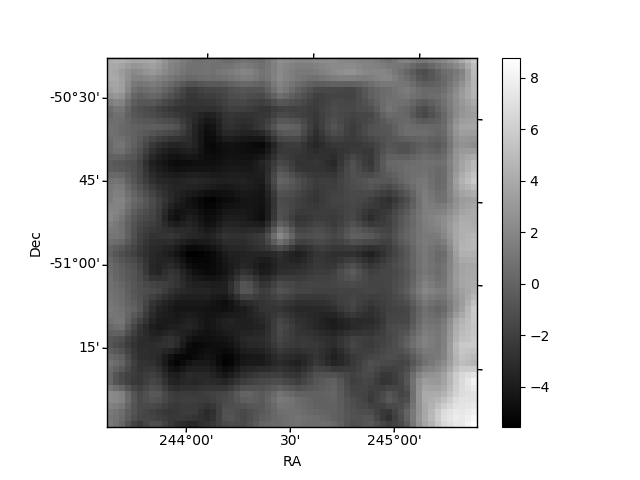
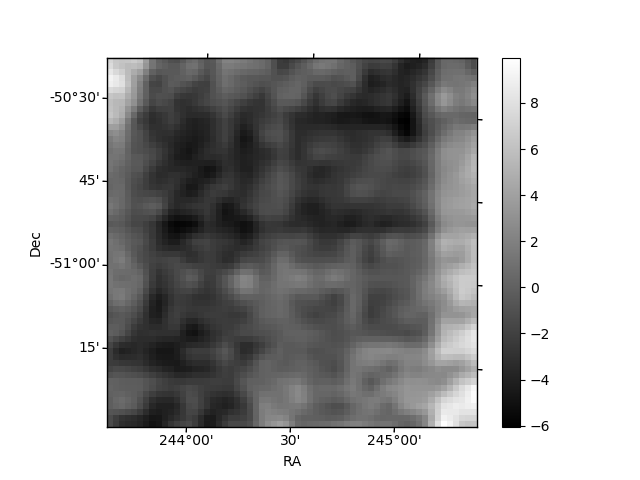
Histogram calculated using DETX and DETY for each event in the final _common_clean file
| Quadrant A | 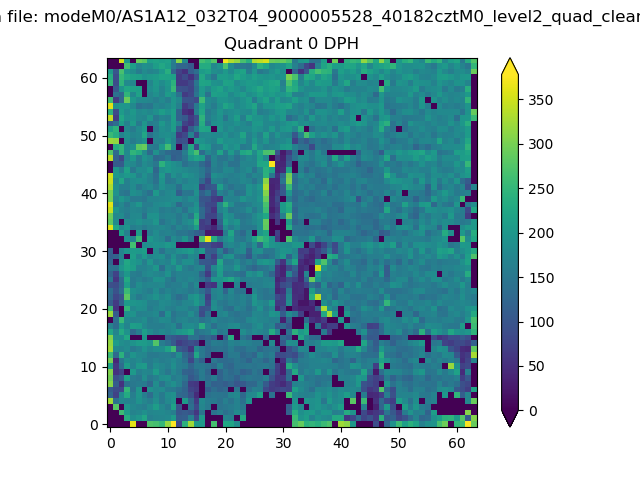 |
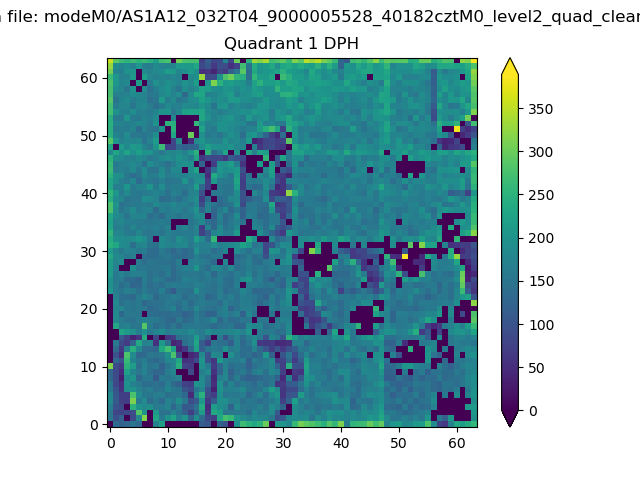 |
Quadrant B |
|---|---|---|---|
| Quadrant D | 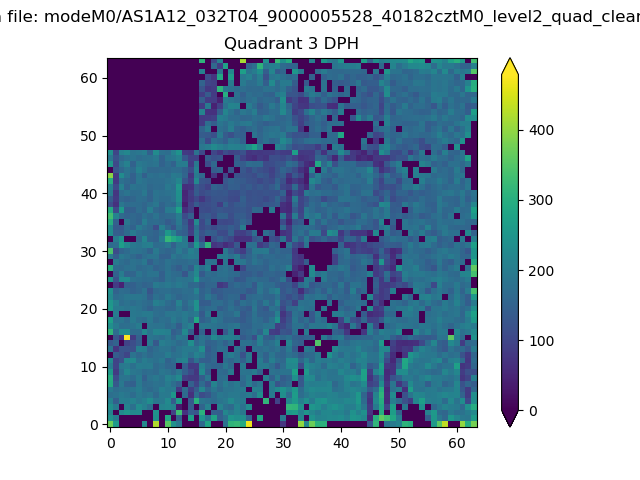 |
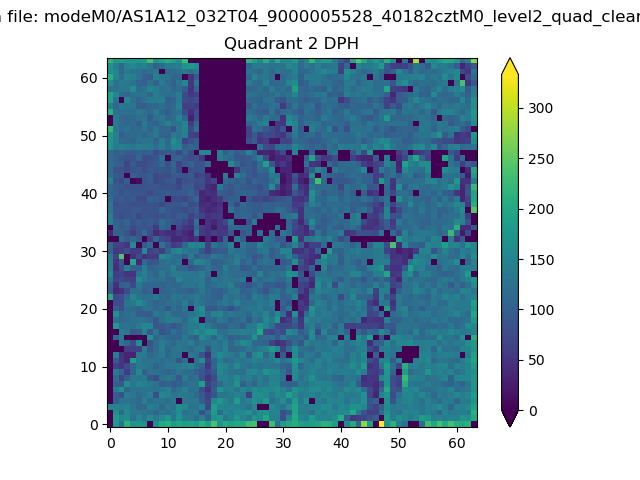 |
Quadrant C |
| Plot type | Count rate plots | Images |
|---|---|---|
| Comparison with Poisson distribution Blue bars denote a histogram of data divided into 1 sec bins. Red curve is a Poisson curve with rate = median count rate of data. |
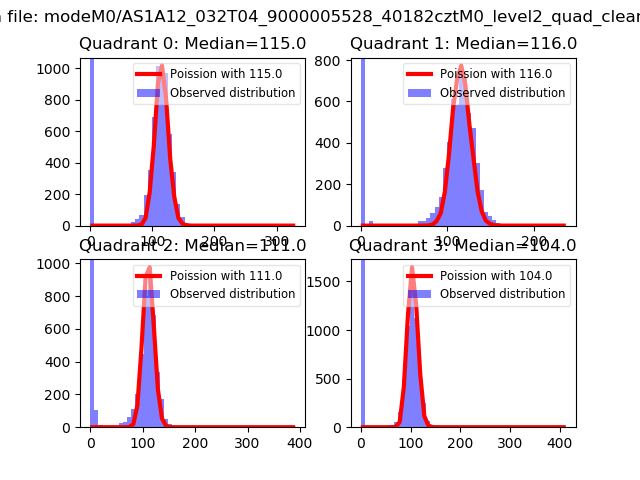 |
 |
| Quadrant-wise count rates Data is divided into 100 sec bins |
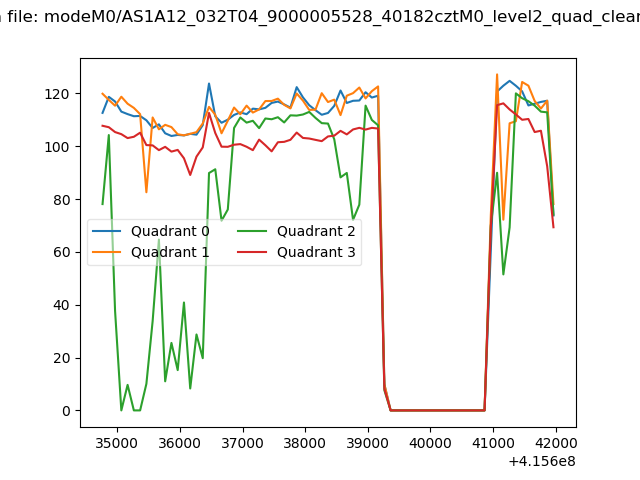 |
|
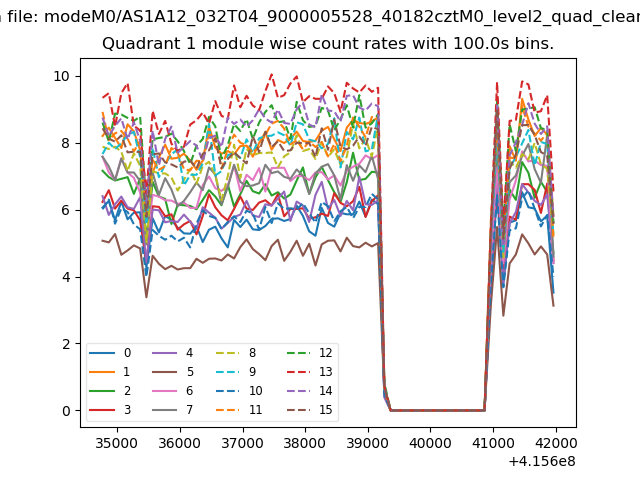
| Module-wise count rates for Quadrant A Data is divided into 100 sec bins |
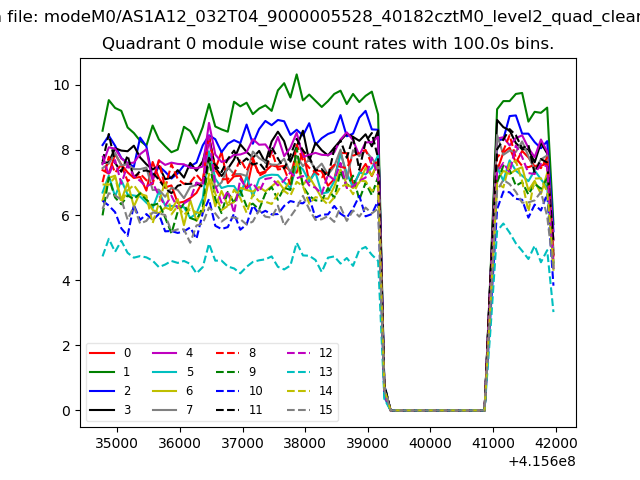 |
 |
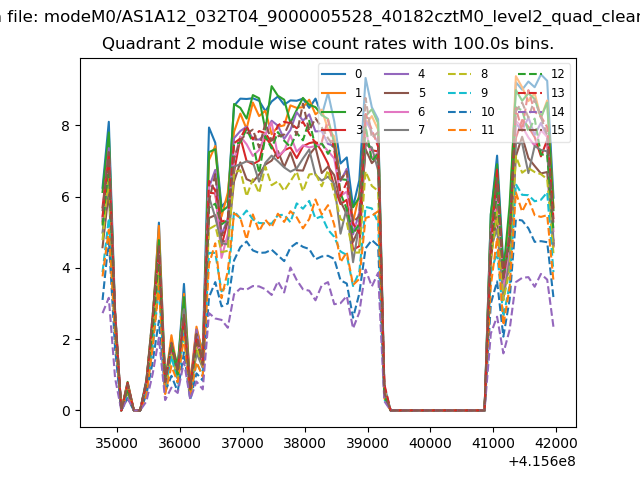
| Module-wise count rates for Quadrant B Data is divided into 100 sec bins |
 |
 |
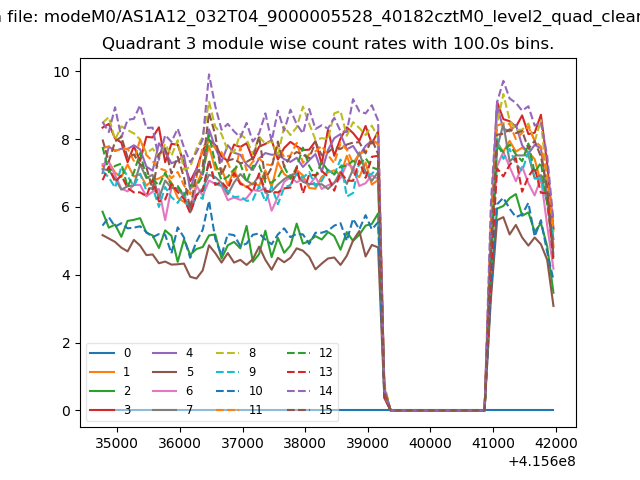
| Module-wise count rates for Quadrant C Data is divided into 100 sec bins |
 |
 |
| Module-wise count rates for Quadrant D Data is divided into 100 sec bins |
 |
 |
| Parameter | Plot |
|---|---|
| CZT HV Monitor | 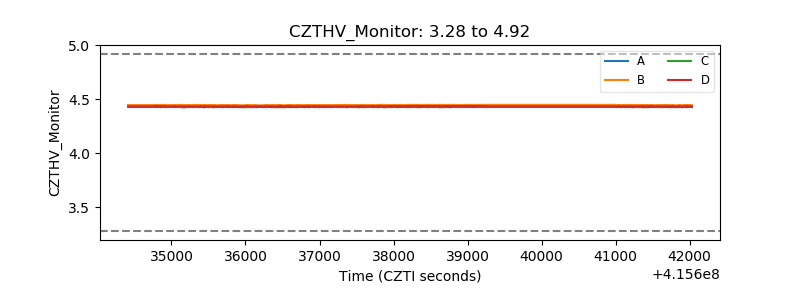 |
| D_VDD | 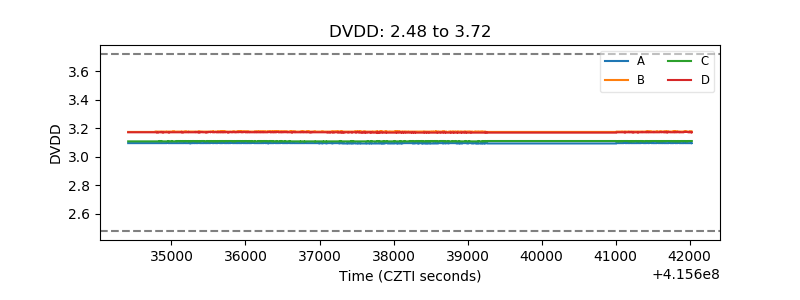 |
| Temperature 1 | 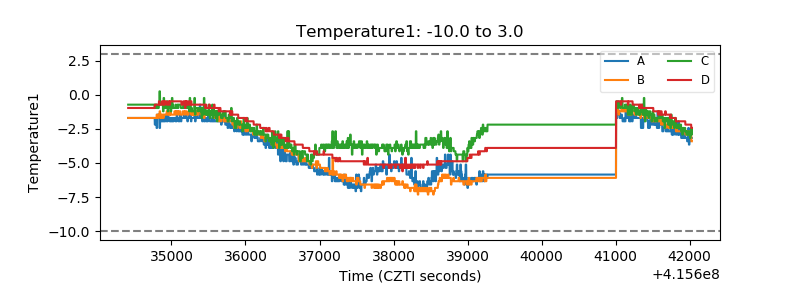 |
| Veto HV Monitor | 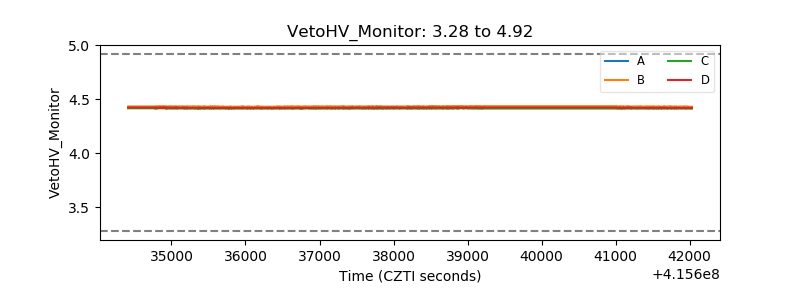 |
| Veto LLD |  |
| Alpha Counter | 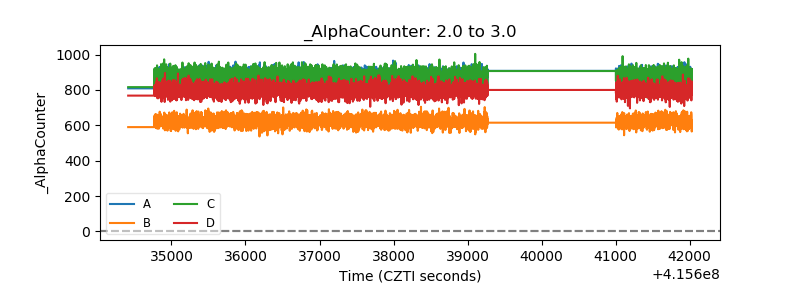 |
| _CPM_Rate | 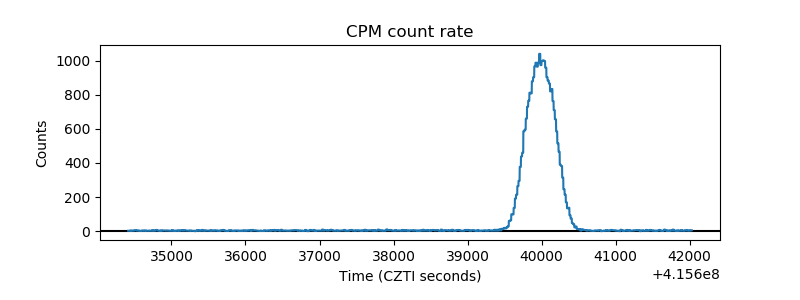 |
| CZT Counter | 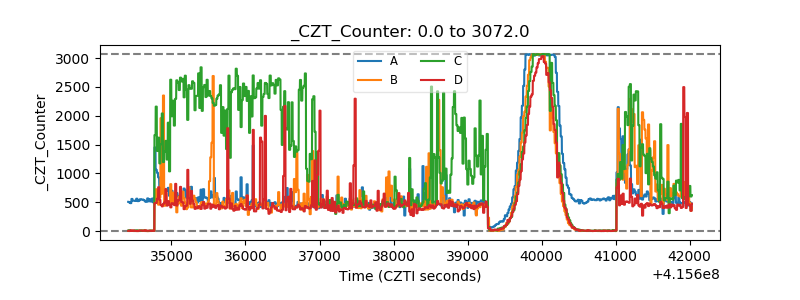 |
| +2.5 Volts monitor | 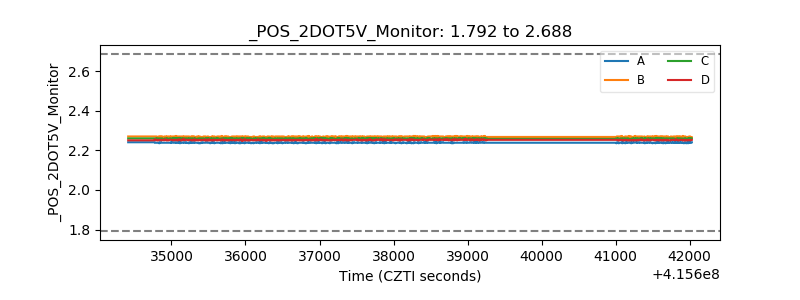 |
| +5 Volts monitor | 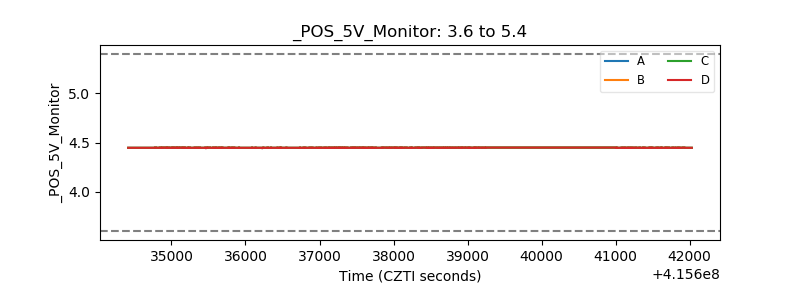 |
| _ROLL_ROT | 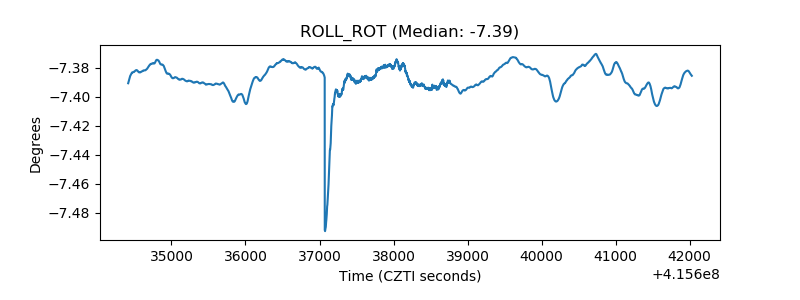 |
| _Roll_DEC | 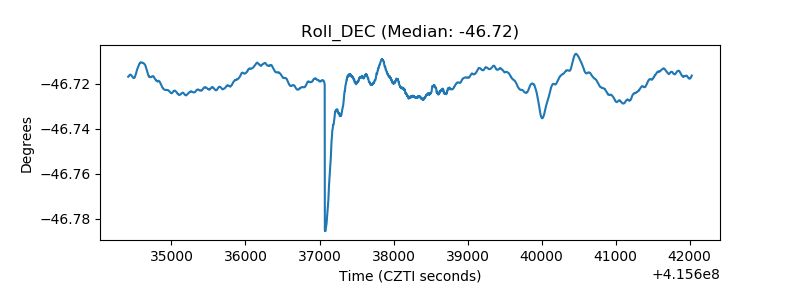 |
| _Roll_RA | 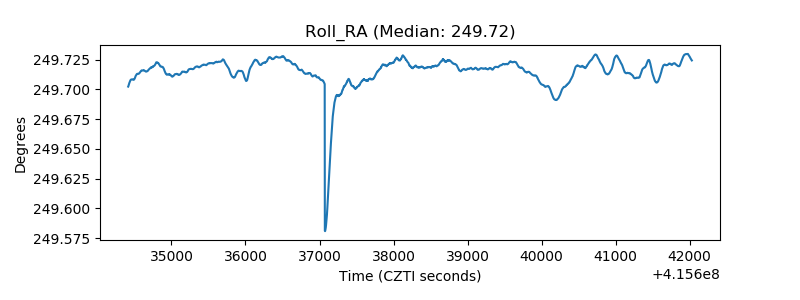 |
| Veto Counter | 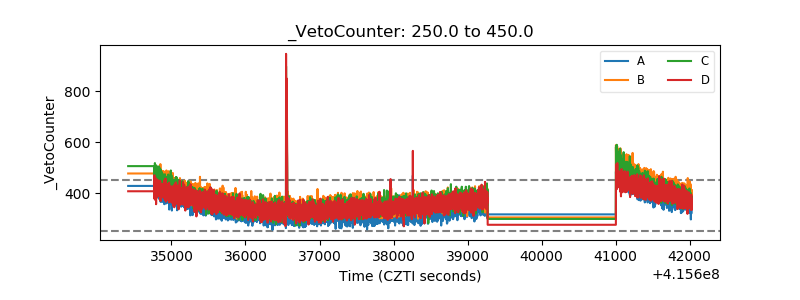 |