| Param | Original file | Final file |
|---|---|---|
| Filename | modeM0/AS1A12_032T04_9000005528_40183cztM0_level2.fits | modeM0/AS1A12_032T04_9000005528_40183cztM0_level2_quad_clean.evt |
| Size (bytes) | 385,174,080 | 92,096,640 |
| Size | 367.3 MB | 87.8 MB |
| Events in quadrant A | 3,042,764 | 634,891 |
| Events in quadrant B | 3,478,829 | 633,106 |
| Events in quadrant C | 4,190,356 | 591,678 |
| Events in quadrant D | 3,136,373 | 559,669 |
| Mode SS | |||
|---|---|---|---|
| Quadrant | BADHDUFLAG | Total packets | Discarded packets |
| A | 0 | 110 | 0 |
| B | 0 | 110 | 0 |
| C | 0 | 110 | 0 |
| D | 0 | 110 | 0 |
| Mode M0 | |||
|---|---|---|---|
| Quadrant | BADHDUFLAG | Total packets | Discarded packets |
| A | 0 | 12313 | 3 |
| B | 0 | 13957 | 2 |
| C | 0 | 15836 | 2 |
| D | 0 | 12960 | 2 |
| Mode M9 | |||
|---|---|---|---|
| Quadrant | BADHDUFLAG | Total packets | Discarded packets |
| A | 0 | 18 | 0 |
| B | 0 | 18 | 0 |
| C | 0 | 18 | 0 |
| D | 0 | 19 | 0 |
| Quadrant | Total seconds | Saturated seconds | Saturation percentage |
|---|---|---|---|
| A | 5267 | 57 | 1.082210% |
| B | 5267 | 196 | 3.721283% |
| C | 5267 | 282 | 5.354092% |
| D | 5267 | 145 | 2.752990% |
Noise dominated data is calculated using 1-second bins in cleaned event files. If a bin has >2000 counts, and if more than 50% of those come from <1% of pixels, then it is considered to be noise-dominated and hence unusable.
| Quadrant | # 1 sec bins | Bins with >0 counts | Bins with >2000 counts | High rate bins dominated by noise | Noise dominated (total time) | Noise dominated (detector-on time) | Marked lightcurve |
|---|---|---|---|---|---|---|---|
| A | 7119 | 5268 | 25 | 25 | 0.35% | 0.47% |  |
| B | 7119 | 5268 | 111 | 111 | 1.56% | 2.11% | 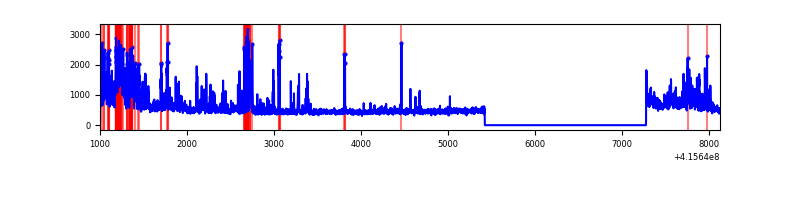 |
| C | 7119 | 5268 | 291 | 291 | 4.09% | 5.52% | 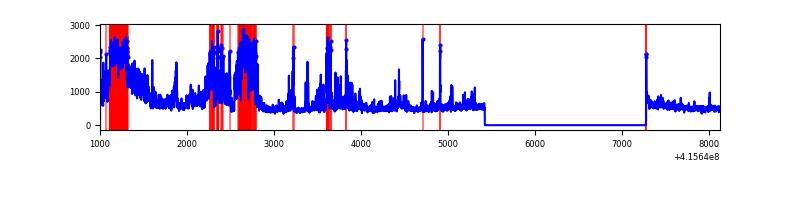 |
| D | 7119 | 5268 | 152 | 152 | 2.14% | 2.89% | 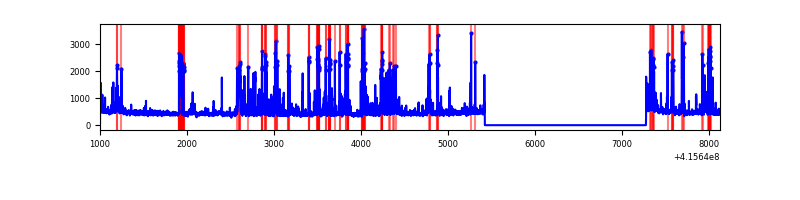 |
Top three noisy pixels from each quadrant. If the there are fewer than three noisy pixels in the level2.evt file, extra rows are filled as -1
| Pixel properties | Quadrant properties | ||||||
|---|---|---|---|---|---|---|---|
| Quadrant | DetID | PixID | Counts | Sigma | Mean | Median | Sigma |
| A | 10 | 83 | 492719 | 4080.55 | 596 | 587 | 120.6 |
| A | 13 | 248 | 161450 | 1333.81 | 596 | 587 | 120.6 |
| A | 2 | 79 | 70040 | 575.88 | 596 | 587 | 120.6 |
| B | 0 | 229 | 670270 | 5995.86 | 591 | 577 | 111.7 |
| B | 5 | 172 | 132933 | 1185.0 | 591 | 577 | 111.7 |
| B | 5 | 255 | 117213 | 1044.26 | 591 | 577 | 111.7 |
| C | 9 | 187 | 1663431 | 12497.48 | 574 | 579 | 133.1 |
| C | 15 | 214 | 219439 | 1644.88 | 574 | 579 | 133.1 |
| C | 14 | 254 | 31179 | 229.98 | 574 | 579 | 133.1 |
| D | 12 | 227 | 587492 | 4166.88 | 575 | 560 | 140.9 |
| D | 13 | 249 | 132857 | 939.23 | 575 | 560 | 140.9 |
| D | 12 | 218 | 74873 | 527.58 | 575 | 560 | 140.9 |
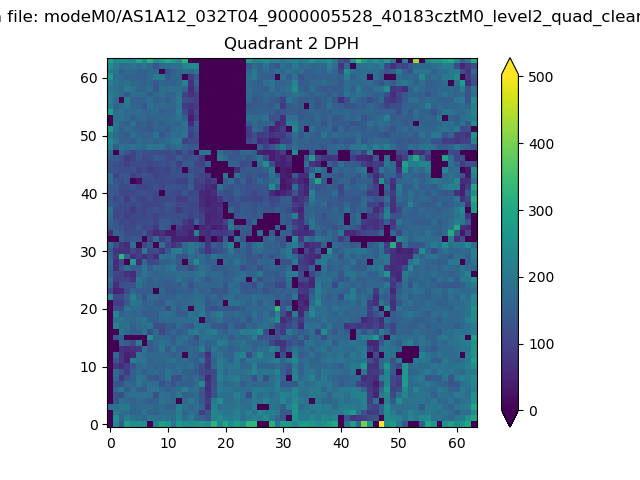
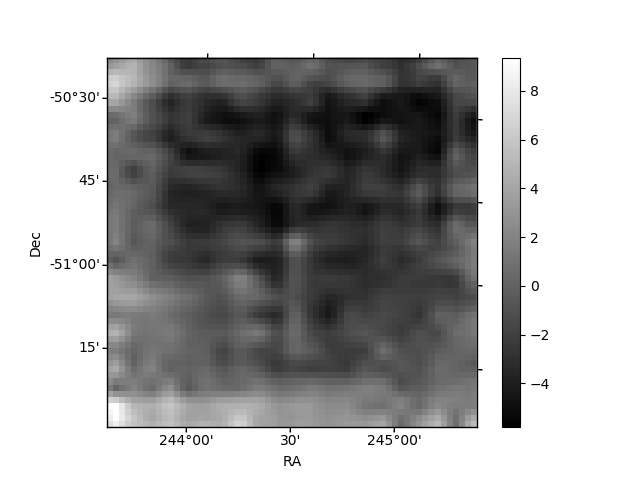
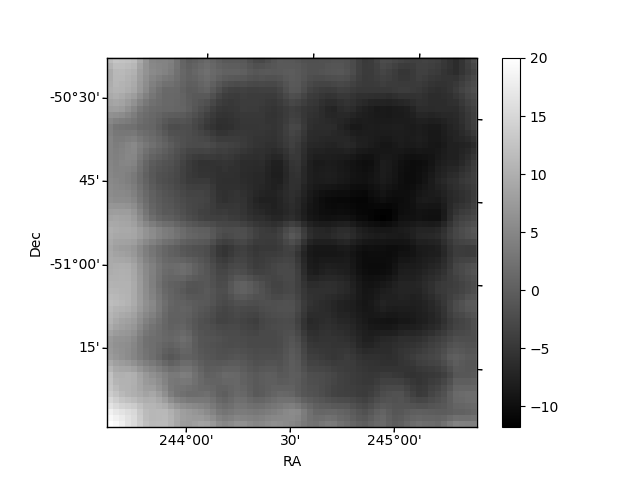
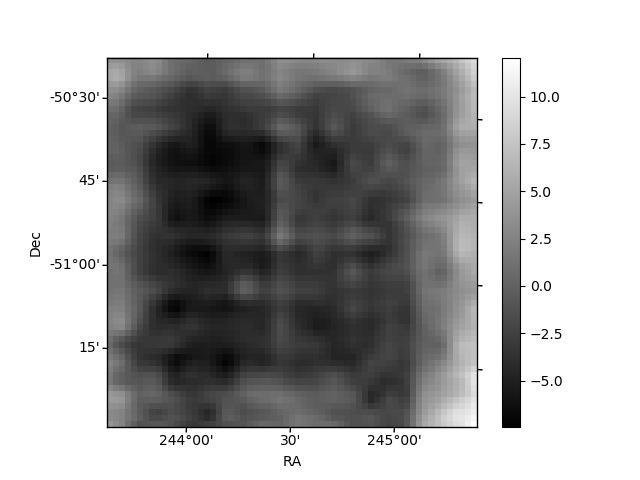
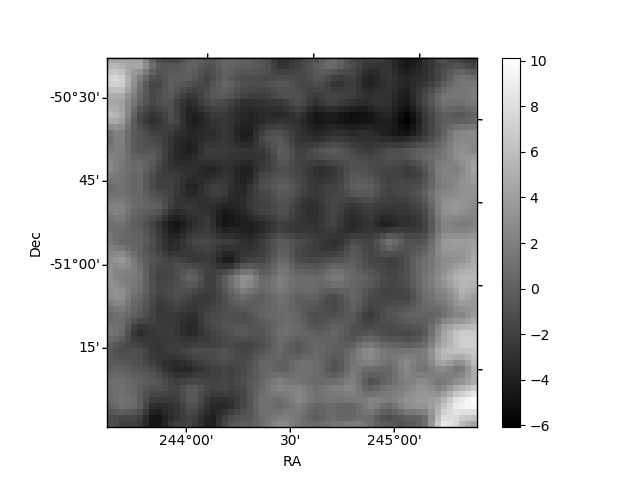
Histogram calculated using DETX and DETY for each event in the final _common_clean file
| Quadrant A | 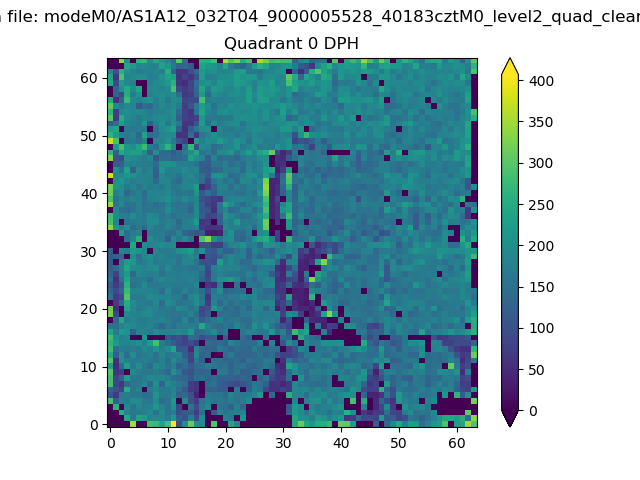 |
 |
Quadrant B |
|---|---|---|---|
| Quadrant D | 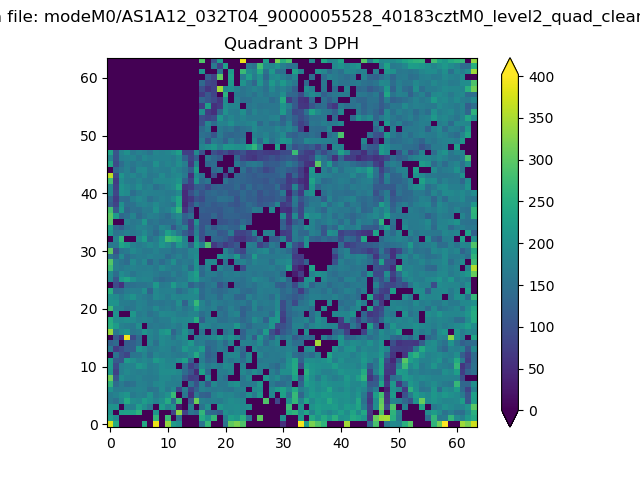 |
 |
Quadrant C |
| Plot type | Count rate plots | Images |
|---|---|---|
| Comparison with Poisson distribution Blue bars denote a histogram of data divided into 1 sec bins. Red curve is a Poisson curve with rate = median count rate of data. |
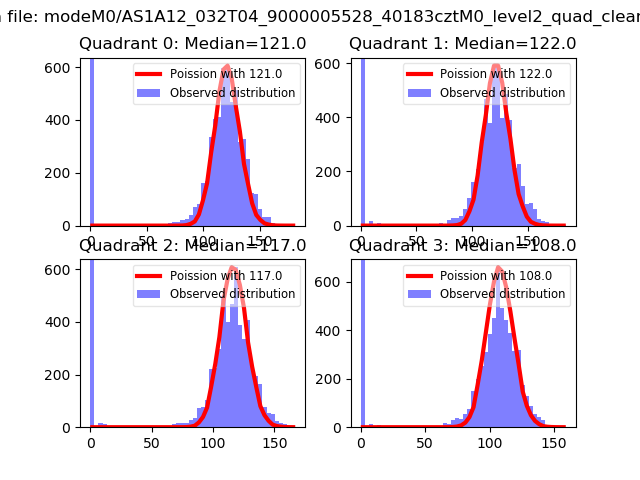 |
 |
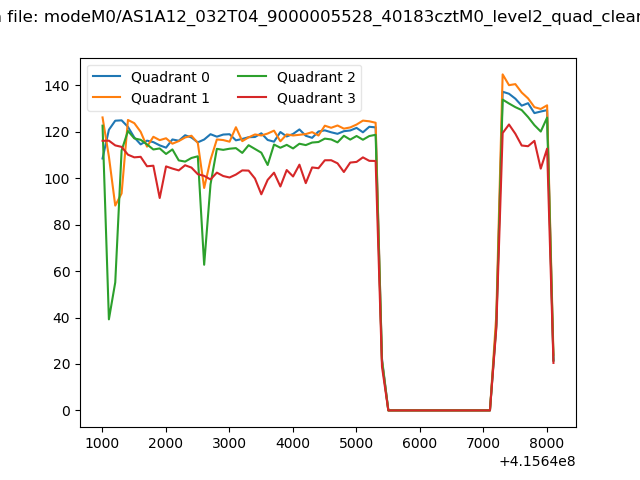
| Quadrant-wise count rates Data is divided into 100 sec bins |
 |
|
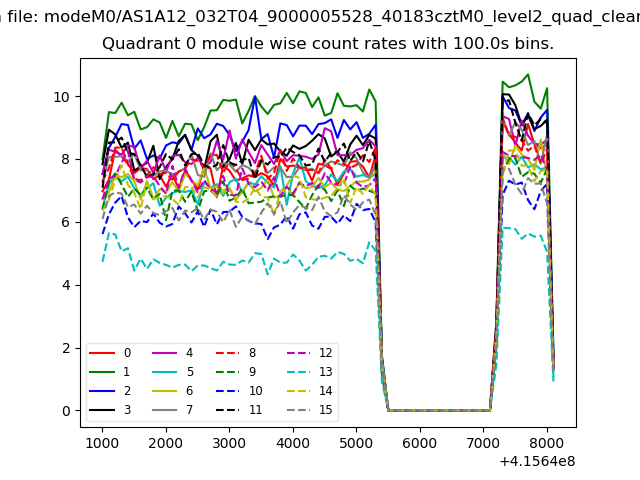
| Module-wise count rates for Quadrant A Data is divided into 100 sec bins |
 |
 |
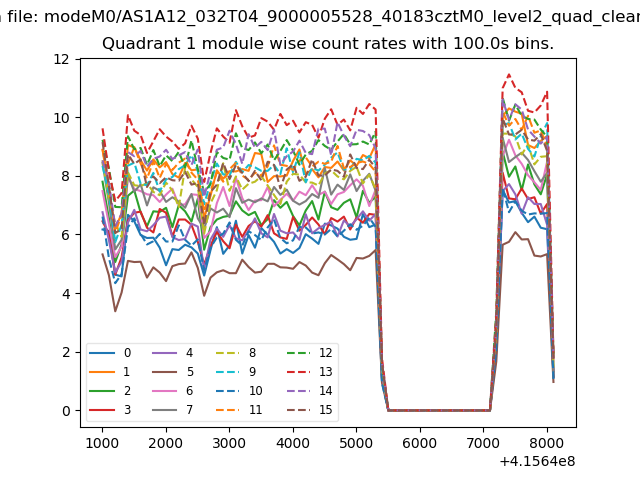
| Module-wise count rates for Quadrant B Data is divided into 100 sec bins |
 |
 |
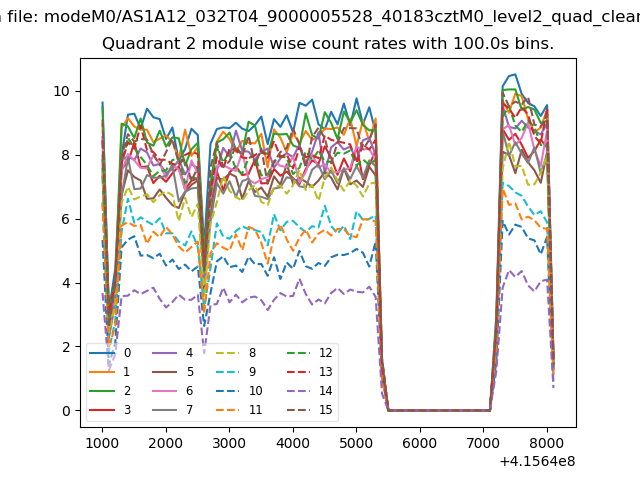
| Module-wise count rates for Quadrant C Data is divided into 100 sec bins |
 |
 |
| Module-wise count rates for Quadrant D Data is divided into 100 sec bins |
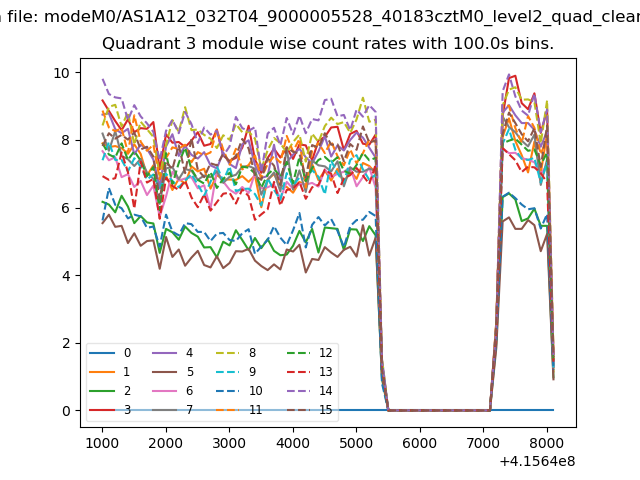 |
 |
| Parameter | Plot |
|---|---|
| CZT HV Monitor | 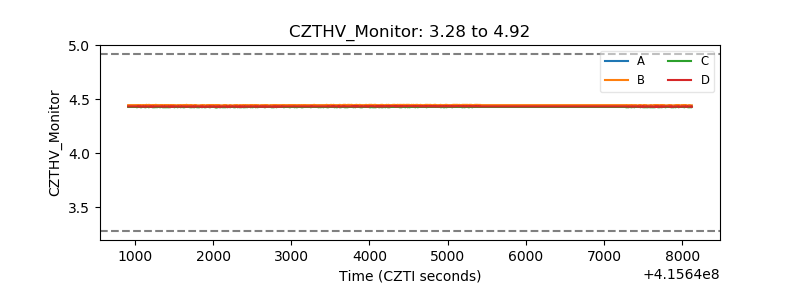 |
| D_VDD | 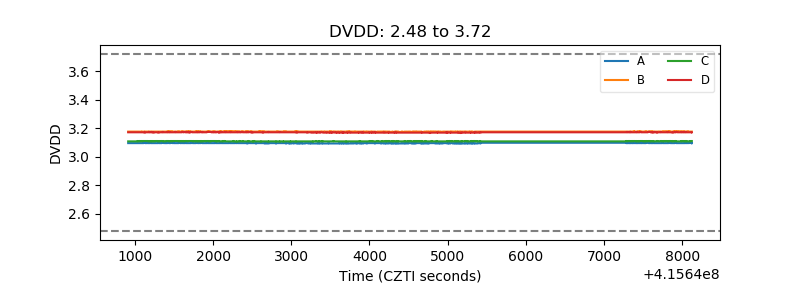 |
| Temperature 1 | 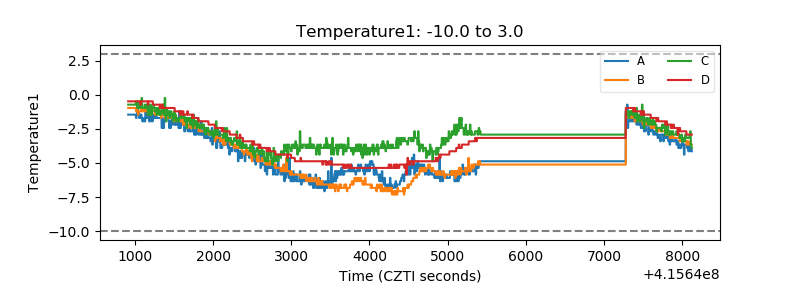 |
| Veto HV Monitor | 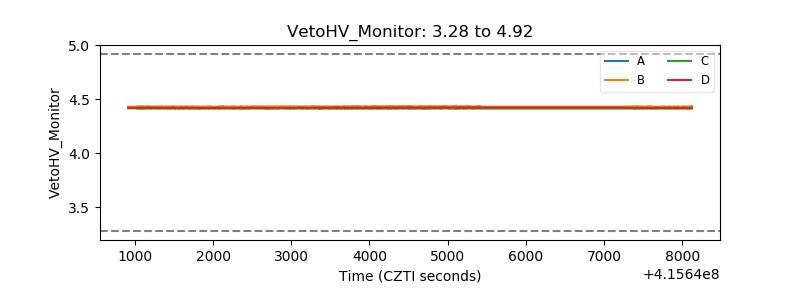 |
| Veto LLD | 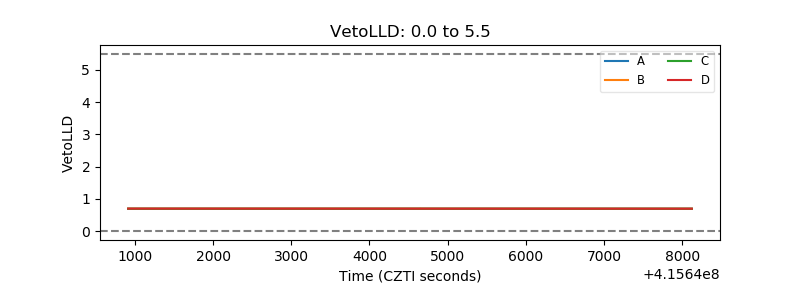 |
| Alpha Counter | 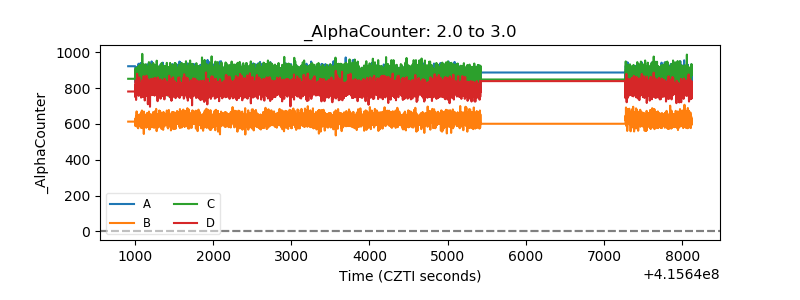 |
| _CPM_Rate | 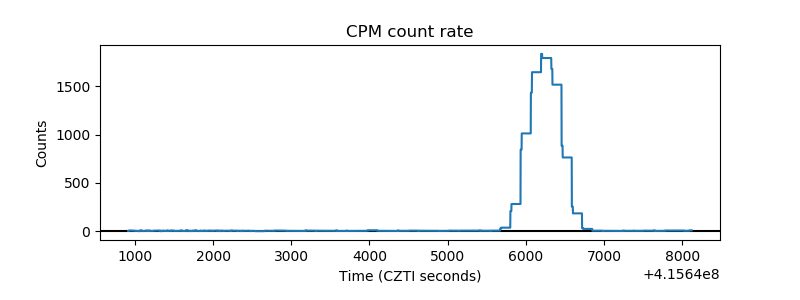 |
| CZT Counter | 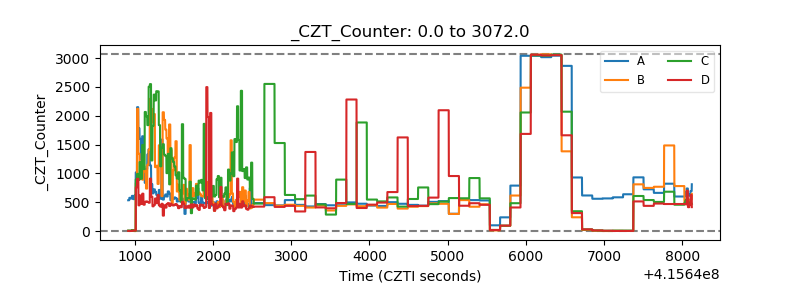 |
| +2.5 Volts monitor |  |
| +5 Volts monitor | 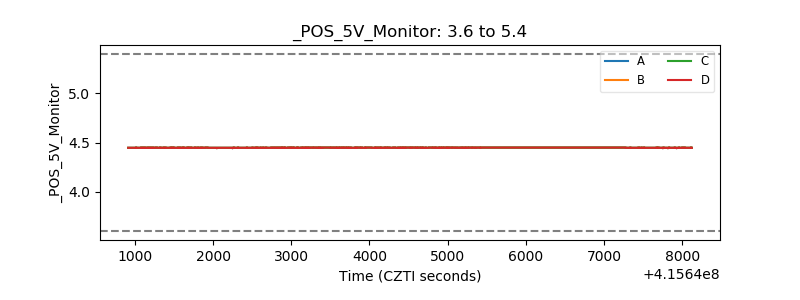 |
| _ROLL_ROT | 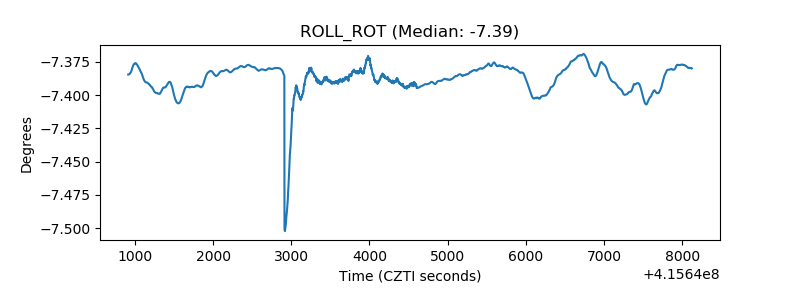 |
| _Roll_DEC | 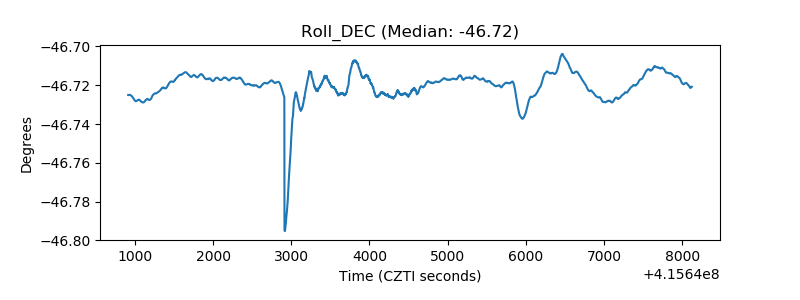 |
| _Roll_RA | 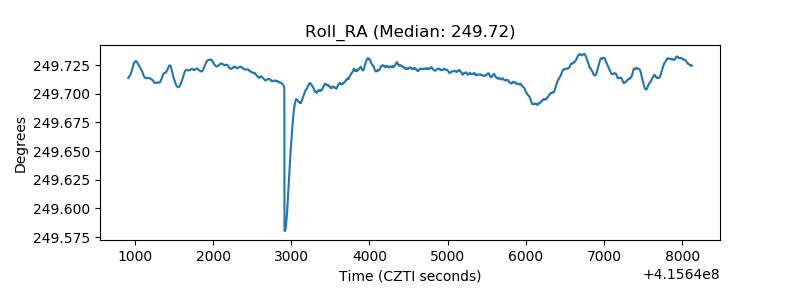 |
| Veto Counter | 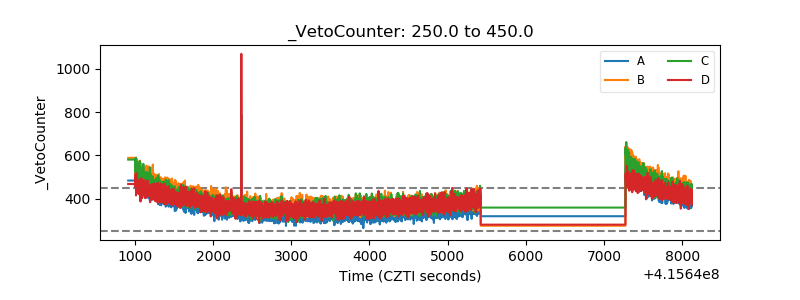 |