| Param | Original file | Final file |
|---|---|---|
| Filename | modeM0/AS1A12_032T04_9000005528_40184cztM0_level2.fits | modeM0/AS1A12_032T04_9000005528_40184cztM0_level2_quad_clean.evt |
| Size (bytes) | 488,851,200 | 104,725,440 |
| Size | 466.2 MB | 99.9 MB |
| Events in quadrant A | 3,601,114 | 741,793 |
| Events in quadrant B | 3,228,671 | 760,762 |
| Events in quadrant C | 6,244,237 | 614,398 |
| Events in quadrant D | 4,555,117 | 634,726 |
| Mode SS | |||
|---|---|---|---|
| Quadrant | BADHDUFLAG | Total packets | Discarded packets |
| A | 0 | 122 | 0 |
| B | 0 | 122 | 0 |
| C | 0 | 122 | 0 |
| D | 0 | 122 | 0 |
| Mode M0 | |||
|---|---|---|---|
| Quadrant | BADHDUFLAG | Total packets | Discarded packets |
| A | 0 | 14449 | 3 |
| B | 0 | 13568 | 2 |
| C | 0 | 22440 | 2 |
| D | 0 | 17698 | 2 |
| Mode M9 | |||
|---|---|---|---|
| Quadrant | BADHDUFLAG | Total packets | Discarded packets |
| A | 0 | 32 | 0 |
| B | 0 | 32 | 0 |
| C | 0 | 32 | 0 |
| D | 0 | 32 | 0 |
| Quadrant | Total seconds | Saturated seconds | Saturation percentage |
|---|---|---|---|
| A | 6007 | 58 | 0.965540% |
| B | 6007 | 53 | 0.882304% |
| C | 6007 | 1089 | 18.128850% |
| D | 6007 | 377 | 6.276011% |
Noise dominated data is calculated using 1-second bins in cleaned event files. If a bin has >2000 counts, and if more than 50% of those come from <1% of pixels, then it is considered to be noise-dominated and hence unusable.
| Quadrant | # 1 sec bins | Bins with >0 counts | Bins with >2000 counts | High rate bins dominated by noise | Noise dominated (total time) | Noise dominated (detector-on time) | Marked lightcurve |
|---|---|---|---|---|---|---|---|
| A | 18725 | 6009 | 47 | 47 | 0.25% | 0.78% | 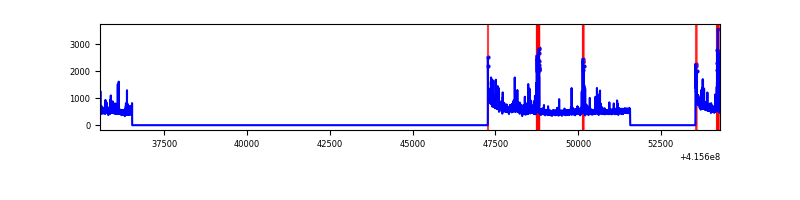 |
| B | 18725 | 6009 | 21 | 21 | 0.11% | 0.35% | 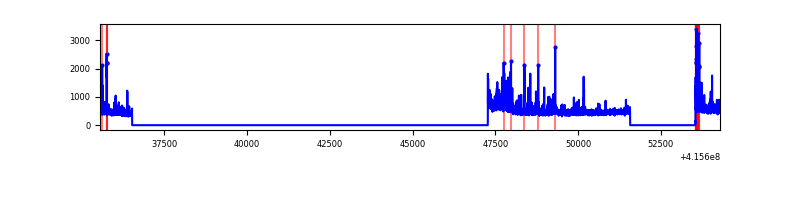 |
| C | 18725 | 6009 | 1091 | 1091 | 5.83% | 18.16% | 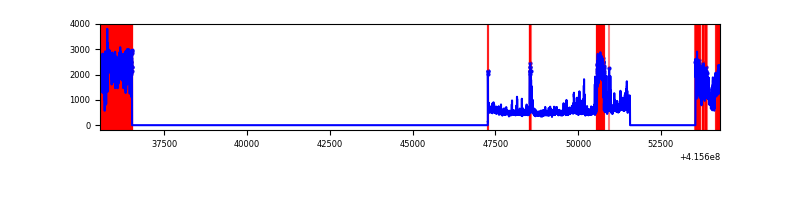 |
| D | 18725 | 6009 | 362 | 362 | 1.93% | 6.02% | 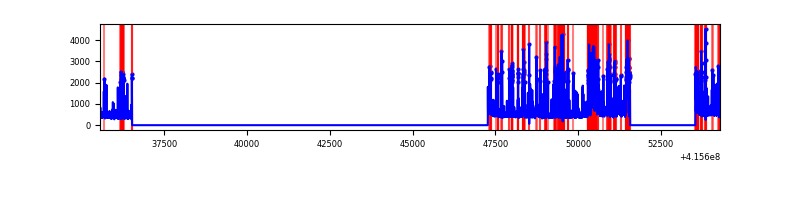 |
Top three noisy pixels from each quadrant. If the there are fewer than three noisy pixels in the level2.evt file, extra rows are filled as -1
| Pixel properties | Quadrant properties | ||||||
|---|---|---|---|---|---|---|---|
| Quadrant | DetID | PixID | Counts | Sigma | Mean | Median | Sigma |
| A | 10 | 83 | 546521 | 3958.41 | 685 | 675 | 137.9 |
| A | 13 | 248 | 229138 | 1656.79 | 685 | 675 | 137.9 |
| A | 2 | 79 | 146694 | 1058.91 | 685 | 675 | 137.9 |
| B | 0 | 229 | 230409 | 1792.84 | 687 | 670 | 128.1 |
| B | 5 | 255 | 108682 | 842.91 | 687 | 670 | 128.1 |
| B | 4 | 171 | 57971 | 447.17 | 687 | 670 | 128.1 |
| C | 9 | 187 | 3386365 | 23192.52 | 634 | 640 | 146.0 |
| C | 15 | 214 | 238309 | 1628.05 | 634 | 640 | 146.0 |
| C | 9 | 54 | 88969 | 605.06 | 634 | 640 | 146.0 |
| D | 12 | 227 | 1623090 | 10293.57 | 646 | 630 | 157.6 |
| D | 13 | 249 | 205012 | 1296.69 | 646 | 630 | 157.6 |
| D | 2 | 249 | 77629 | 488.51 | 646 | 630 | 157.6 |
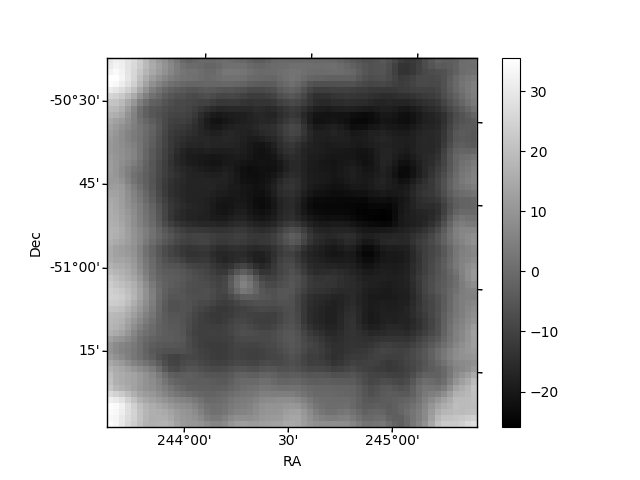
Histogram calculated using DETX and DETY for each event in the final _common_clean file
| Quadrant A | 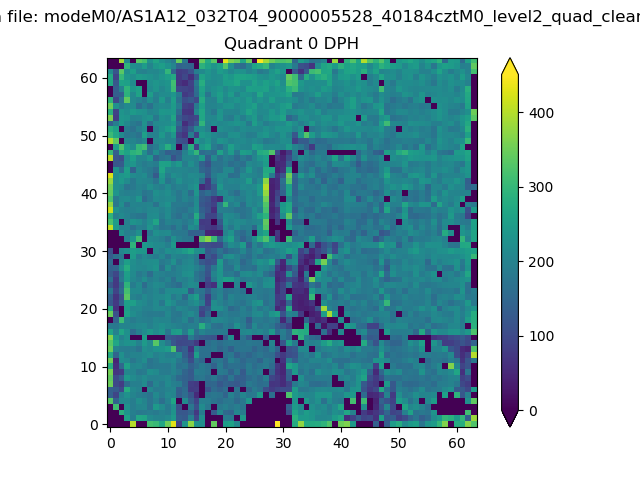 |
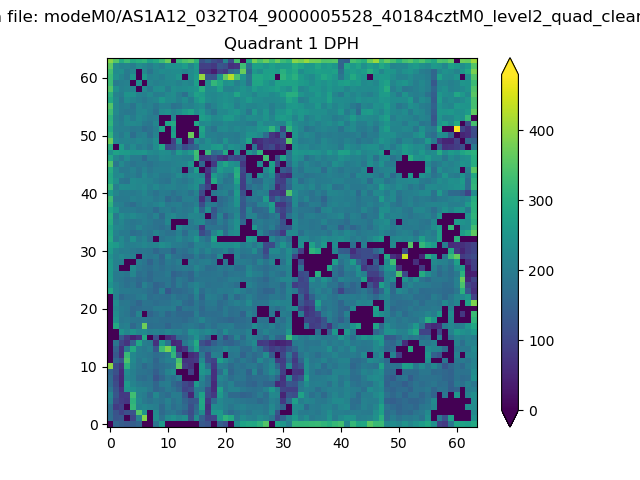 |
Quadrant B |
|---|---|---|---|
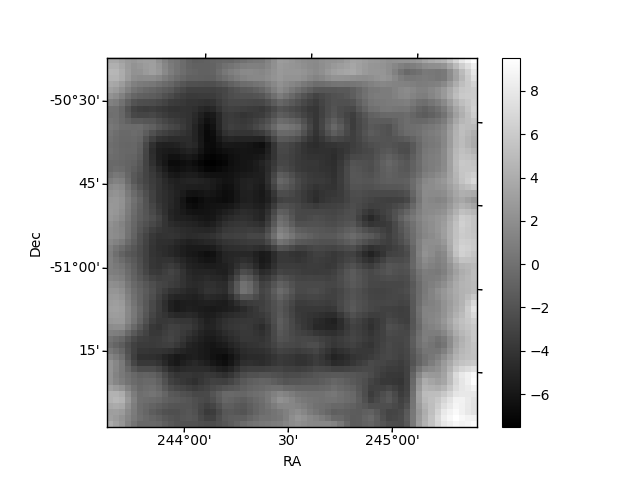
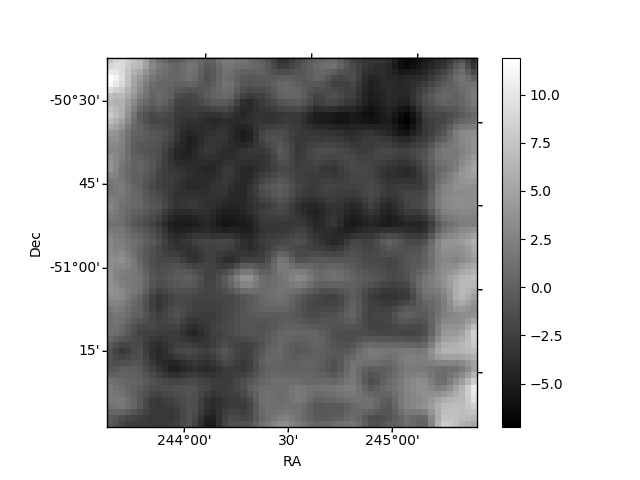
| Quadrant D | 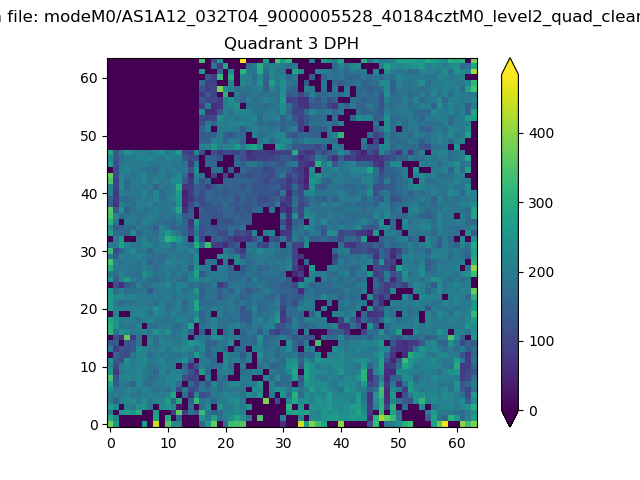 |
 |
Quadrant C |
| Plot type | Count rate plots | Images |
|---|---|---|
| Comparison with Poisson distribution Blue bars denote a histogram of data divided into 1 sec bins. Red curve is a Poisson curve with rate = median count rate of data. |
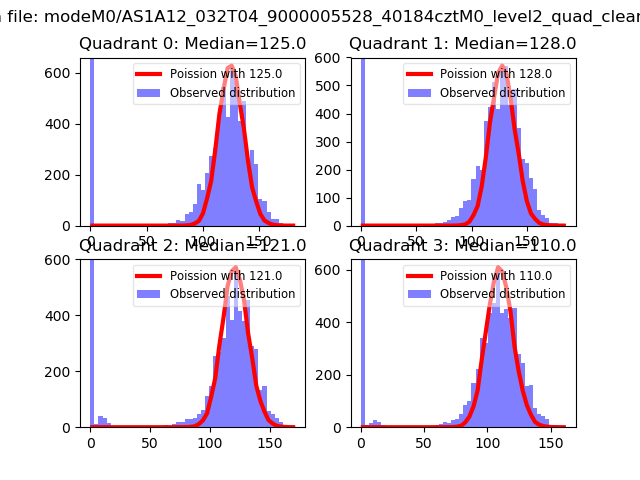 |
 |
| Quadrant-wise count rates Data is divided into 100 sec bins |
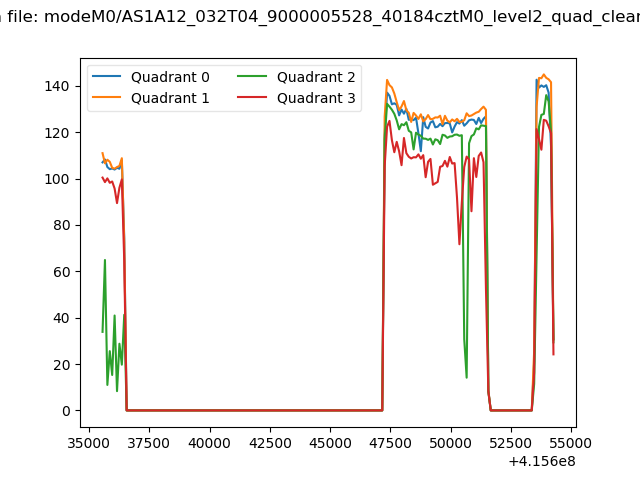 |
|
| Module-wise count rates for Quadrant A Data is divided into 100 sec bins |
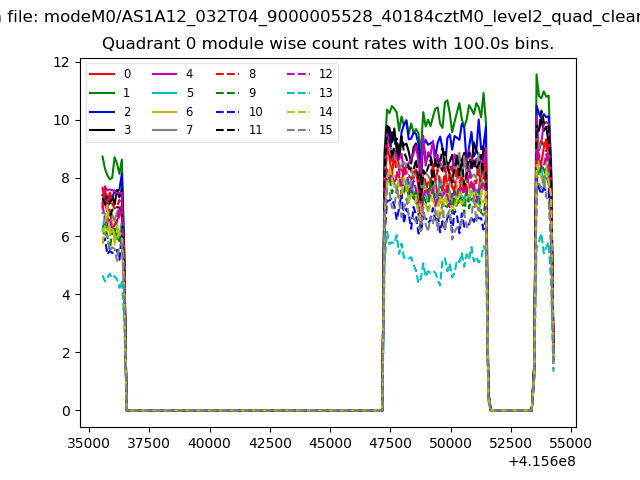 |
 |
| Module-wise count rates for Quadrant B Data is divided into 100 sec bins |
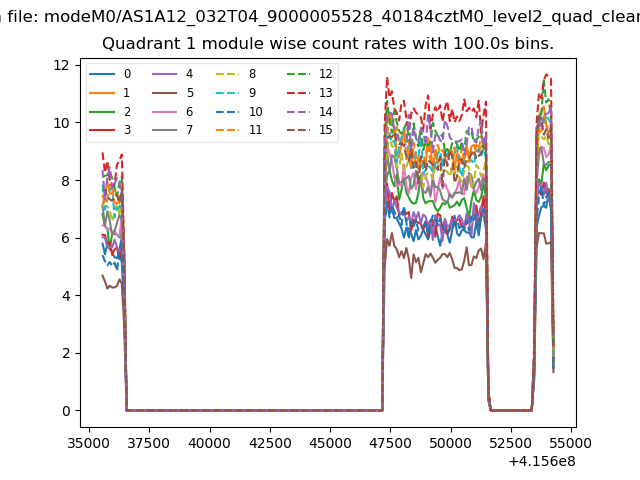 |
 |
| Module-wise count rates for Quadrant C Data is divided into 100 sec bins |
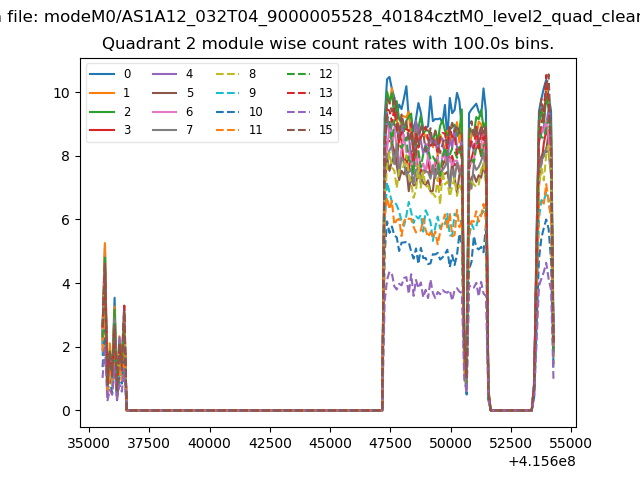 |
 |
| Module-wise count rates for Quadrant D Data is divided into 100 sec bins |
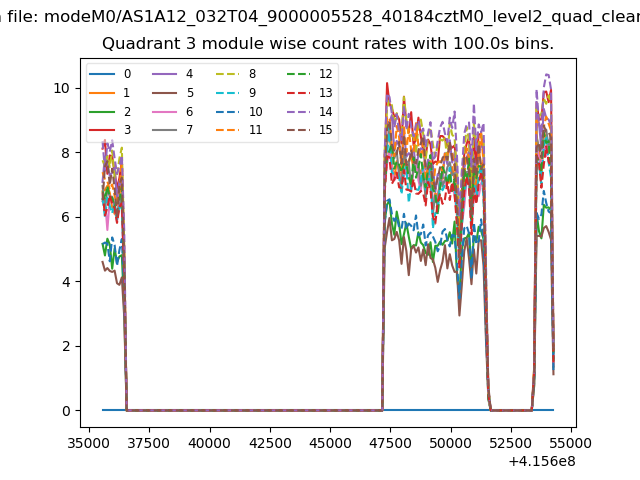 |
 |
| Parameter | Plot |
|---|---|
| CZT HV Monitor | 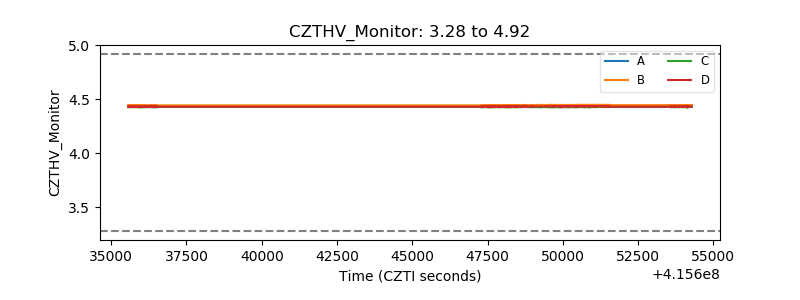 |
| D_VDD | 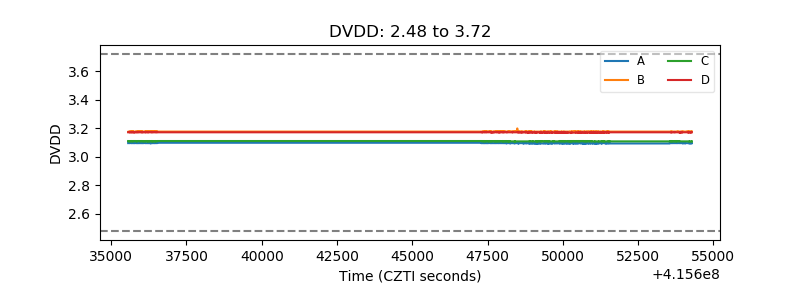 |
| Temperature 1 | 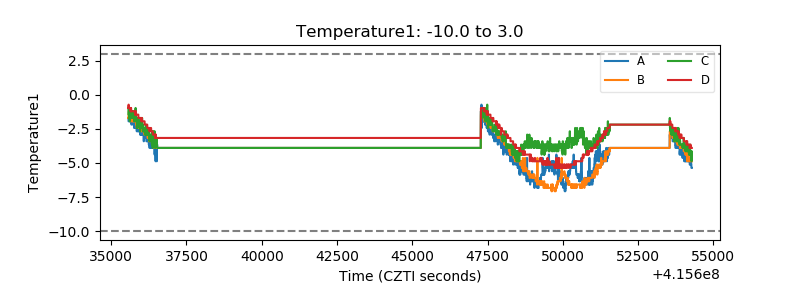 |
| Veto HV Monitor | 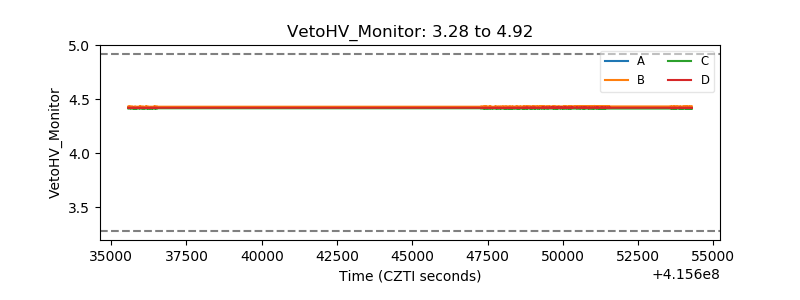 |
| Veto LLD | 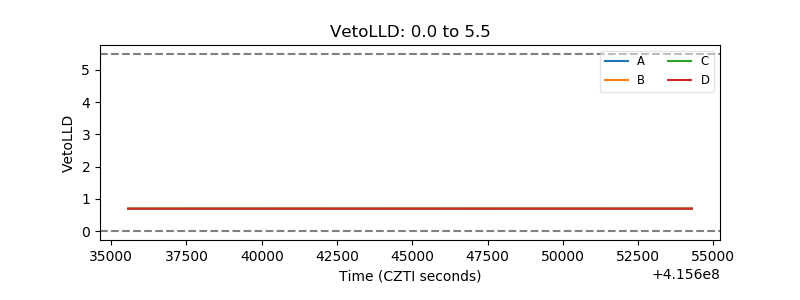 |
| Alpha Counter | 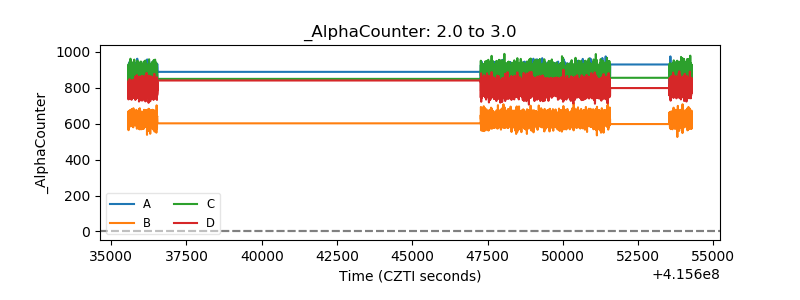 |
| _CPM_Rate | 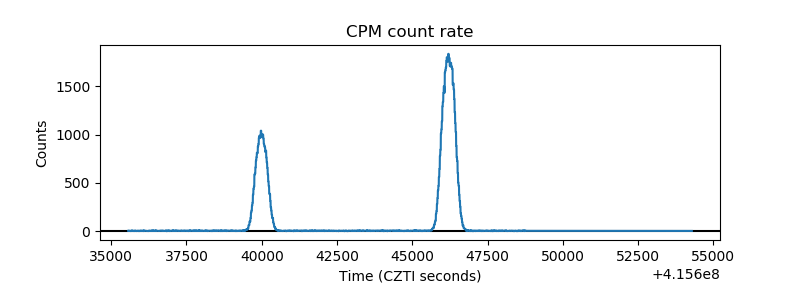 |
| CZT Counter | 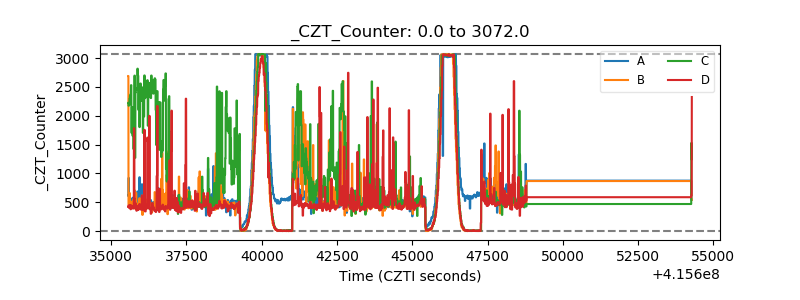 |
| +2.5 Volts monitor | 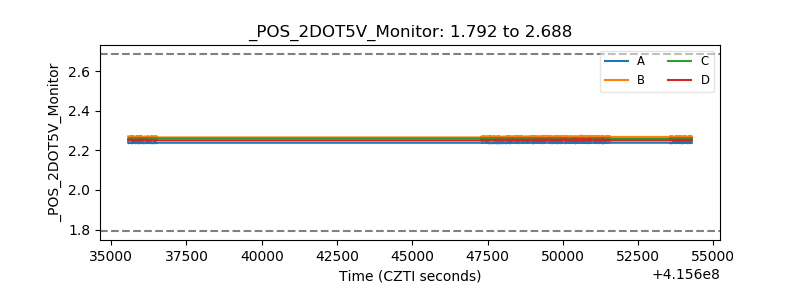 |
| +5 Volts monitor | 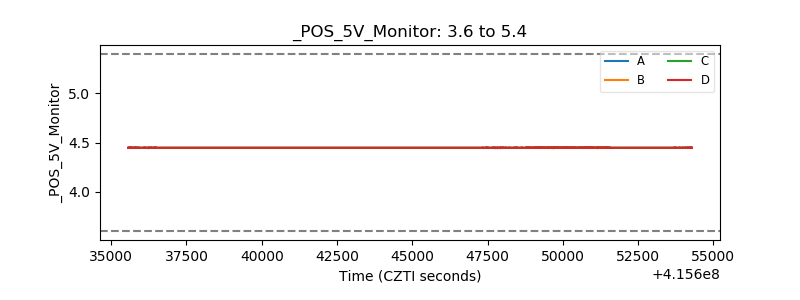 |
| _ROLL_ROT | 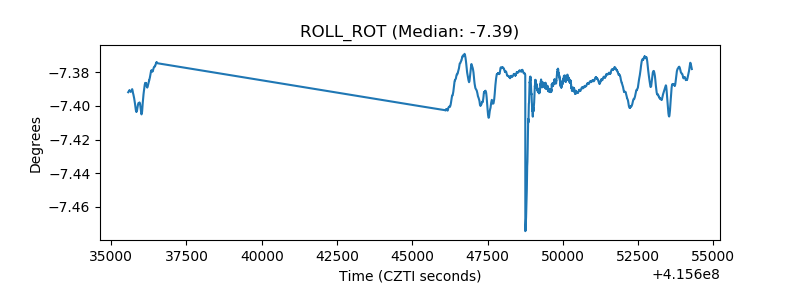 |
| _Roll_DEC | 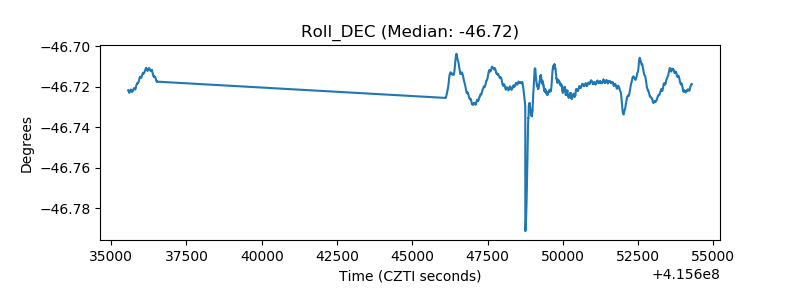 |
| _Roll_RA | 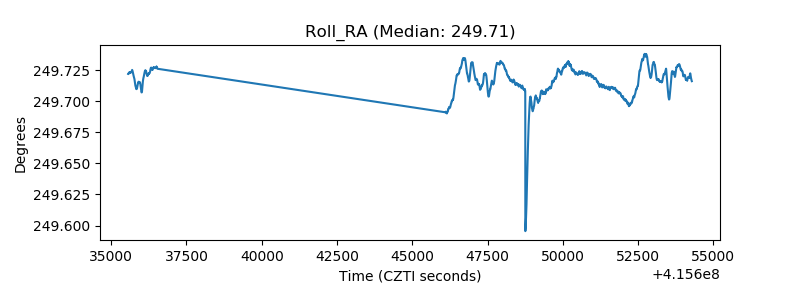 |
| Veto Counter | 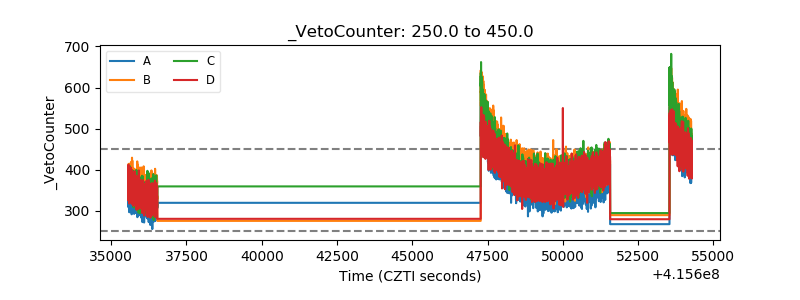 |