| Param | Original file | Final file |
|---|---|---|
| Filename | modeM0/AS1A12_032T04_9000005528_40185cztM0_level2.fits | modeM0/AS1A12_032T04_9000005528_40185cztM0_level2_quad_clean.evt |
| Size (bytes) | 465,701,760 | 87,143,040 |
| Size | 444.1 MB | 83.1 MB |
| Events in quadrant A | 3,064,412 | 636,818 |
| Events in quadrant B | 2,485,053 | 661,919 |
| Events in quadrant C | 6,309,664 | 524,637 |
| Events in quadrant D | 4,995,235 | 468,716 |
| Mode SS | |||
|---|---|---|---|
| Quadrant | BADHDUFLAG | Total packets | Discarded packets |
| A | 0 | 100 | 0 |
| B | 0 | 100 | 0 |
| C | 0 | 100 | 0 |
| D | 0 | 100 | 0 |
| Mode M0 | |||
|---|---|---|---|
| Quadrant | BADHDUFLAG | Total packets | Discarded packets |
| A | 0 | 12160 | 3 |
| B | 0 | 10463 | 2 |
| C | 0 | 22129 | 2 |
| D | 0 | 18158 | 2 |
| Mode M9 | |||
|---|---|---|---|
| Quadrant | BADHDUFLAG | Total packets | Discarded packets |
| A | 0 | 23 | 0 |
| B | 0 | 23 | 0 |
| C | 0 | 23 | 0 |
| D | 0 | 24 | 0 |
| Quadrant | Total seconds | Saturated seconds | Saturation percentage |
|---|---|---|---|
| A | 4947 | 90 | 1.819284% |
| B | 4947 | 28 | 0.566000% |
| C | 4947 | 922 | 18.637558% |
| D | 4947 | 944 | 19.082272% |
Noise dominated data is calculated using 1-second bins in cleaned event files. If a bin has >2000 counts, and if more than 50% of those come from <1% of pixels, then it is considered to be noise-dominated and hence unusable.
| Quadrant | # 1 sec bins | Bins with >0 counts | Bins with >2000 counts | High rate bins dominated by noise | Noise dominated (total time) | Noise dominated (detector-on time) | Marked lightcurve |
|---|---|---|---|---|---|---|---|
| A | 7040 | 4948 | 73 | 73 | 1.04% | 1.48% | 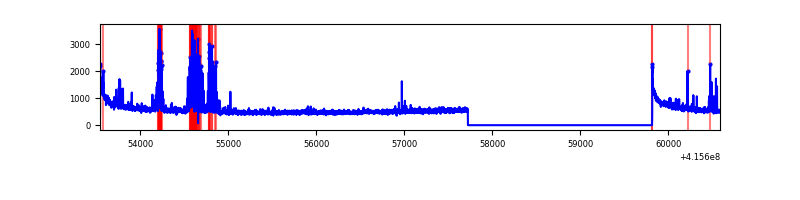 |
| B | 7040 | 4948 | 15 | 15 | 0.21% | 0.30% | 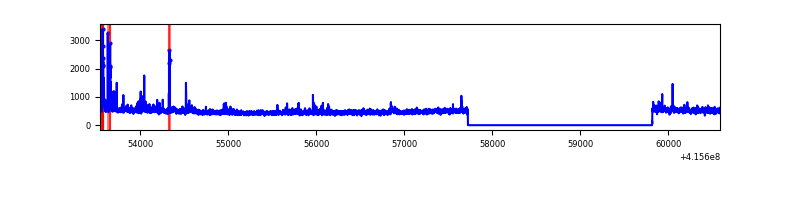 |
| C | 7040 | 4948 | 978 | 978 | 13.89% | 19.77% | 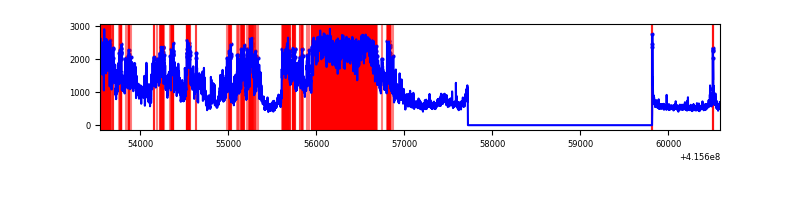 |
| D | 7040 | 4948 | 842 | 842 | 11.96% | 17.02% | 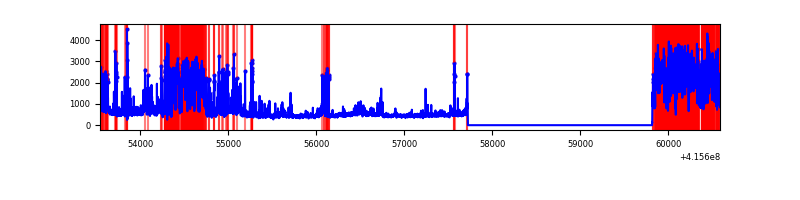 |
Top three noisy pixels from each quadrant. If the there are fewer than three noisy pixels in the level2.evt file, extra rows are filled as -1
| Pixel properties | Quadrant properties | ||||||
|---|---|---|---|---|---|---|---|
| Quadrant | DetID | PixID | Counts | Sigma | Mean | Median | Sigma |
| A | 10 | 83 | 456877 | 3951.47 | 575 | 568 | 115.5 |
| A | 13 | 248 | 352156 | 3044.62 | 575 | 568 | 115.5 |
| A | 2 | 79 | 21524 | 181.47 | 575 | 568 | 115.5 |
| B | 5 | 255 | 74743 | 676.45 | 581 | 567 | 109.7 |
| B | 0 | 229 | 39773 | 357.54 | 581 | 567 | 109.7 |
| B | 4 | 171 | 34053 | 305.38 | 581 | 567 | 109.7 |
| C | 9 | 187 | 3954009 | 31467.42 | 540 | 546 | 125.6 |
| C | 15 | 214 | 200068 | 1588.09 | 540 | 546 | 125.6 |
| C | 0 | 10 | 19918 | 154.19 | 540 | 546 | 125.6 |
| D | 2 | 249 | 2282306 | 18617.0 | 501 | 489 | 122.6 |
| D | 12 | 227 | 523694 | 4268.75 | 501 | 489 | 122.6 |
| D | 13 | 249 | 90689 | 735.93 | 501 | 489 | 122.6 |
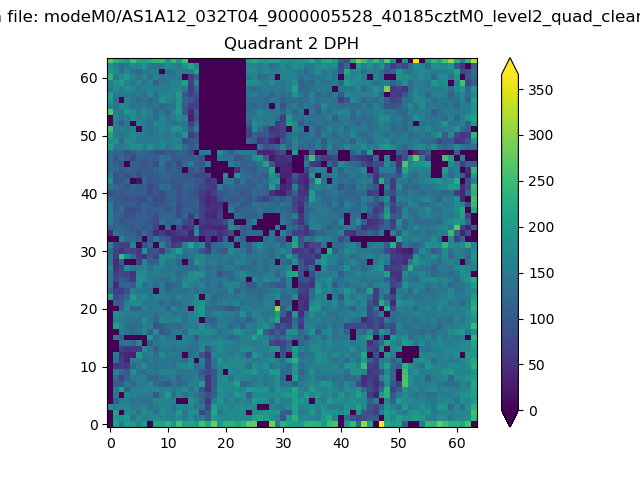
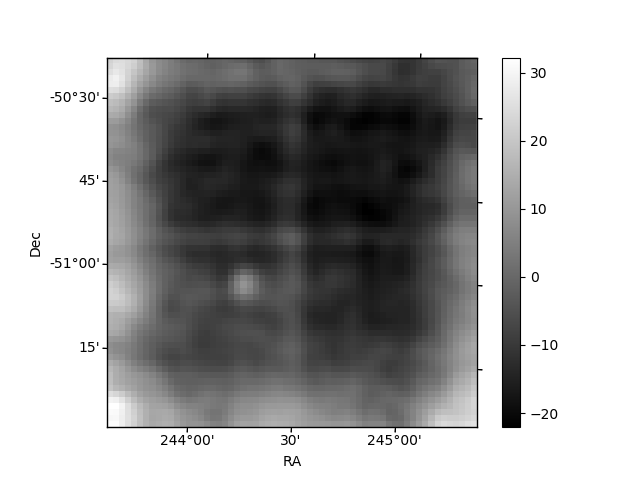
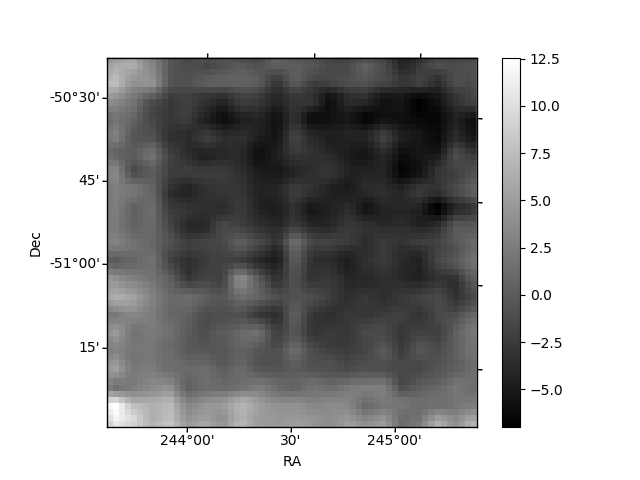
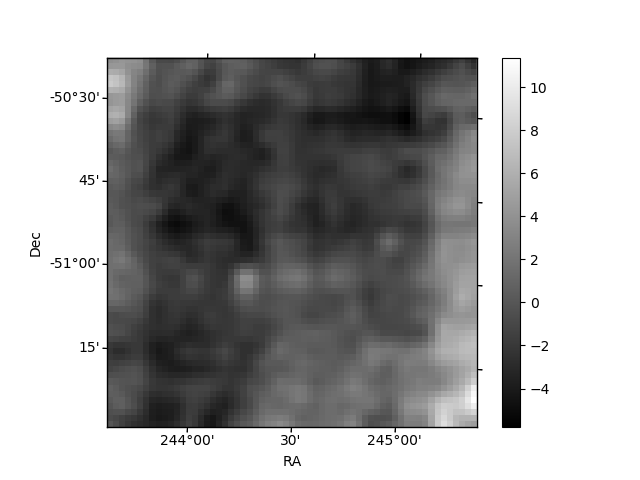
Histogram calculated using DETX and DETY for each event in the final _common_clean file
| Quadrant A | 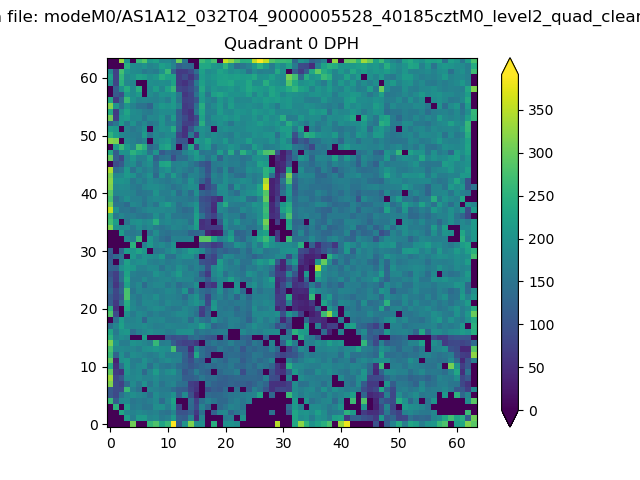 |
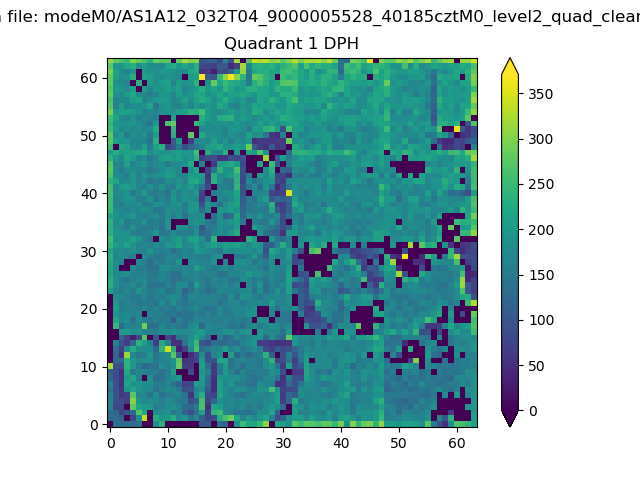 |
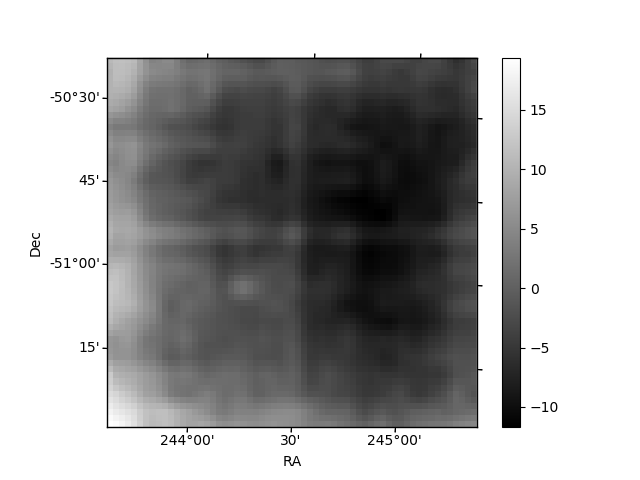
Quadrant B |
|---|---|---|---|
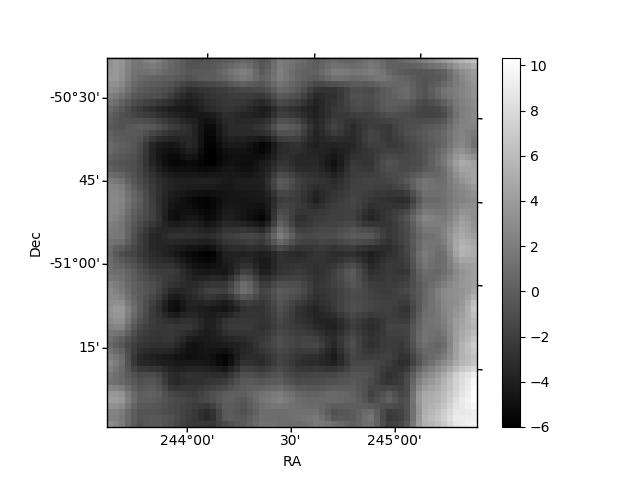
| Quadrant D | 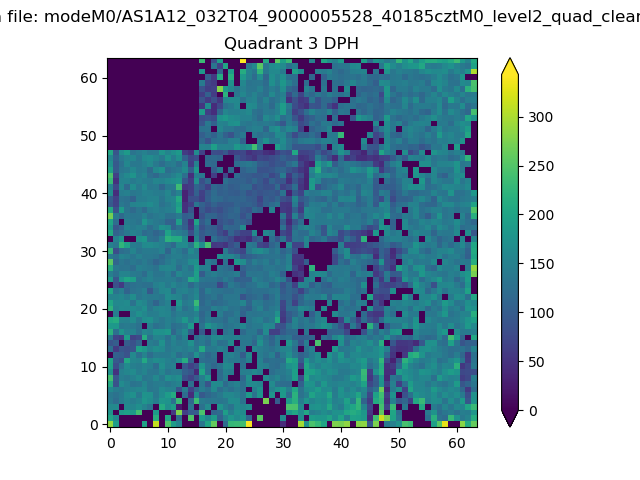 |
 |
Quadrant C |
| Plot type | Count rate plots | Images |
|---|---|---|
| Comparison with Poisson distribution Blue bars denote a histogram of data divided into 1 sec bins. Red curve is a Poisson curve with rate = median count rate of data. |
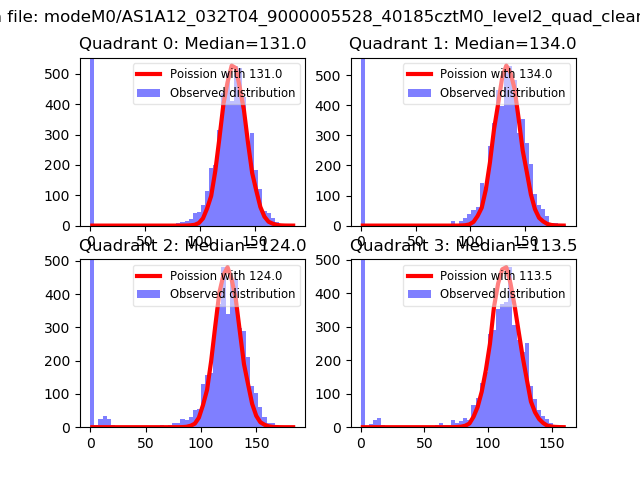 |
 |
| Quadrant-wise count rates Data is divided into 100 sec bins |
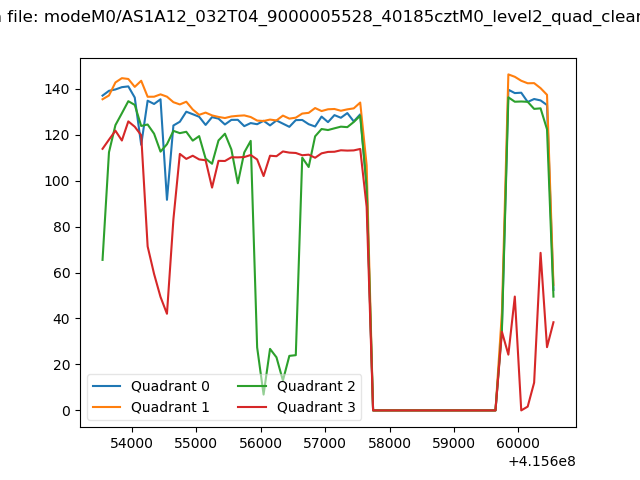 |
|
| Module-wise count rates for Quadrant A Data is divided into 100 sec bins |
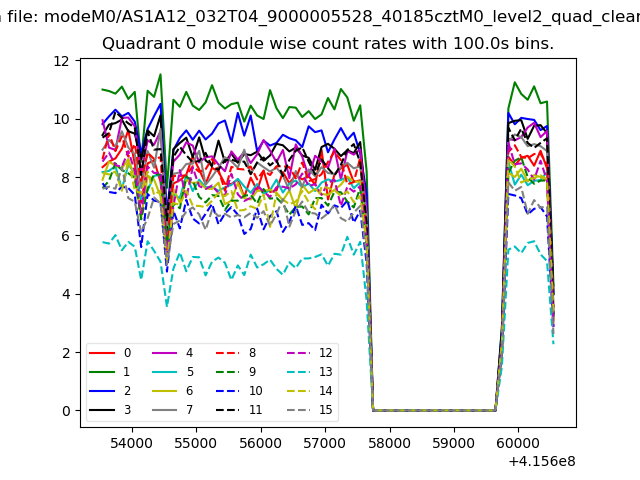 |
 |
| Module-wise count rates for Quadrant B Data is divided into 100 sec bins |
 |
 |
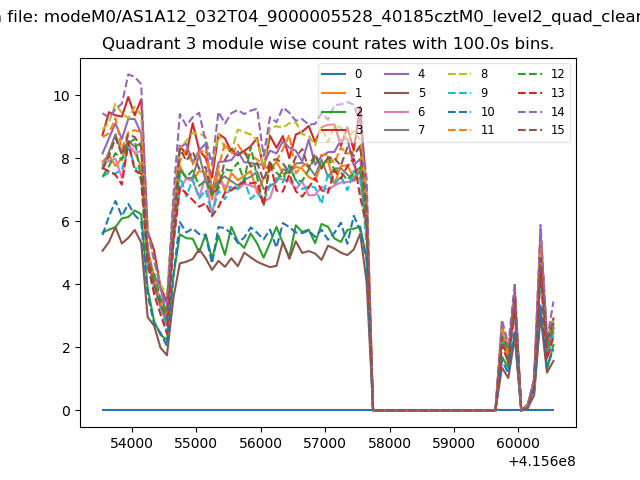
| Module-wise count rates for Quadrant C Data is divided into 100 sec bins |
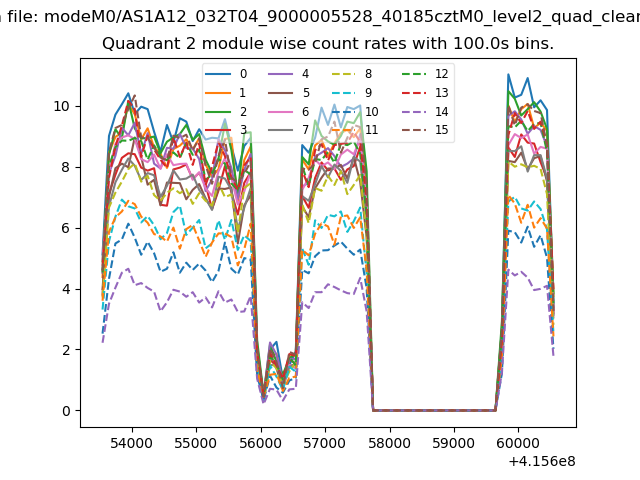 |
 |
| Module-wise count rates for Quadrant D Data is divided into 100 sec bins |
 |
 |
| Parameter | Plot |
|---|---|
| CZT HV Monitor | 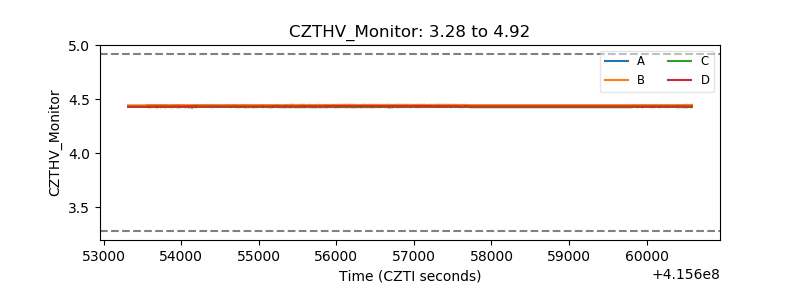 |
| D_VDD | 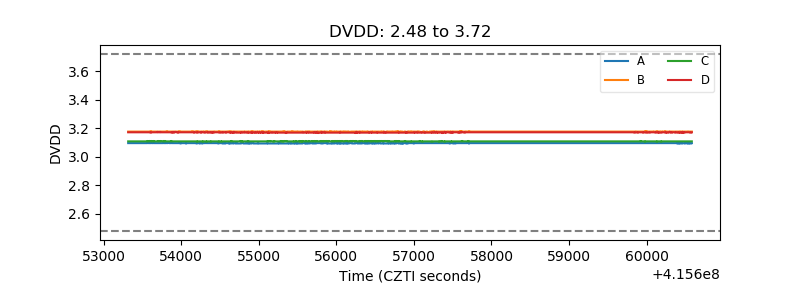 |
| Temperature 1 | 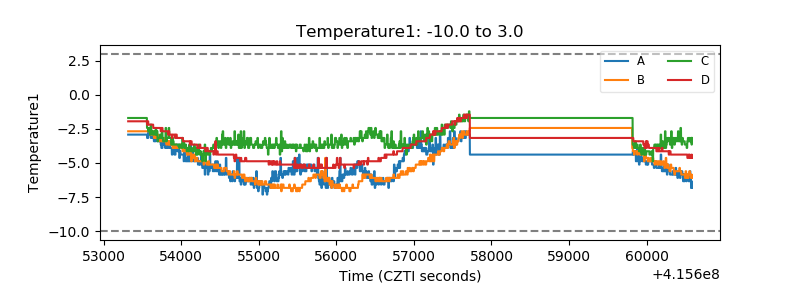 |
| Veto HV Monitor | 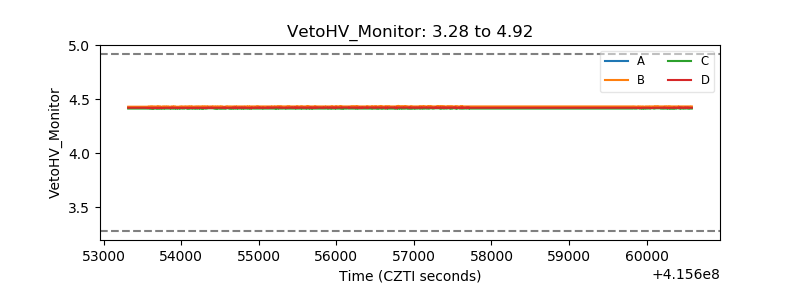 |
| Veto LLD | 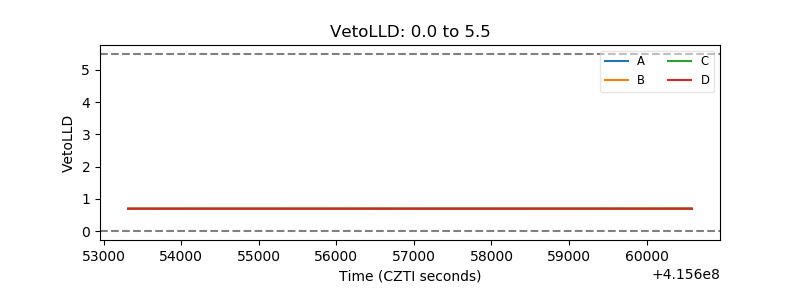 |
| Alpha Counter | 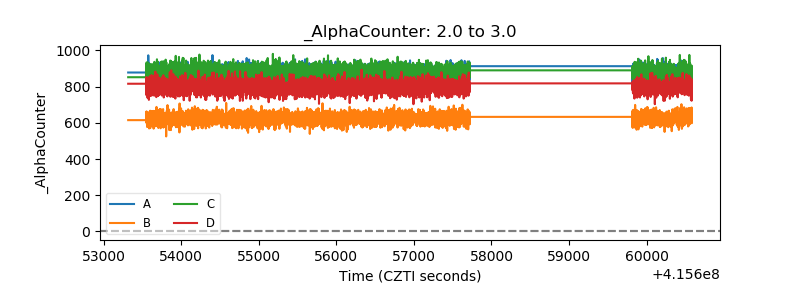 |
| _CPM_Rate | 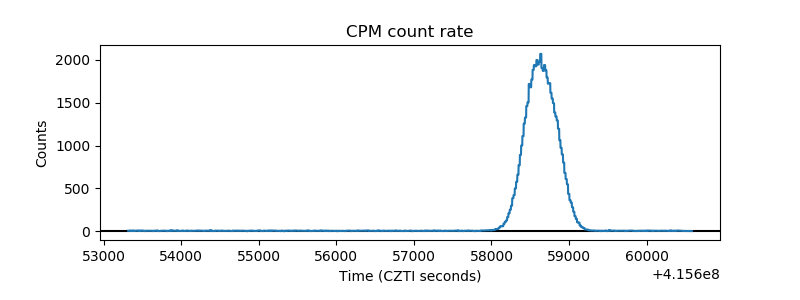 |
| CZT Counter | 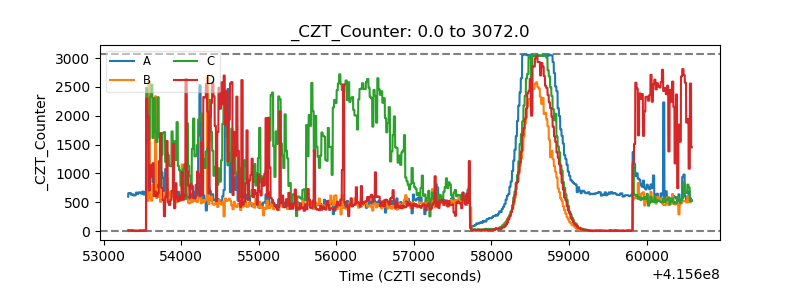 |
| +2.5 Volts monitor | 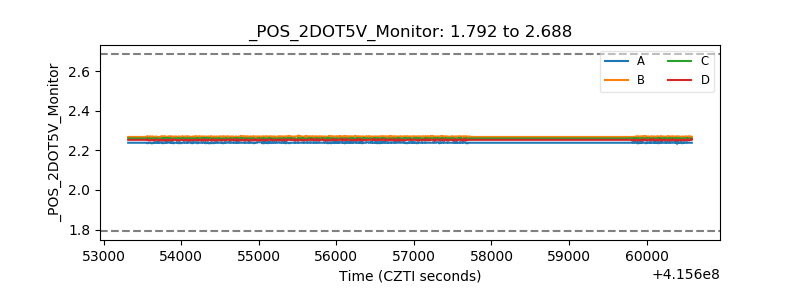 |
| +5 Volts monitor | 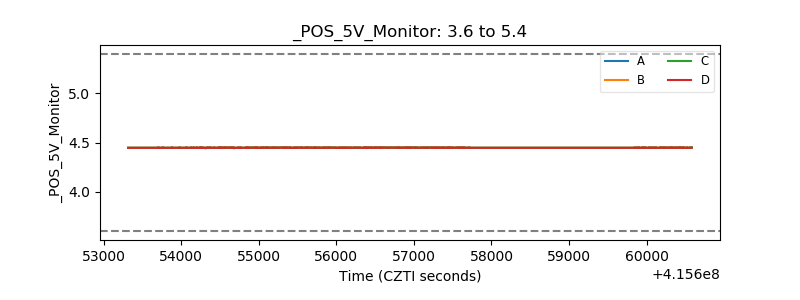 |
| _ROLL_ROT | 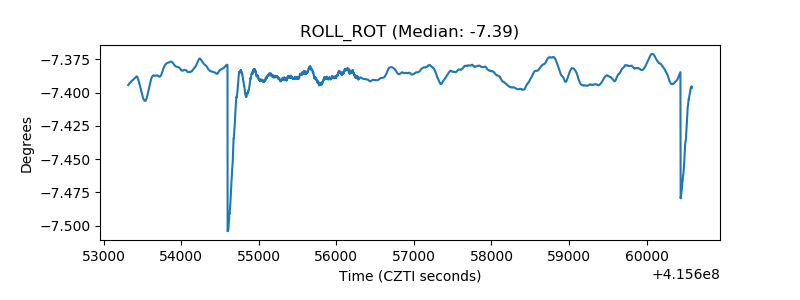 |
| _Roll_DEC | 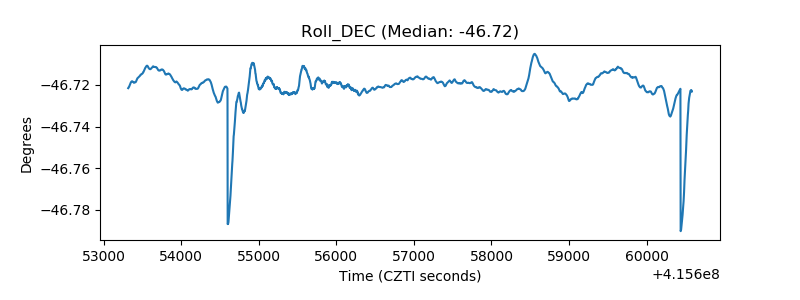 |
| _Roll_RA | 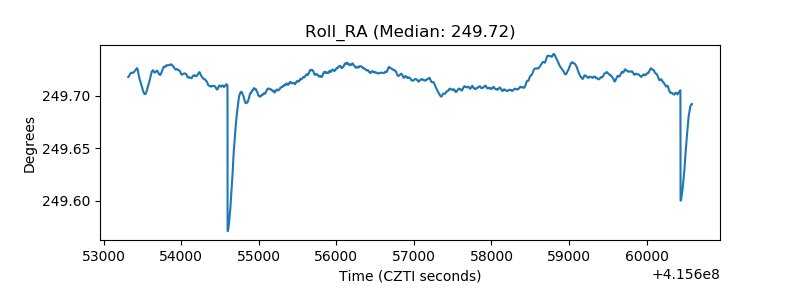 |
| Veto Counter | 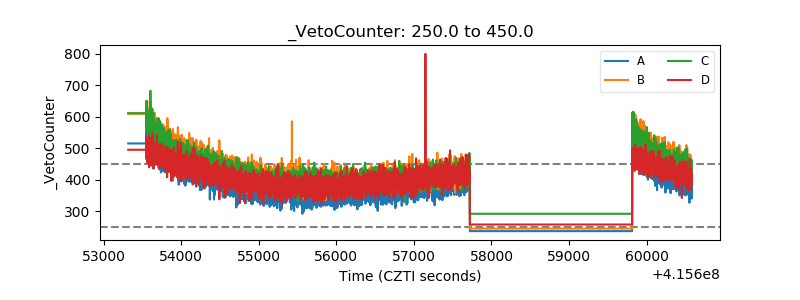 |