| Param | Original file | Final file |
|---|---|---|
| Filename | modeM0/AS1A12_032T04_9000005528_40186cztM0_level2.fits | modeM0/AS1A12_032T04_9000005528_40186cztM0_level2_quad_clean.evt |
| Size (bytes) | 421,922,880 | 84,470,400 |
| Size | 402.4 MB | 80.6 MB |
| Events in quadrant A | 2,703,186 | 609,418 |
| Events in quadrant B | 2,302,119 | 633,721 |
| Events in quadrant C | 3,734,090 | 575,553 |
| Events in quadrant D | 6,503,820 | 401,274 |
| Mode SS | |||
|---|---|---|---|
| Quadrant | BADHDUFLAG | Total packets | Discarded packets |
| A | 0 | 98 | 0 |
| B | 0 | 98 | 0 |
| C | 0 | 98 | 0 |
| D | 0 | 98 | 0 |
| Mode M0 | |||
|---|---|---|---|
| Quadrant | BADHDUFLAG | Total packets | Discarded packets |
| A | 0 | 10961 | 3 |
| B | 0 | 9972 | 2 |
| C | 0 | 14119 | 2 |
| D | 0 | 22596 | 2 |
| Mode M9 | |||
|---|---|---|---|
| Quadrant | BADHDUFLAG | Total packets | Discarded packets |
| A | 0 | 25 | 0 |
| B | 0 | 25 | 0 |
| C | 0 | 25 | 0 |
| D | 0 | 26 | 0 |
| Quadrant | Total seconds | Saturated seconds | Saturation percentage |
|---|---|---|---|
| A | 4818 | 36 | 0.747198% |
| B | 4818 | 15 | 0.311333% |
| C | 4818 | 182 | 3.777501% |
| D | 4818 | 1412 | 29.306766% |
Noise dominated data is calculated using 1-second bins in cleaned event files. If a bin has >2000 counts, and if more than 50% of those come from <1% of pixels, then it is considered to be noise-dominated and hence unusable.
| Quadrant | # 1 sec bins | Bins with >0 counts | Bins with >2000 counts | High rate bins dominated by noise | Noise dominated (total time) | Noise dominated (detector-on time) | Marked lightcurve |
|---|---|---|---|---|---|---|---|
| A | 6940 | 4819 | 24 | 24 | 0.35% | 0.50% | 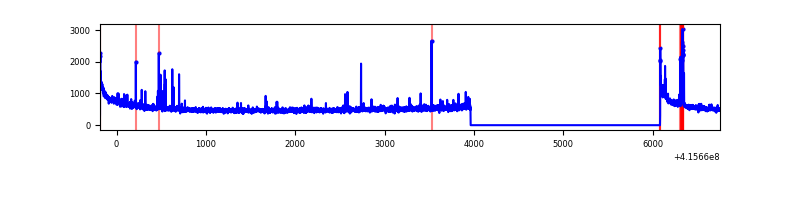 |
| B | 6940 | 4819 | 8 | 8 | 0.12% | 0.17% | 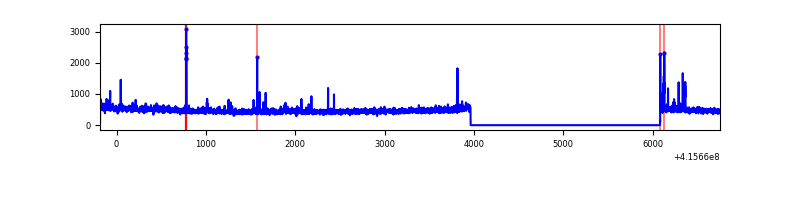 |
| C | 6940 | 4819 | 179 | 179 | 2.58% | 3.71% | 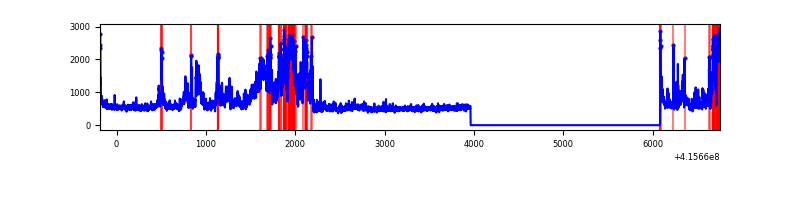 |
| D | 6940 | 4819 | 1292 | 1292 | 18.62% | 26.81% | 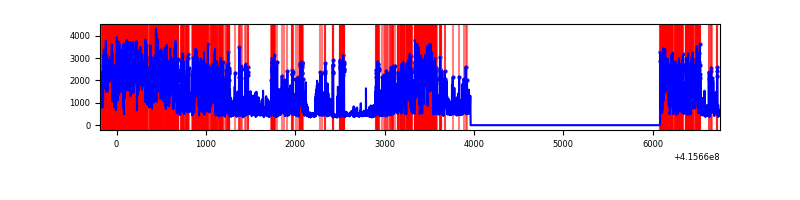 |
Top three noisy pixels from each quadrant. If the there are fewer than three noisy pixels in the level2.evt file, extra rows are filled as -1
| Pixel properties | Quadrant properties | ||||||
|---|---|---|---|---|---|---|---|
| Quadrant | DetID | PixID | Counts | Sigma | Mean | Median | Sigma |
| A | 10 | 83 | 438275 | 3907.86 | 551 | 544 | 112.0 |
| A | 13 | 248 | 109372 | 971.57 | 551 | 544 | 112.0 |
| A | 2 | 79 | 19930 | 173.07 | 551 | 544 | 112.0 |
| B | 4 | 171 | 38591 | 358.89 | 556 | 543 | 106.0 |
| B | 5 | 255 | 34041 | 315.97 | 556 | 543 | 106.0 |
| B | 0 | 245 | 29931 | 277.21 | 556 | 543 | 106.0 |
| C | 9 | 187 | 1375392 | 10983.51 | 539 | 542 | 125.2 |
| C | 15 | 214 | 202723 | 1615.2 | 539 | 542 | 125.2 |
| C | 0 | 10 | 43817 | 345.72 | 539 | 542 | 125.2 |
| D | 2 | 249 | 2634734 | 23535.41 | 454 | 442 | 111.9 |
| D | 12 | 227 | 1720936 | 15371.32 | 454 | 442 | 111.9 |
| D | 13 | 249 | 181337 | 1616.16 | 454 | 442 | 111.9 |
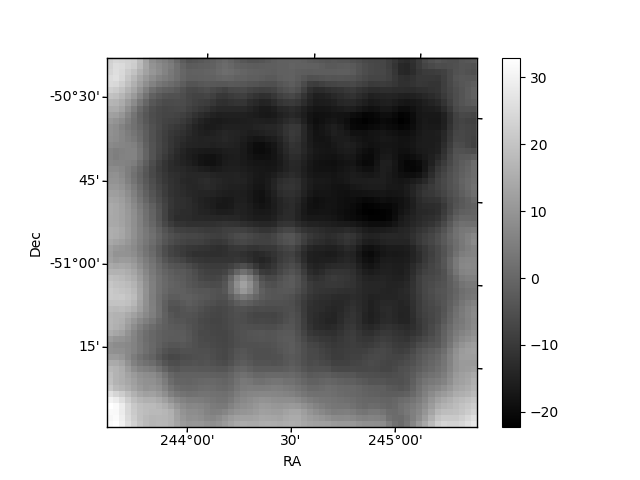
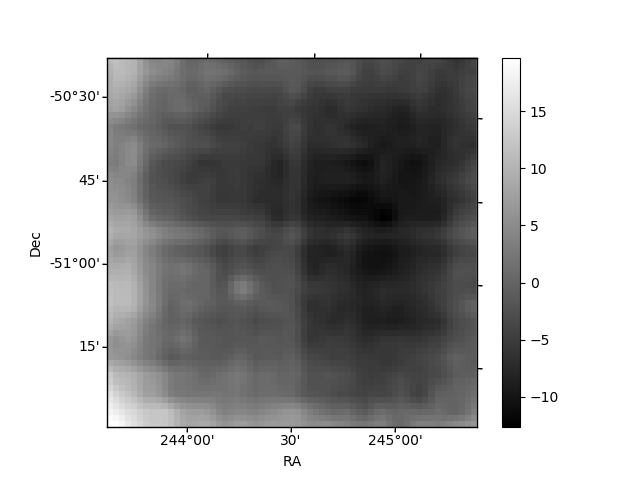
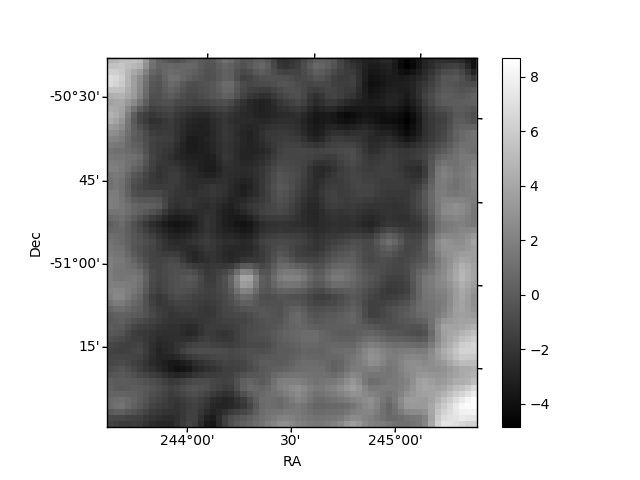
Histogram calculated using DETX and DETY for each event in the final _common_clean file
| Quadrant A | 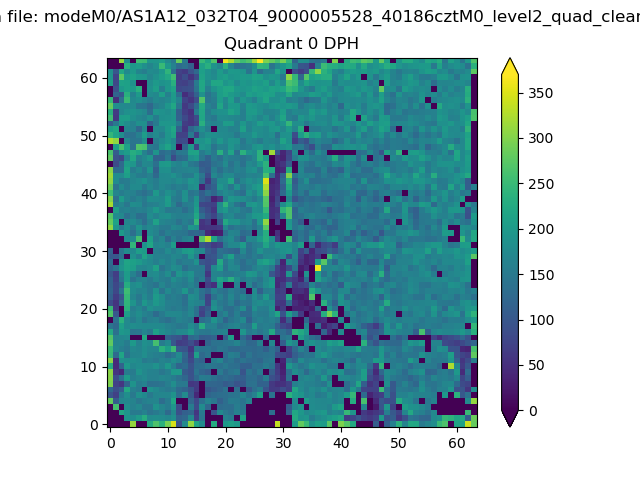 |
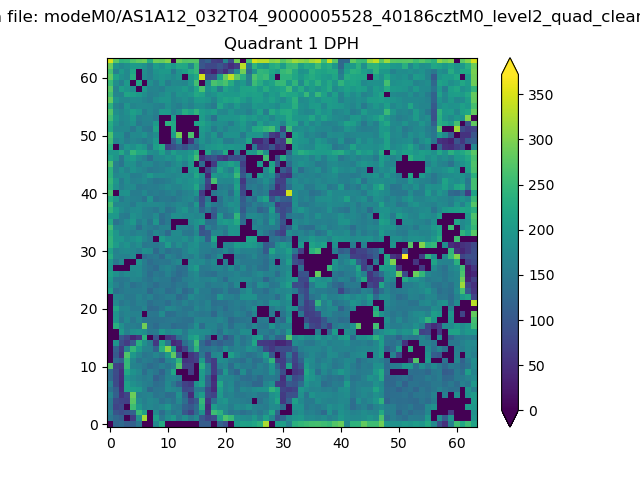 |
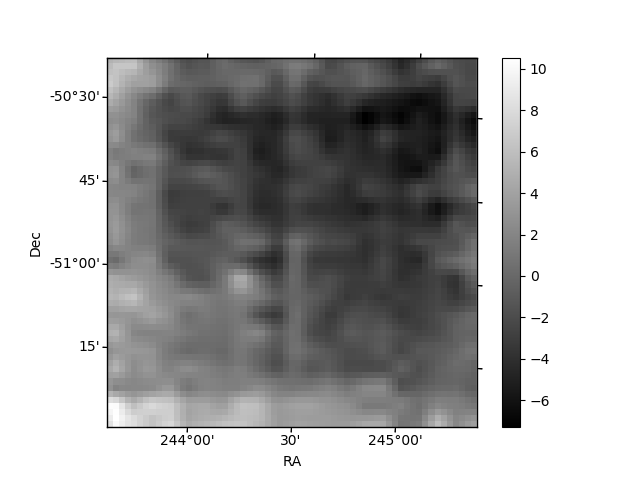
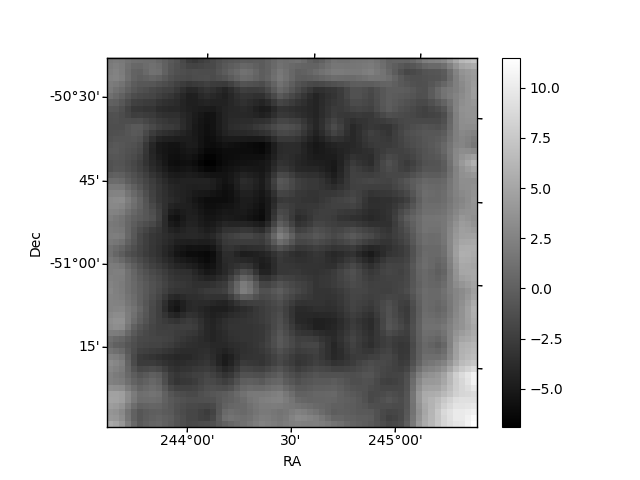
Quadrant B |
|---|---|---|---|
| Quadrant D |  |
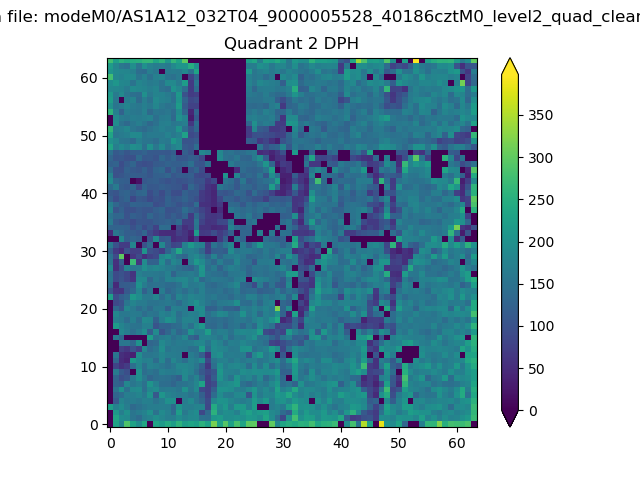 |
Quadrant C |
| Plot type | Count rate plots | Images |
|---|---|---|
| Comparison with Poisson distribution Blue bars denote a histogram of data divided into 1 sec bins. Red curve is a Poisson curve with rate = median count rate of data. |
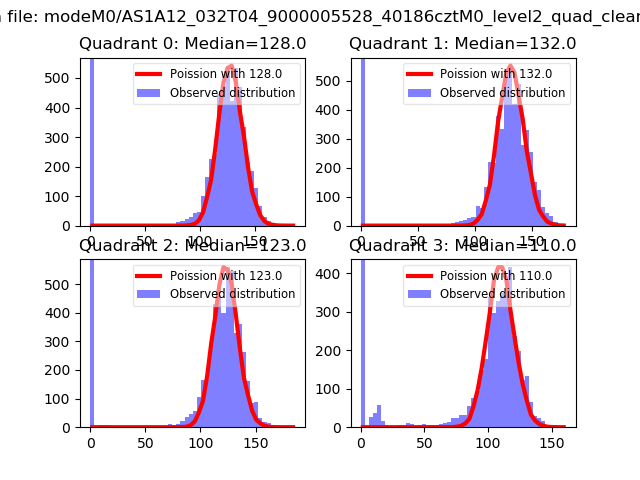 |
 |
| Quadrant-wise count rates Data is divided into 100 sec bins |
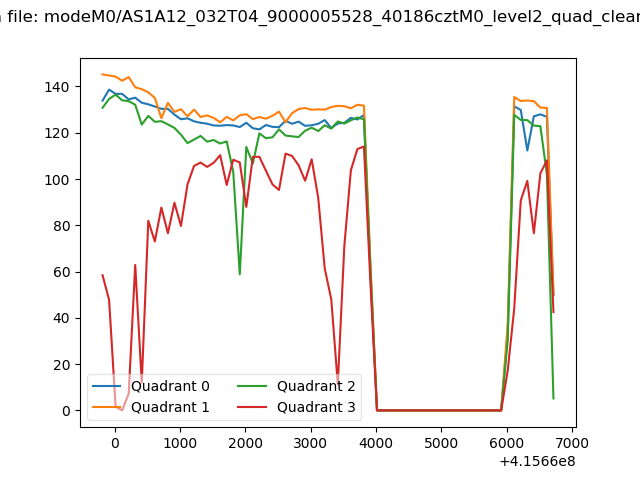 |
|
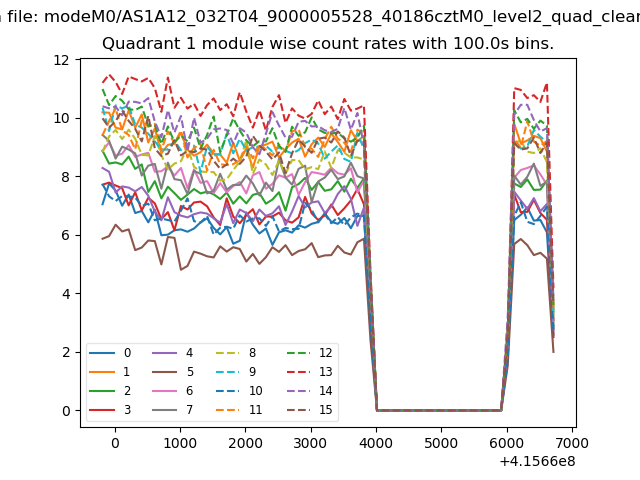
| Module-wise count rates for Quadrant A Data is divided into 100 sec bins |
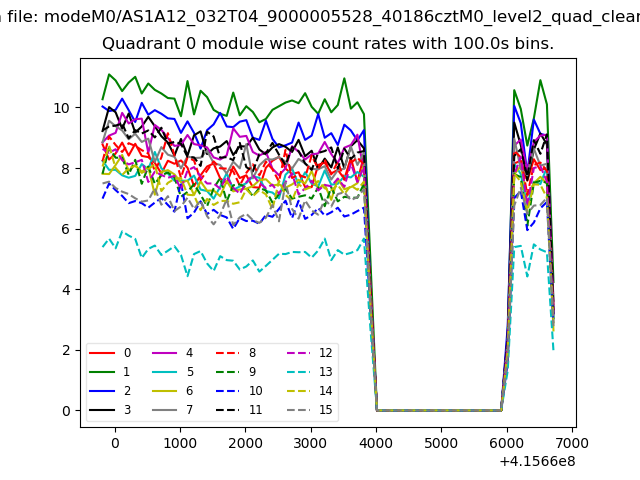 |
 |
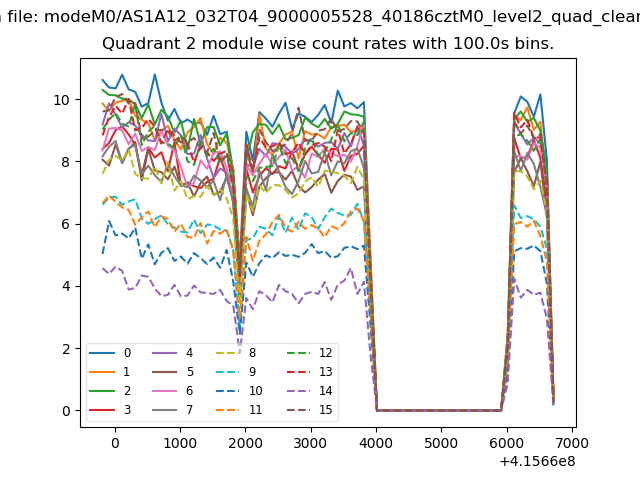
| Module-wise count rates for Quadrant B Data is divided into 100 sec bins |
 |
 |
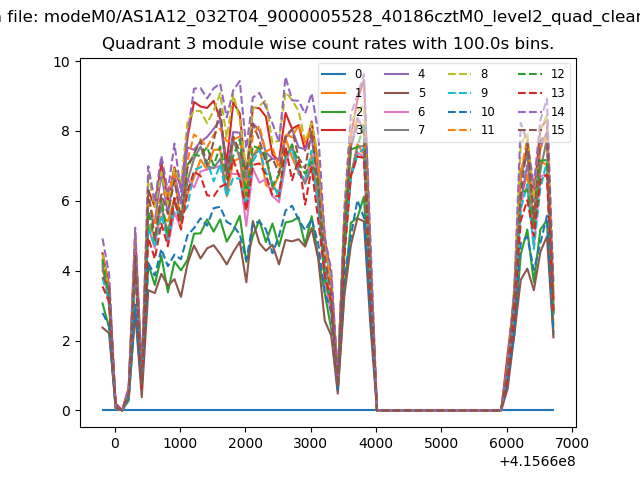
| Module-wise count rates for Quadrant C Data is divided into 100 sec bins |
 |
 |
| Module-wise count rates for Quadrant D Data is divided into 100 sec bins |
 |
 |
| Parameter | Plot |
|---|---|
| CZT HV Monitor | 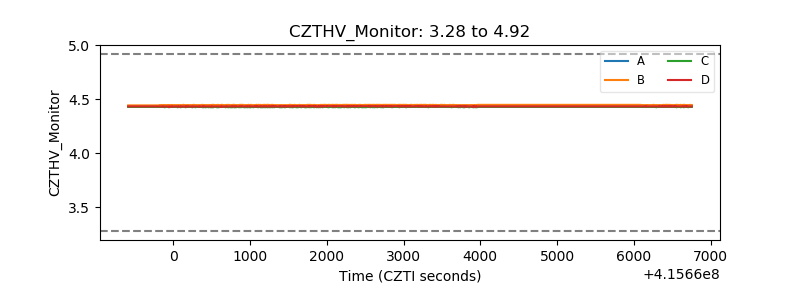 |
| D_VDD | 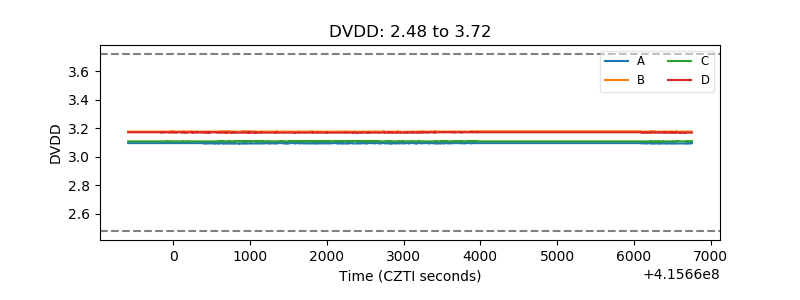 |
| Temperature 1 | 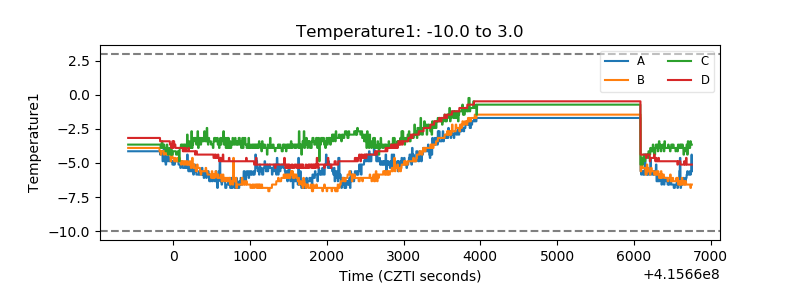 |
| Veto HV Monitor | 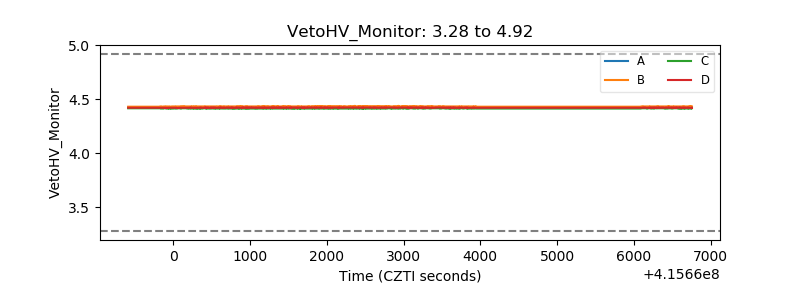 |
| Veto LLD | 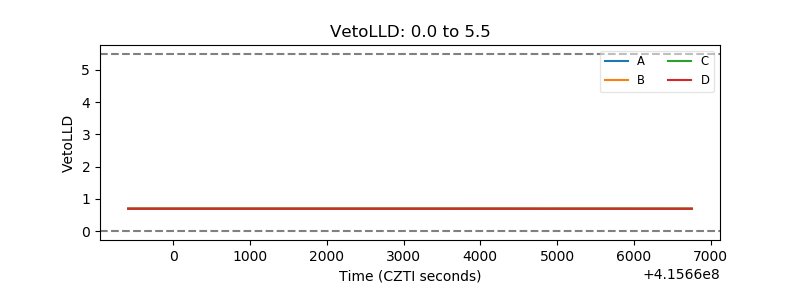 |
| Alpha Counter | 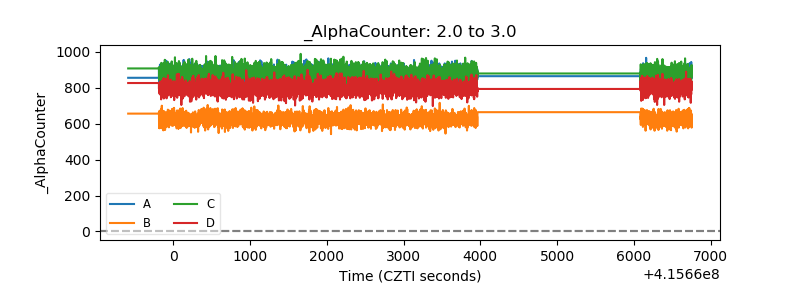 |
| _CPM_Rate | 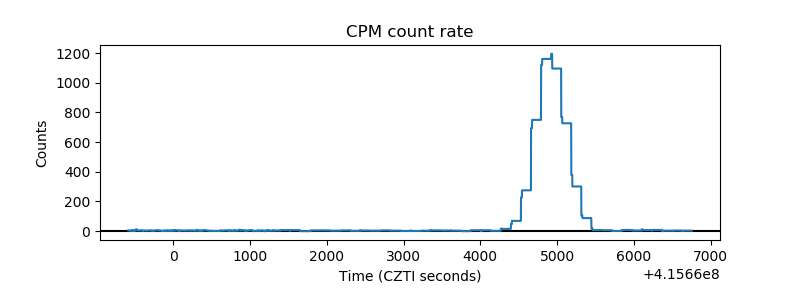 |
| CZT Counter | 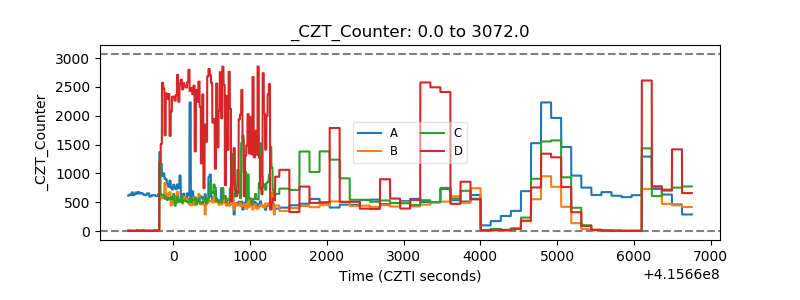 |
| +2.5 Volts monitor | 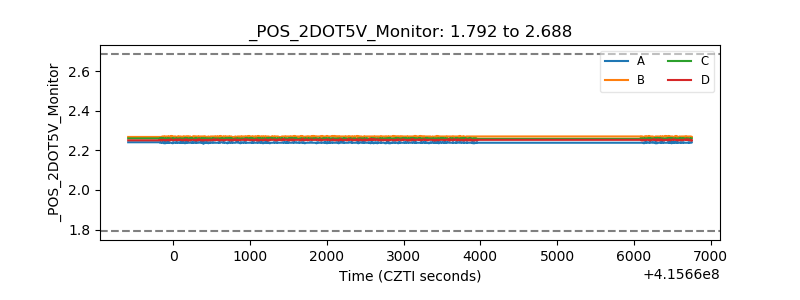 |
| +5 Volts monitor | 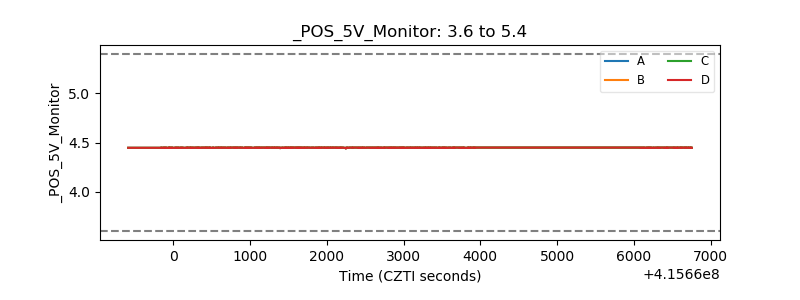 |
| _ROLL_ROT | 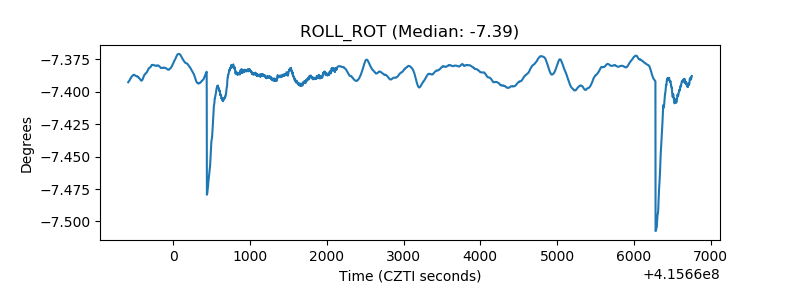 |
| _Roll_DEC | 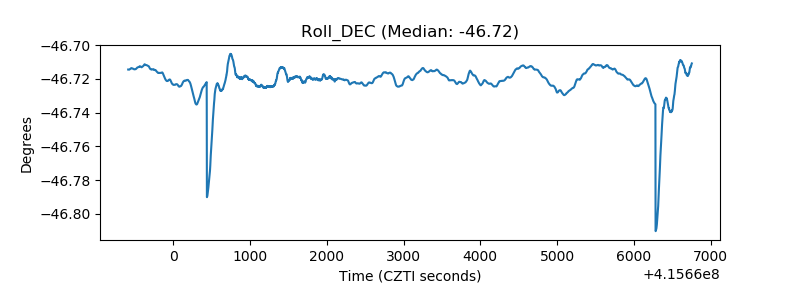 |
| _Roll_RA | 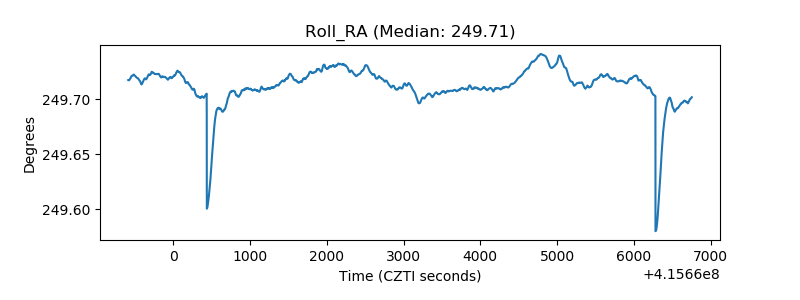 |
| Veto Counter | 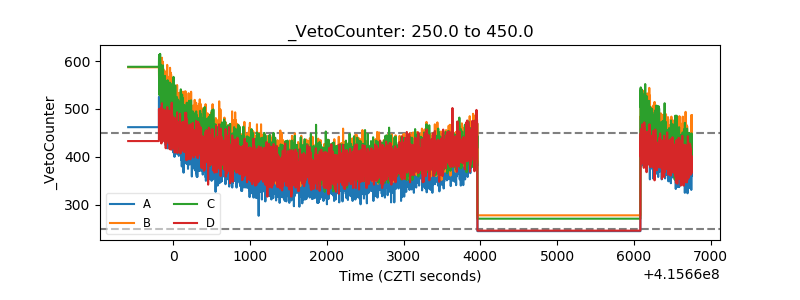 |