| Param | Original file | Final file |
|---|---|---|
| Filename | modeM0/AS1A12_032T04_9000005528_40187cztM0_level2.fits | modeM0/AS1A12_032T04_9000005528_40187cztM0_level2_quad_clean.evt |
| Size (bytes) | 321,240,960 | 83,992,320 |
| Size | 306.4 MB | 80.1 MB |
| Events in quadrant A | 2,526,340 | 576,876 |
| Events in quadrant B | 2,426,239 | 593,352 |
| Events in quadrant C | 2,790,719 | 557,706 |
| Events in quadrant D | 3,775,249 | 479,568 |
| Mode SS | |||
|---|---|---|---|
| Quadrant | BADHDUFLAG | Total packets | Discarded packets |
| A | 0 | 98 | 0 |
| B | 0 | 98 | 0 |
| C | 0 | 98 | 0 |
| D | 0 | 98 | 0 |
| Mode M0 | |||
|---|---|---|---|
| Quadrant | BADHDUFLAG | Total packets | Discarded packets |
| A | 0 | 10416 | 3 |
| B | 0 | 10423 | 2 |
| C | 0 | 11222 | 2 |
| D | 0 | 14449 | 2 |
| Mode M9 | |||
|---|---|---|---|
| Quadrant | BADHDUFLAG | Total packets | Discarded packets |
| A | 0 | 38 | 0 |
| B | 0 | 38 | 0 |
| C | 0 | 38 | 0 |
| D | 0 | 39 | 0 |
| Quadrant | Total seconds | Saturated seconds | Saturation percentage |
|---|---|---|---|
| A | 4783 | 30 | 0.627221% |
| B | 4783 | 58 | 1.212628% |
| C | 4783 | 100 | 2.090738% |
| D | 4783 | 417 | 8.718378% |
Noise dominated data is calculated using 1-second bins in cleaned event files. If a bin has >2000 counts, and if more than 50% of those come from <1% of pixels, then it is considered to be noise-dominated and hence unusable.
| Quadrant | # 1 sec bins | Bins with >0 counts | Bins with >2000 counts | High rate bins dominated by noise | Noise dominated (total time) | Noise dominated (detector-on time) | Marked lightcurve |
|---|---|---|---|---|---|---|---|
| A | 6906 | 4784 | 21 | 21 | 0.30% | 0.44% | 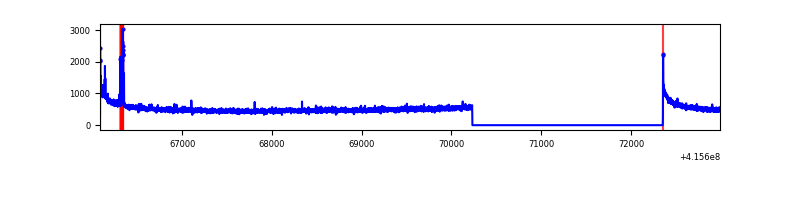 |
| B | 6906 | 4784 | 45 | 45 | 0.65% | 0.94% | 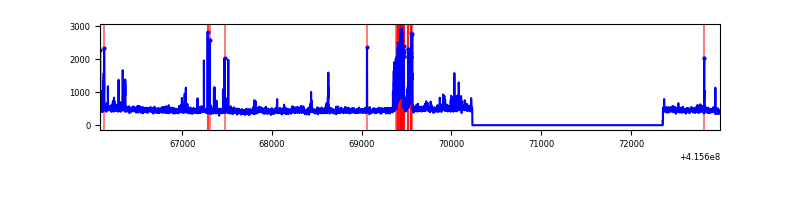 |
| C | 6906 | 4784 | 96 | 96 | 1.39% | 2.01% | 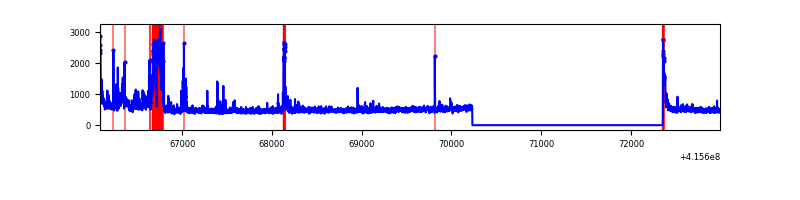 |
| D | 6906 | 4784 | 392 | 392 | 5.68% | 8.19% | 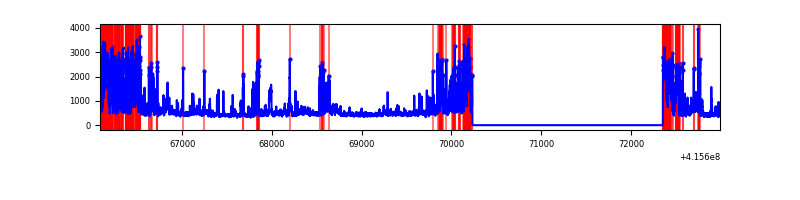 |
Top three noisy pixels from each quadrant. If the there are fewer than three noisy pixels in the level2.evt file, extra rows are filled as -1
| Pixel properties | Quadrant properties | ||||||
|---|---|---|---|---|---|---|---|
| Quadrant | DetID | PixID | Counts | Sigma | Mean | Median | Sigma |
| A | 10 | 83 | 422280 | 3885.81 | 530 | 522 | 108.5 |
| A | 13 | 248 | 51630 | 470.88 | 530 | 522 | 108.5 |
| A | 3 | 137 | 5508 | 45.94 | 530 | 522 | 108.5 |
| B | 5 | 255 | 264908 | 2634.88 | 532 | 519 | 100.3 |
| B | 0 | 245 | 27668 | 270.57 | 532 | 519 | 100.3 |
| B | 4 | 171 | 19419 | 188.36 | 532 | 519 | 100.3 |
| C | 9 | 187 | 401298 | 3317.13 | 524 | 529 | 120.8 |
| C | 15 | 214 | 201519 | 1663.58 | 524 | 529 | 120.8 |
| C | 0 | 10 | 76513 | 628.91 | 524 | 529 | 120.8 |
| D | 12 | 227 | 717678 | 5851.92 | 501 | 489 | 122.6 |
| D | 2 | 249 | 613087 | 4998.51 | 501 | 489 | 122.6 |
| D | 12 | 79 | 299866 | 2442.77 | 501 | 489 | 122.6 |
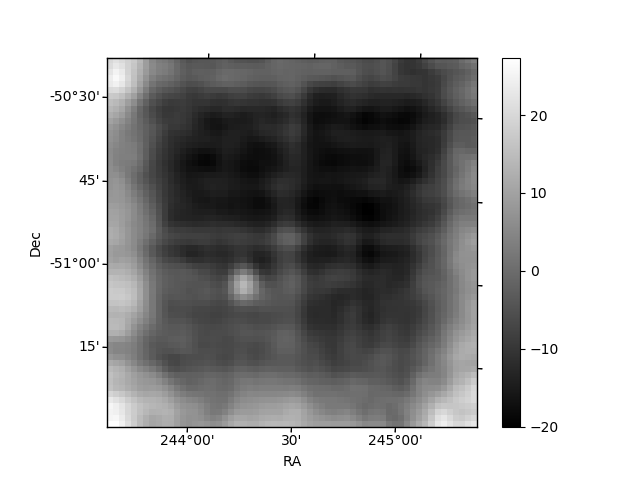
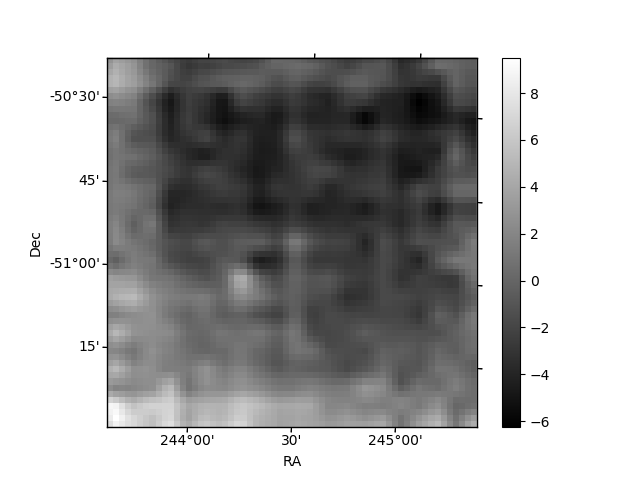
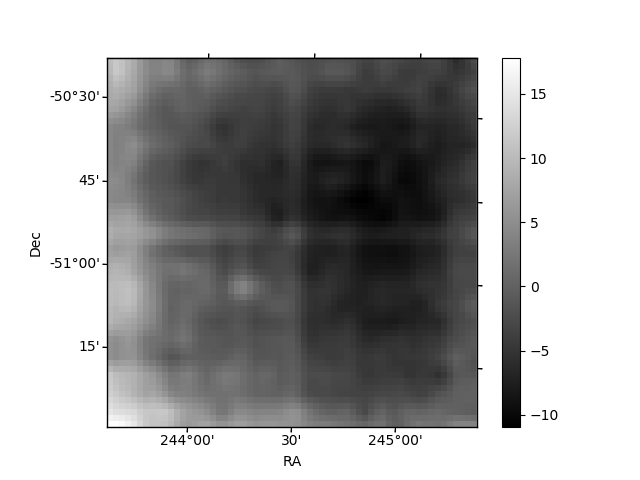
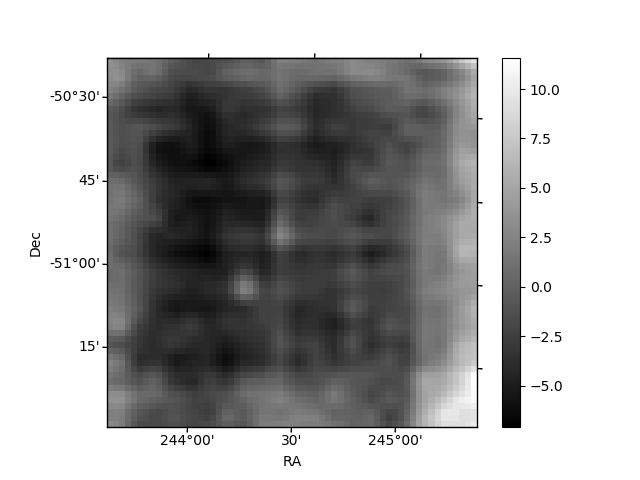
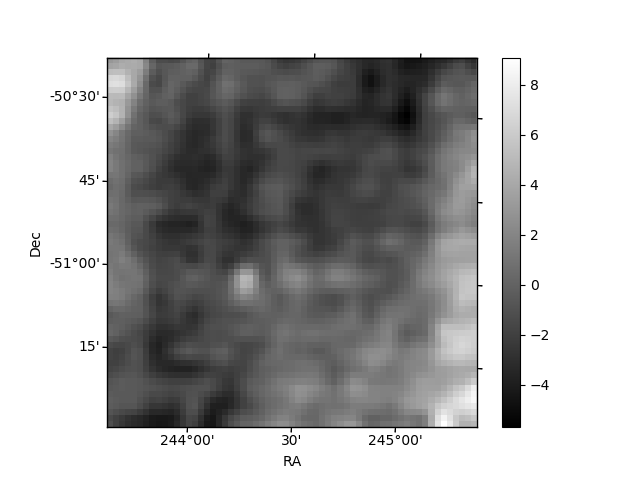
Histogram calculated using DETX and DETY for each event in the final _common_clean file
| Quadrant A | 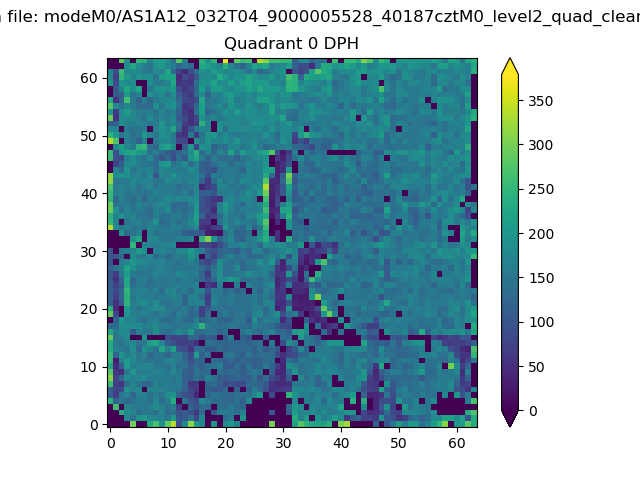 |
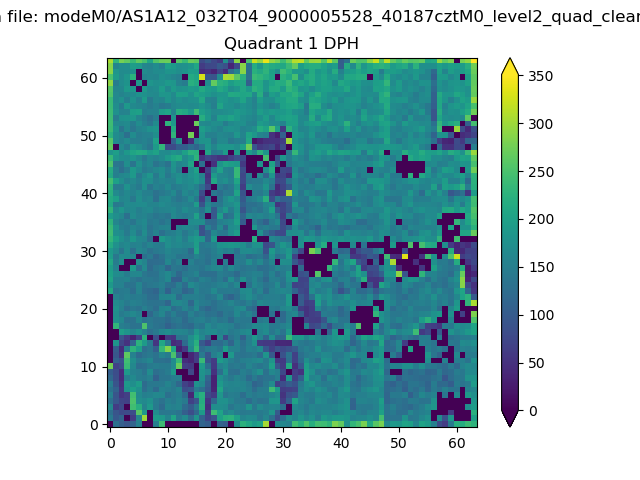 |
Quadrant B |
|---|---|---|---|
| Quadrant D | 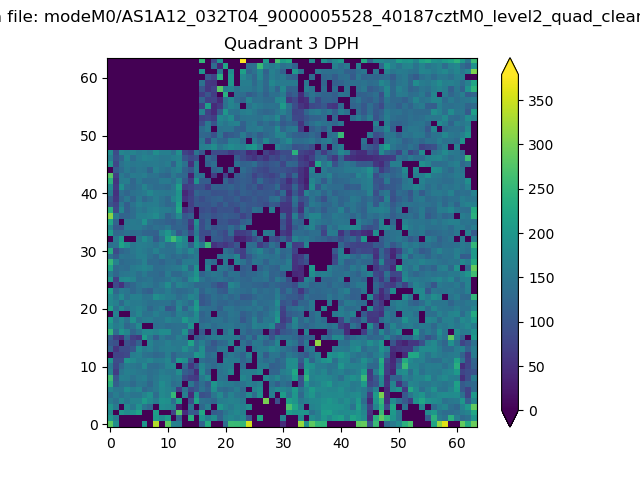 |
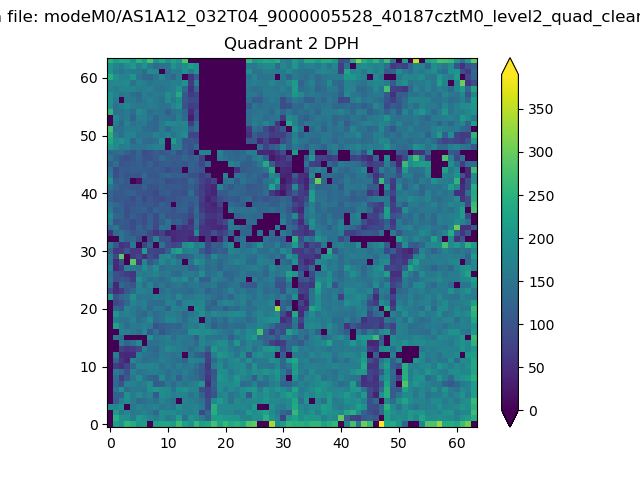 |
Quadrant C |
| Plot type | Count rate plots | Images |
|---|---|---|
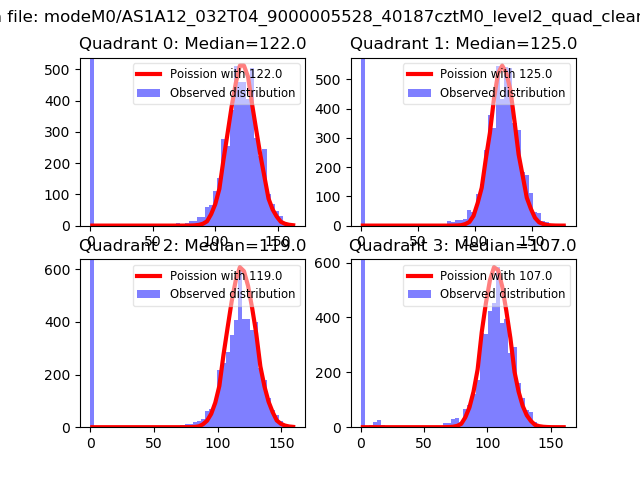
| Comparison with Poisson distribution Blue bars denote a histogram of data divided into 1 sec bins. Red curve is a Poisson curve with rate = median count rate of data. |
 |
 |
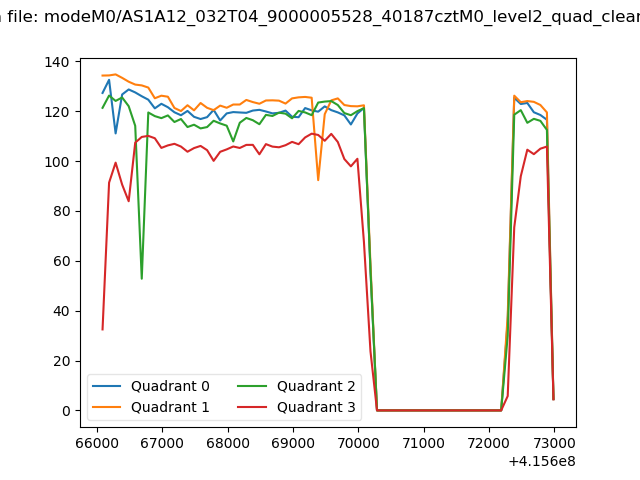
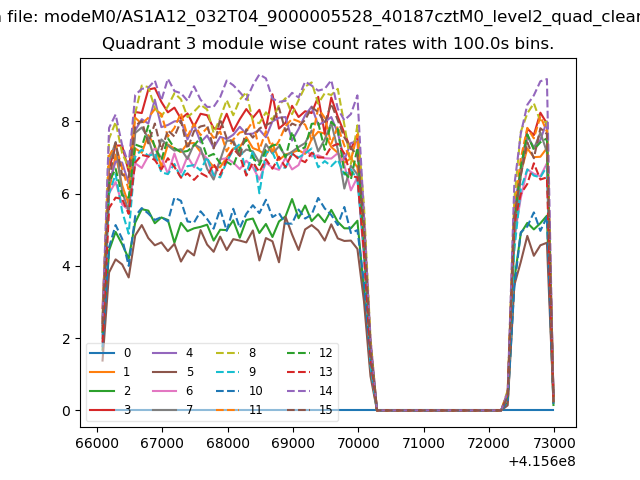
| Quadrant-wise count rates Data is divided into 100 sec bins |
 |
|
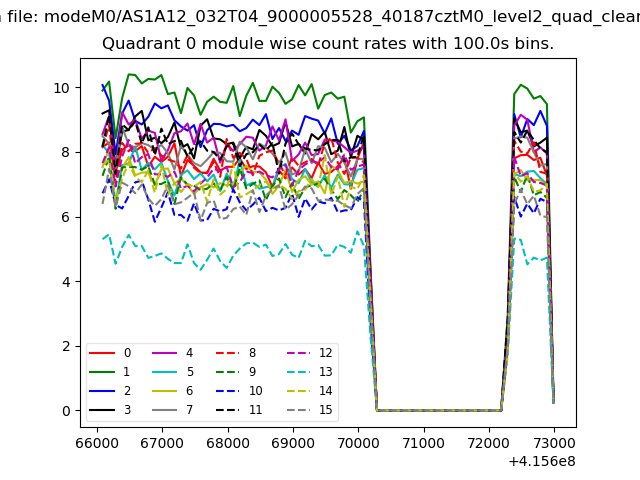
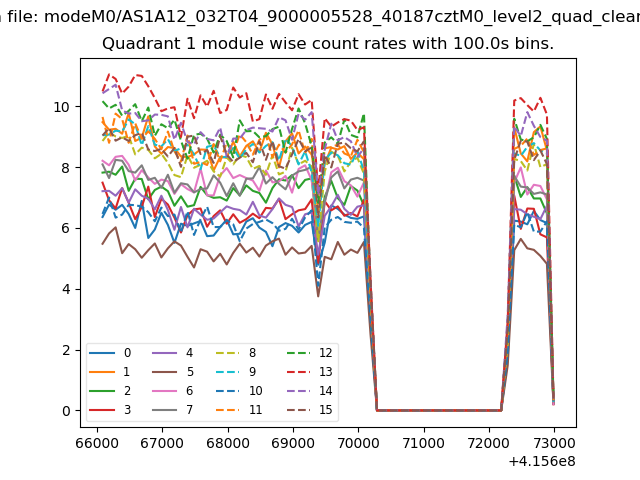
| Module-wise count rates for Quadrant A Data is divided into 100 sec bins |
 |
 |
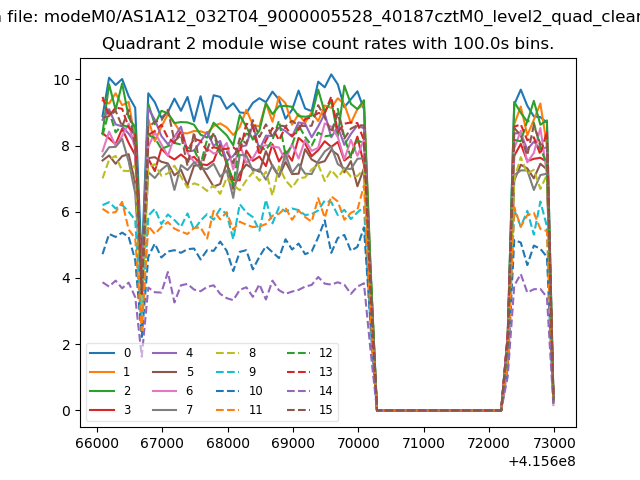
| Module-wise count rates for Quadrant B Data is divided into 100 sec bins |
 |
 |
| Module-wise count rates for Quadrant C Data is divided into 100 sec bins |
 |
 |
| Module-wise count rates for Quadrant D Data is divided into 100 sec bins |
 |
 |
| Parameter | Plot |
|---|---|
| CZT HV Monitor | 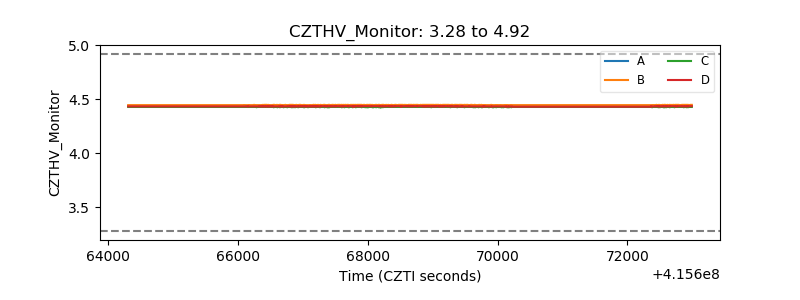 |
| D_VDD | 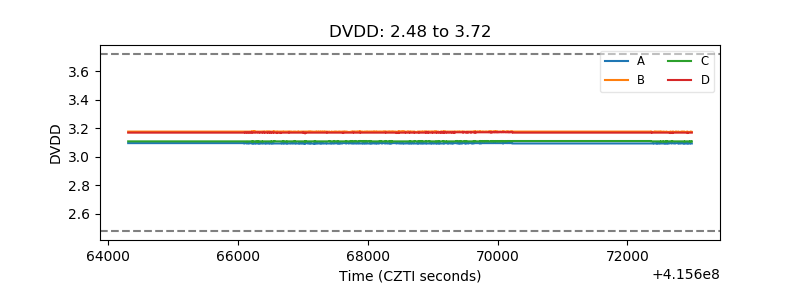 |
| Temperature 1 | 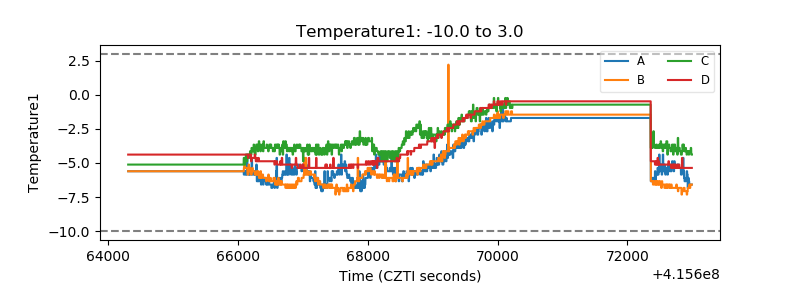 |
| Veto HV Monitor | 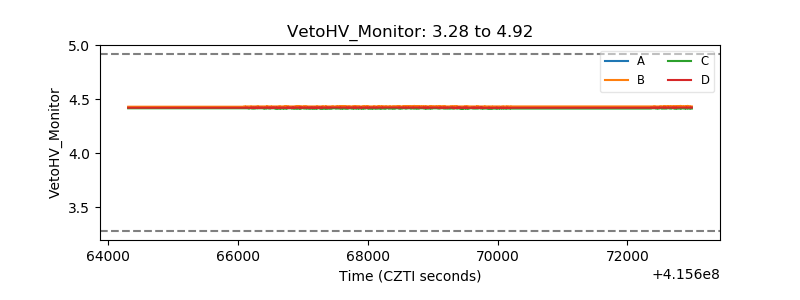 |
| Veto LLD | 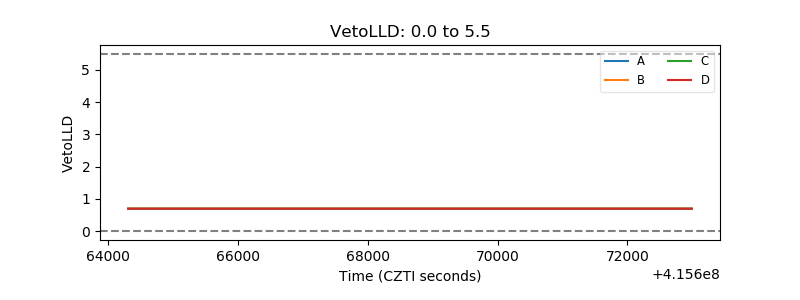 |
| Alpha Counter | 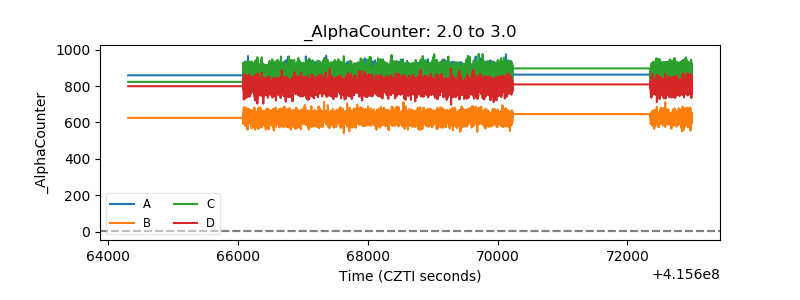 |
| _CPM_Rate | 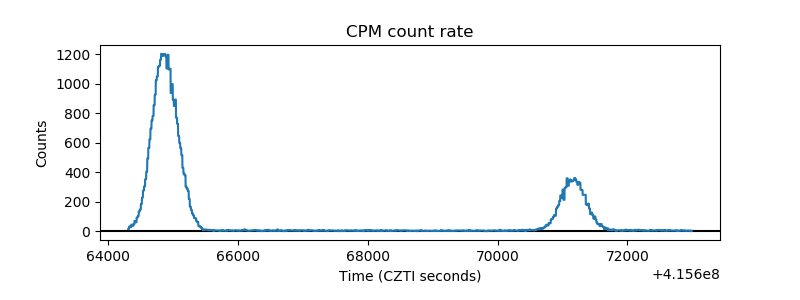 |
| CZT Counter | 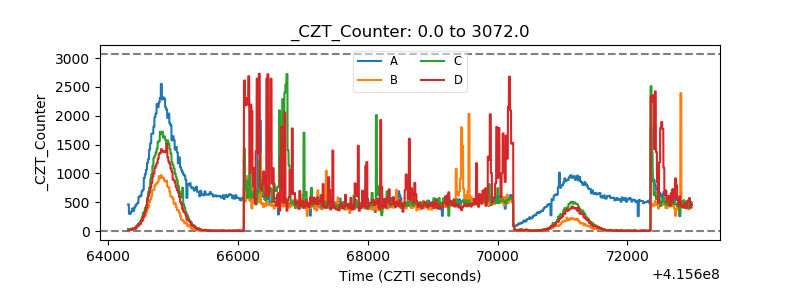 |
| +2.5 Volts monitor | 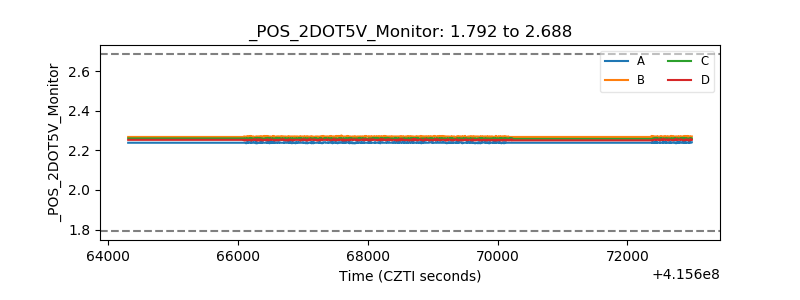 |
| +5 Volts monitor | 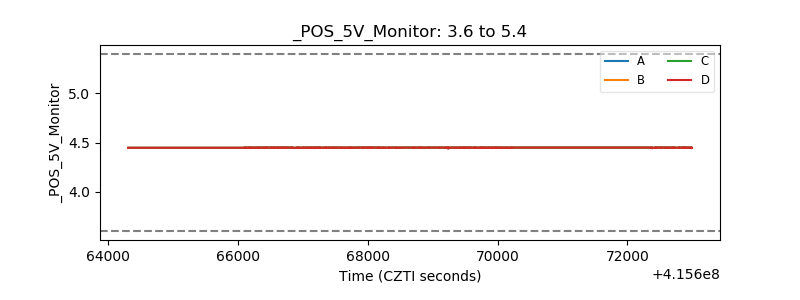 |
| _ROLL_ROT | 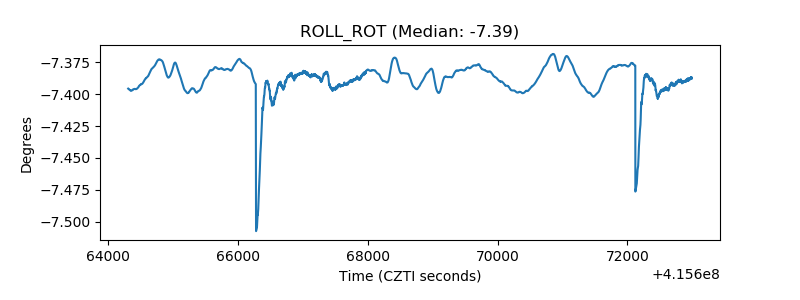 |
| _Roll_DEC | 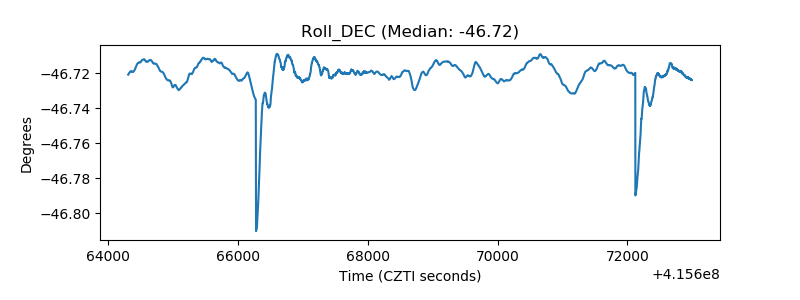 |
| _Roll_RA | 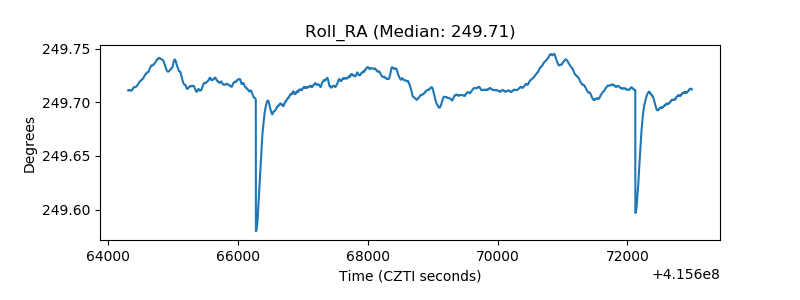 |
| Veto Counter | 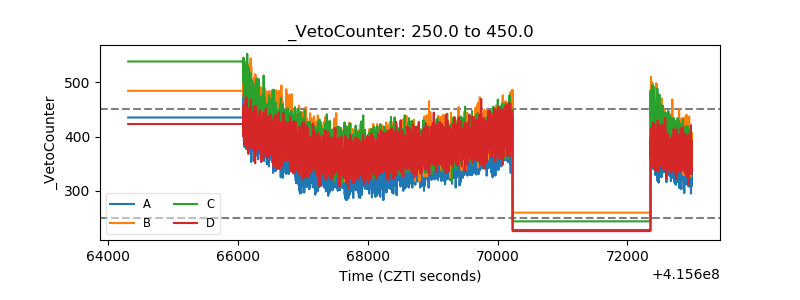 |