| Param | Original file | Final file |
|---|---|---|
| Filename | modeM0/AS1A12_032T04_9000005528_40188cztM0_level2.fits | modeM0/AS1A12_032T04_9000005528_40188cztM0_level2_quad_clean.evt |
| Size (bytes) | 368,441,280 | 92,200,320 |
| Size | 351.4 MB | 87.9 MB |
| Events in quadrant A | 2,851,246 | 633,147 |
| Events in quadrant B | 2,636,256 | 651,064 |
| Events in quadrant C | 2,785,657 | 625,500 |
| Events in quadrant D | 4,938,234 | 498,373 |
| Mode SS | |||
|---|---|---|---|
| Quadrant | BADHDUFLAG | Total packets | Discarded packets |
| A | 0 | 114 | 0 |
| B | 0 | 114 | 0 |
| C | 0 | 114 | 0 |
| D | 0 | 114 | 0 |
| Mode M0 | |||
|---|---|---|---|
| Quadrant | BADHDUFLAG | Total packets | Discarded packets |
| A | 0 | 11847 | 3 |
| B | 0 | 11741 | 2 |
| C | 0 | 11543 | 2 |
| D | 0 | 18549 | 2 |
| Mode M9 | |||
|---|---|---|---|
| Quadrant | BADHDUFLAG | Total packets | Discarded packets |
| A | 0 | 41 | 0 |
| B | 0 | 41 | 0 |
| C | 0 | 41 | 0 |
| D | 0 | 41 | 0 |
| Quadrant | Total seconds | Saturated seconds | Saturation percentage |
|---|---|---|---|
| A | 5485 | 19 | 0.346399% |
| B | 5485 | 31 | 0.565178% |
| C | 5485 | 14 | 0.255242% |
| D | 5485 | 814 | 14.840474% |
Noise dominated data is calculated using 1-second bins in cleaned event files. If a bin has >2000 counts, and if more than 50% of those come from <1% of pixels, then it is considered to be noise-dominated and hence unusable.
| Quadrant | # 1 sec bins | Bins with >0 counts | Bins with >2000 counts | High rate bins dominated by noise | Noise dominated (total time) | Noise dominated (detector-on time) | Marked lightcurve |
|---|---|---|---|---|---|---|---|
| A | 9551 | 5487 | 11 | 11 | 0.12% | 0.20% | 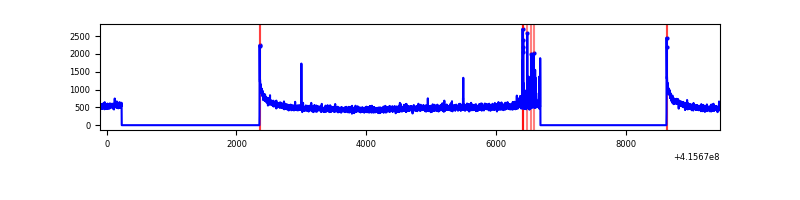 |
| B | 9551 | 5487 | 12 | 12 | 0.13% | 0.22% |  |
| C | 9551 | 5487 | 11 | 11 | 0.12% | 0.20% | 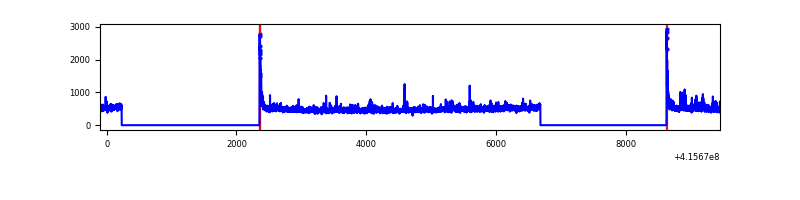 |
| D | 9551 | 5487 | 699 | 699 | 7.32% | 12.74% | 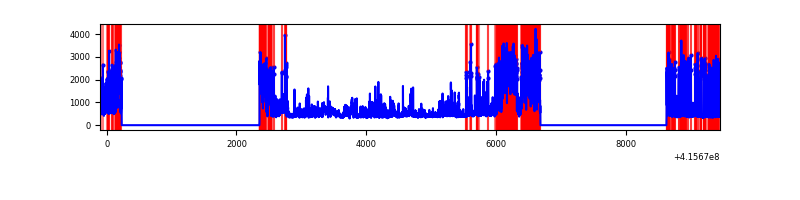 |
Top three noisy pixels from each quadrant. If the there are fewer than three noisy pixels in the level2.evt file, extra rows are filled as -1
| Pixel properties | Quadrant properties | ||||||
|---|---|---|---|---|---|---|---|
| Quadrant | DetID | PixID | Counts | Sigma | Mean | Median | Sigma |
| A | 10 | 83 | 474964 | 3888.34 | 601 | 592 | 122.0 |
| A | 13 | 248 | 50814 | 411.66 | 601 | 592 | 122.0 |
| A | 13 | 254 | 6531 | 48.68 | 601 | 592 | 122.0 |
| B | 0 | 229 | 122445 | 1053.82 | 601 | 585 | 115.6 |
| B | 5 | 255 | 100333 | 862.6 | 601 | 585 | 115.6 |
| B | 4 | 171 | 21475 | 180.65 | 601 | 585 | 115.6 |
| C | 15 | 214 | 230648 | 1662.6 | 596 | 602 | 138.4 |
| C | 4 | 254 | 77949 | 559.01 | 596 | 602 | 138.4 |
| C | 0 | 10 | 76302 | 547.1 | 596 | 602 | 138.4 |
| D | 2 | 249 | 1364928 | 10285.86 | 547 | 533 | 132.6 |
| D | 12 | 227 | 959672 | 7230.73 | 547 | 533 | 132.6 |
| D | 12 | 79 | 314166 | 2364.41 | 547 | 533 | 132.6 |
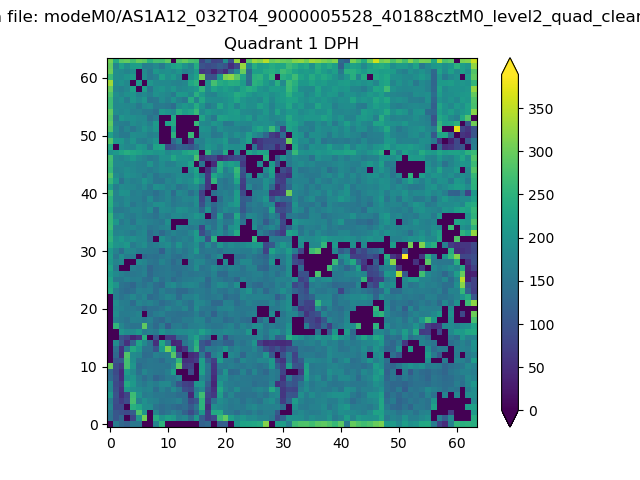
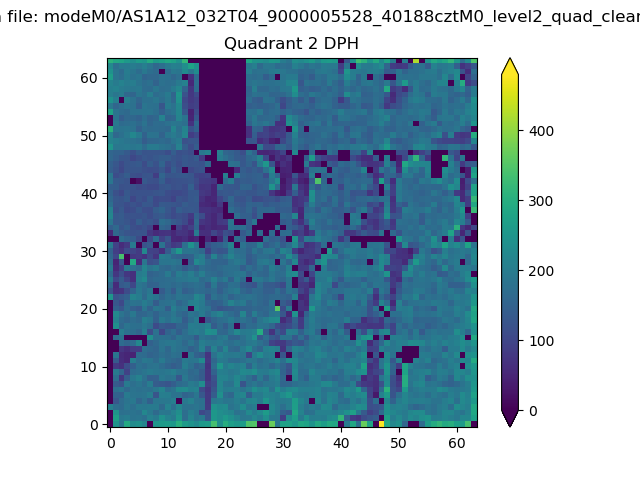
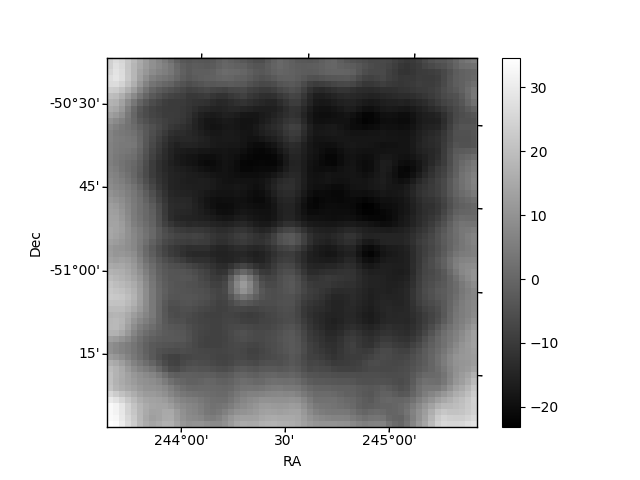
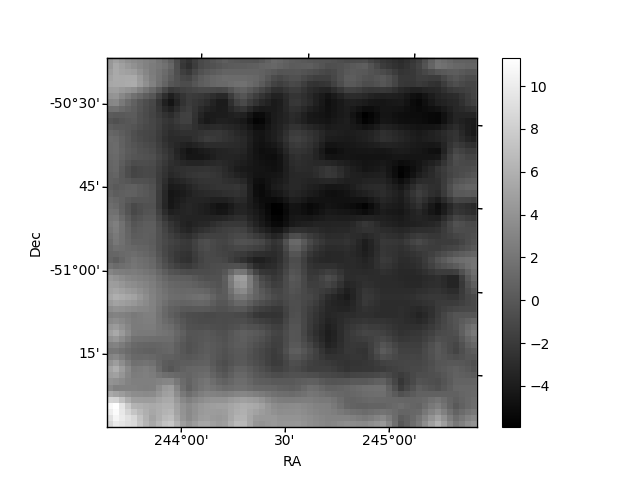
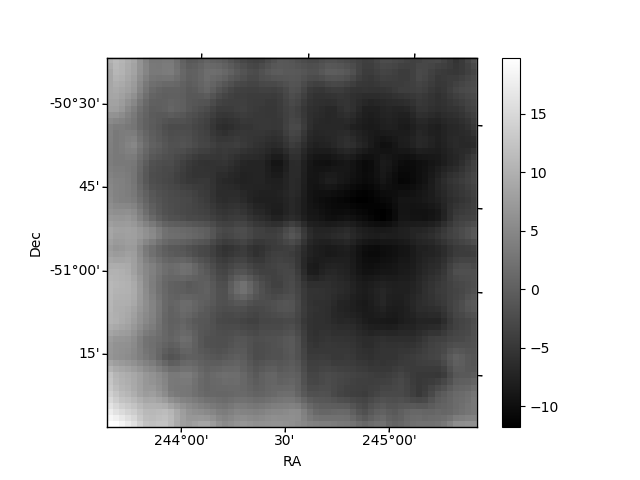
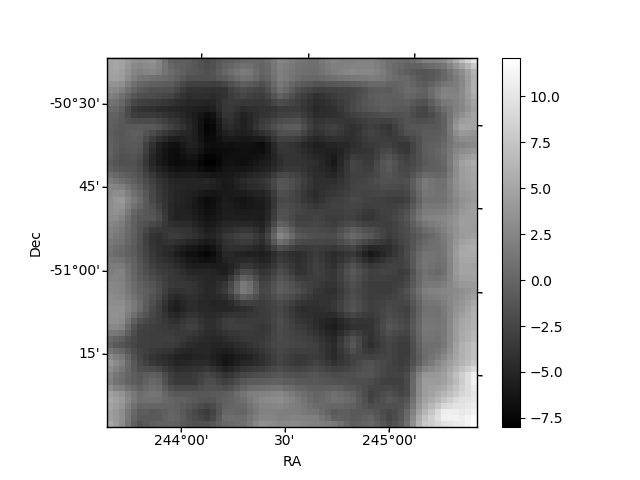
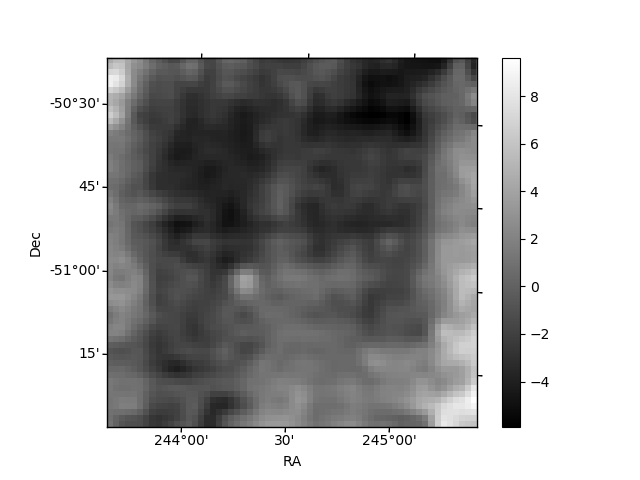
Histogram calculated using DETX and DETY for each event in the final _common_clean file
| Quadrant A | 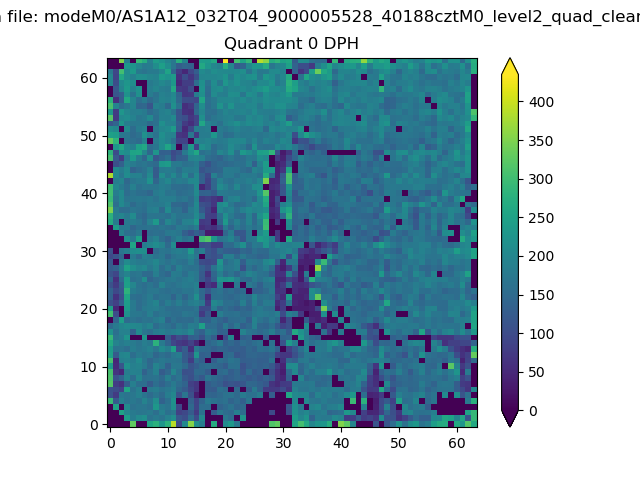 |
 |
Quadrant B |
|---|---|---|---|
| Quadrant D | 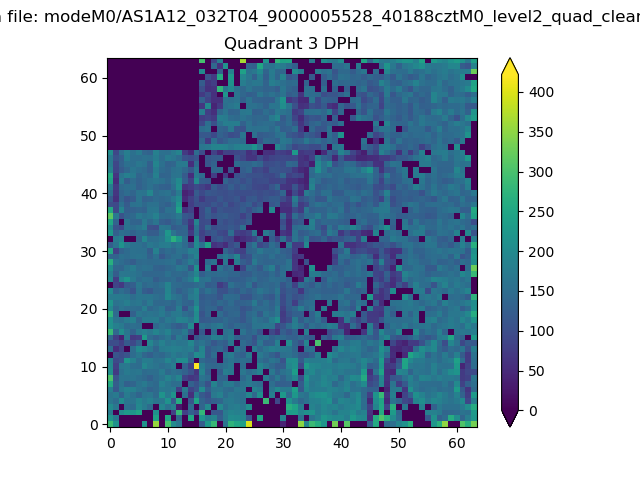 |
 |
Quadrant C |
| Plot type | Count rate plots | Images |
|---|---|---|
| Comparison with Poisson distribution Blue bars denote a histogram of data divided into 1 sec bins. Red curve is a Poisson curve with rate = median count rate of data. |
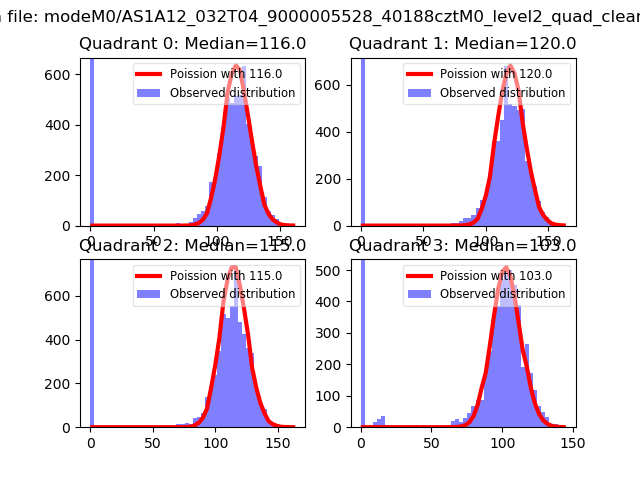 |
 |
| Quadrant-wise count rates Data is divided into 100 sec bins |
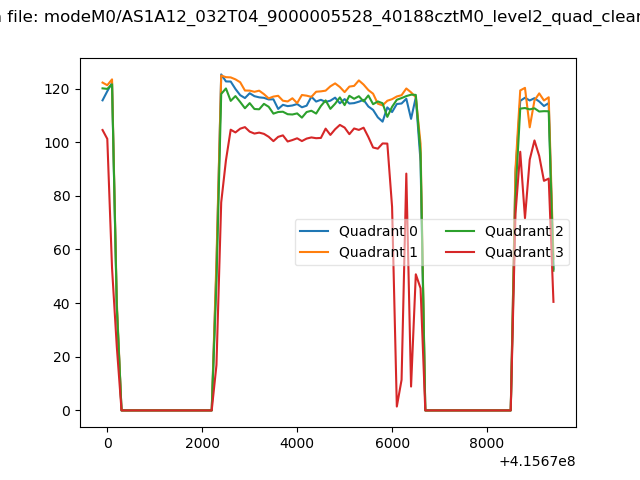 |
|
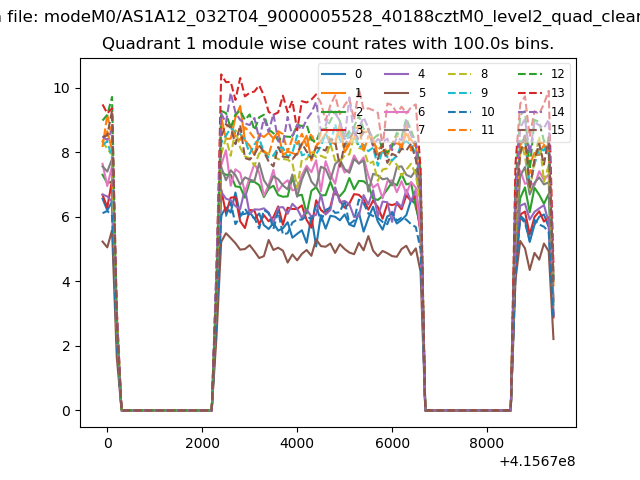
| Module-wise count rates for Quadrant A Data is divided into 100 sec bins |
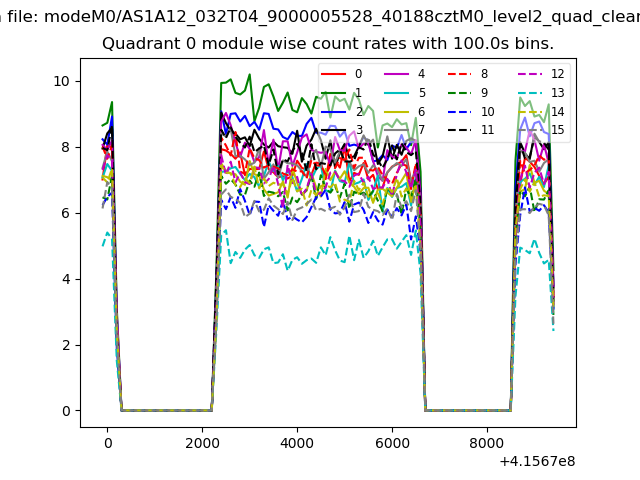 |
 |
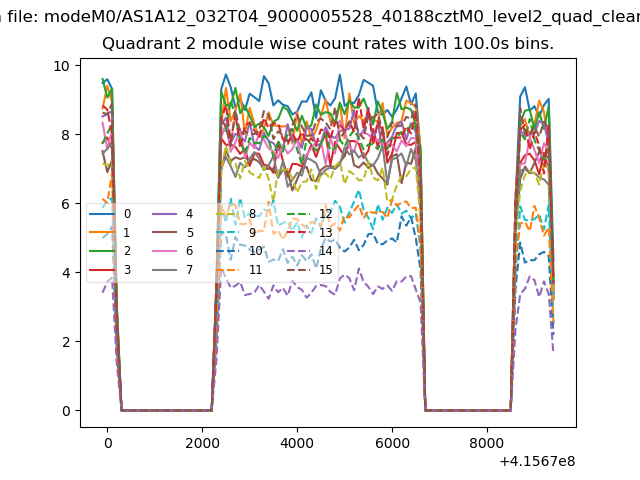
| Module-wise count rates for Quadrant B Data is divided into 100 sec bins |
 |
 |
| Module-wise count rates for Quadrant C Data is divided into 100 sec bins |
 |
 |
| Module-wise count rates for Quadrant D Data is divided into 100 sec bins |
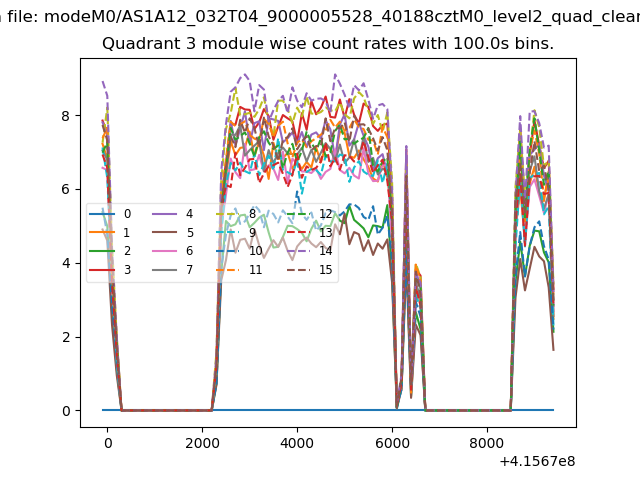 |
 |
| Parameter | Plot |
|---|---|
| CZT HV Monitor | 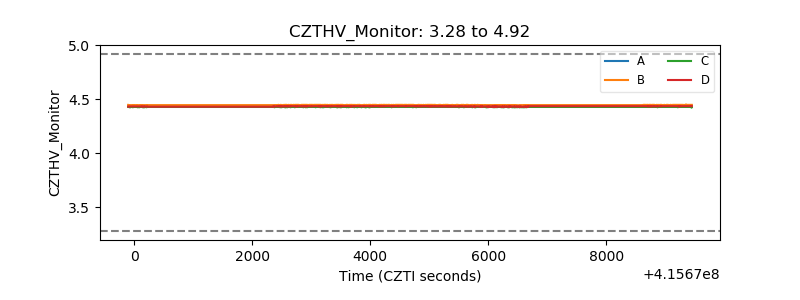 |
| D_VDD | 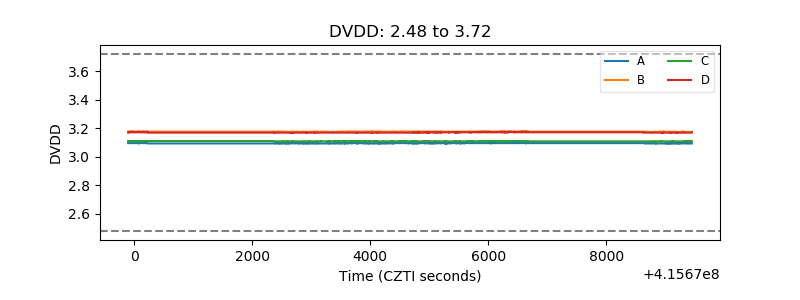 |
| Temperature 1 | 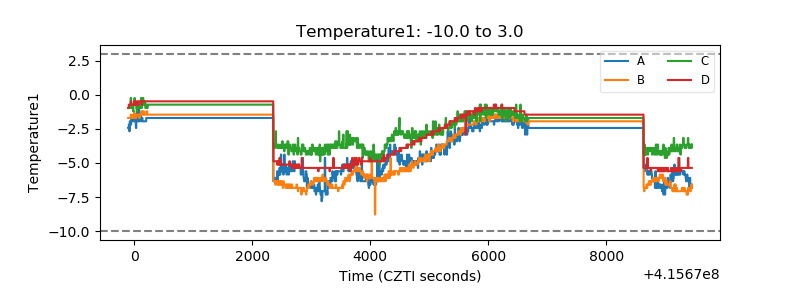 |
| Veto HV Monitor | 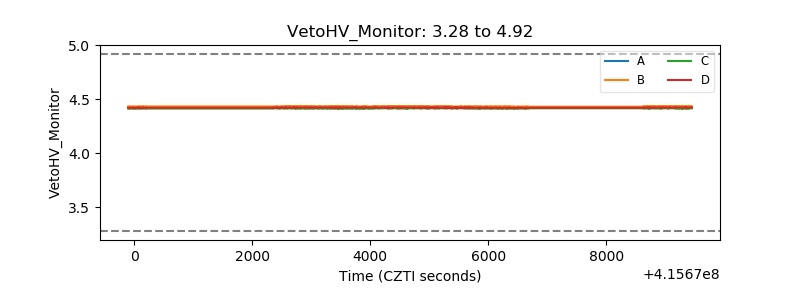 |
| Veto LLD | 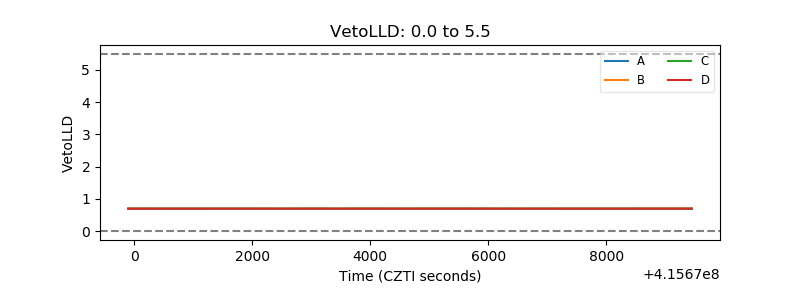 |
| Alpha Counter | 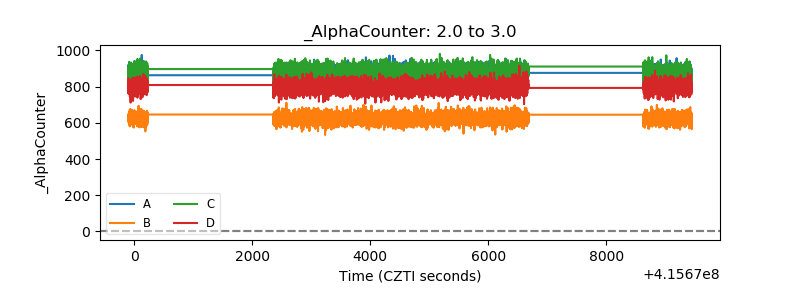 |
| _CPM_Rate | 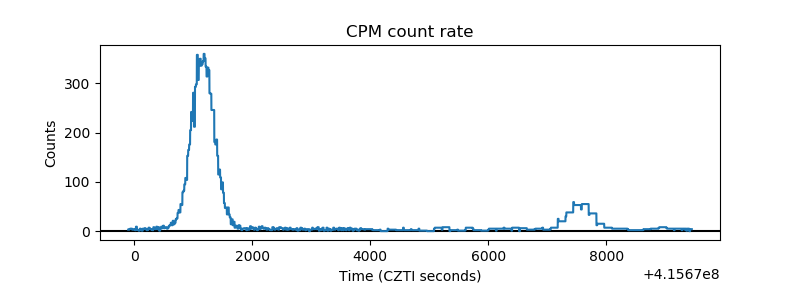 |
| CZT Counter | 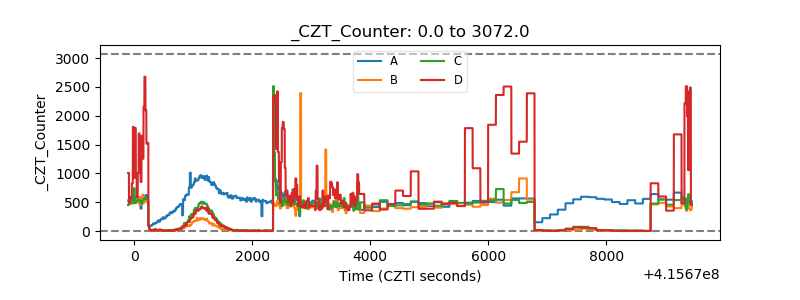 |
| +2.5 Volts monitor |  |
| +5 Volts monitor | 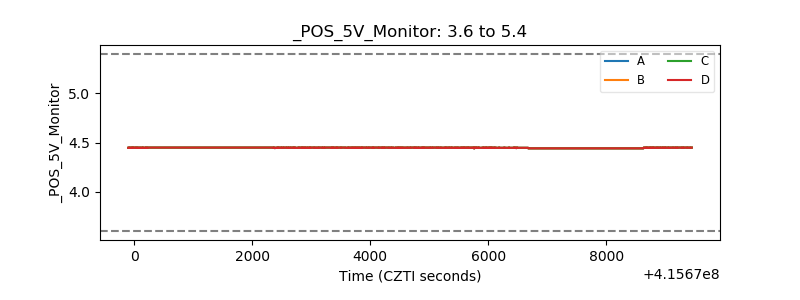 |
| _ROLL_ROT | 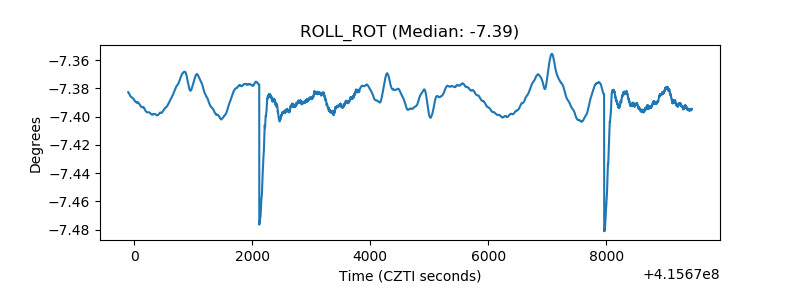 |
| _Roll_DEC | 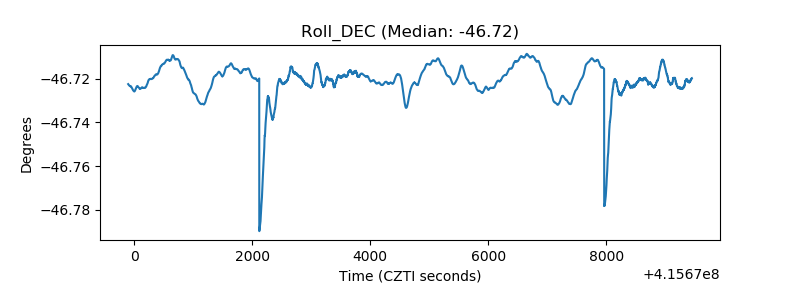 |
| _Roll_RA | 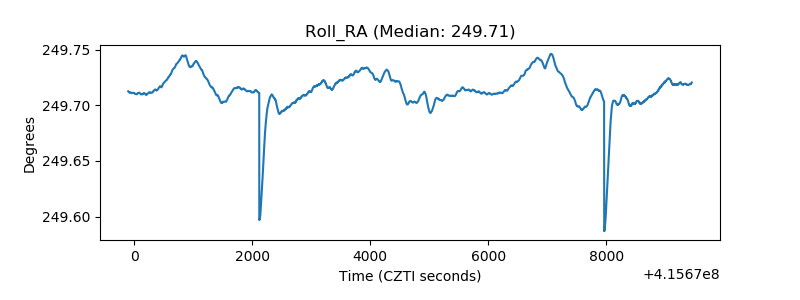 |
| Veto Counter | 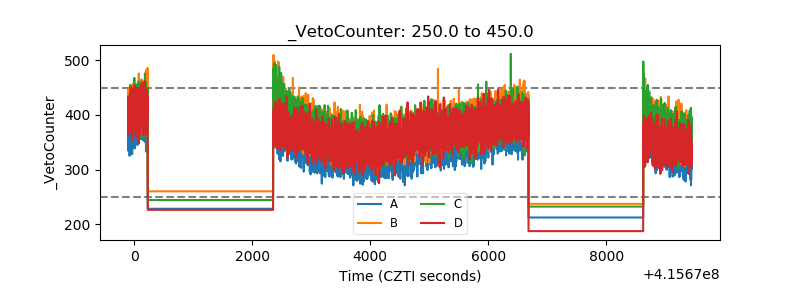 |