| Param | Original file | Final file |
|---|---|---|
| Filename | modeM0/AS1A12_032T04_9000005528_40189cztM0_level2.fits | modeM0/AS1A12_032T04_9000005528_40189cztM0_level2_quad_clean.evt |
| Size (bytes) | 363,522,240 | 91,509,120 |
| Size | 346.7 MB | 87.3 MB |
| Events in quadrant A | 2,948,673 | 616,515 |
| Events in quadrant B | 2,544,491 | 631,693 |
| Events in quadrant C | 3,299,852 | 608,198 |
| Events in quadrant D | 4,235,785 | 530,399 |
| Mode SS | |||
|---|---|---|---|
| Quadrant | BADHDUFLAG | Total packets | Discarded packets |
| A | 0 | 110 | 0 |
| B | 0 | 110 | 0 |
| C | 0 | 110 | 0 |
| D | 0 | 110 | 0 |
| Mode M0 | |||
|---|---|---|---|
| Quadrant | BADHDUFLAG | Total packets | Discarded packets |
| A | 0 | 12157 | 3 |
| B | 0 | 11498 | 2 |
| C | 0 | 13310 | 2 |
| D | 0 | 16498 | 2 |
| Mode M9 | |||
|---|---|---|---|
| Quadrant | BADHDUFLAG | Total packets | Discarded packets |
| A | 0 | 34 | 0 |
| B | 0 | 34 | 0 |
| C | 0 | 34 | 0 |
| D | 0 | 35 | 0 |
| Quadrant | Total seconds | Saturated seconds | Saturation percentage |
|---|---|---|---|
| A | 5493 | 48 | 0.873839% |
| B | 5493 | 42 | 0.764610% |
| C | 5493 | 60 | 1.092299% |
| D | 5493 | 452 | 8.228655% |
Noise dominated data is calculated using 1-second bins in cleaned event files. If a bin has >2000 counts, and if more than 50% of those come from <1% of pixels, then it is considered to be noise-dominated and hence unusable.
| Quadrant | # 1 sec bins | Bins with >0 counts | Bins with >2000 counts | High rate bins dominated by noise | Noise dominated (total time) | Noise dominated (detector-on time) | Marked lightcurve |
|---|---|---|---|---|---|---|---|
| A | 7076 | 5494 | 24 | 24 | 0.34% | 0.44% | 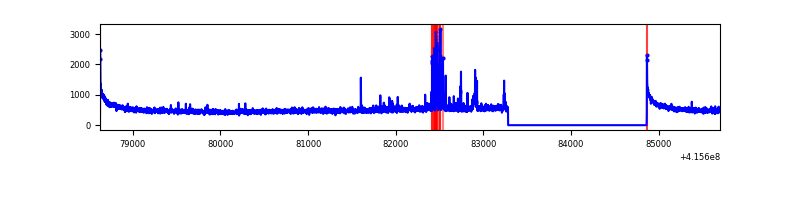 |
| B | 7076 | 5494 | 19 | 19 | 0.27% | 0.35% | 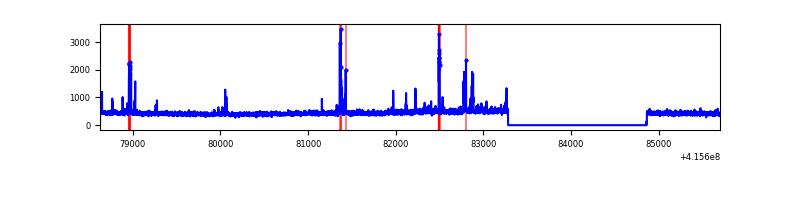 |
| C | 7076 | 5494 | 54 | 54 | 0.76% | 0.98% | 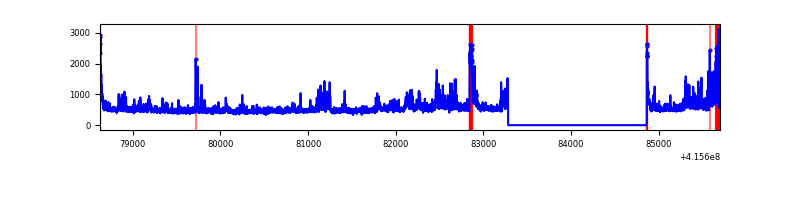 |
| D | 7076 | 5494 | 434 | 434 | 6.13% | 7.90% | 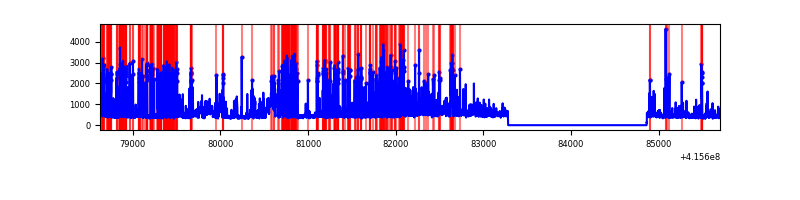 |
Top three noisy pixels from each quadrant. If the there are fewer than three noisy pixels in the level2.evt file, extra rows are filled as -1
| Pixel properties | Quadrant properties | ||||||
|---|---|---|---|---|---|---|---|
| Quadrant | DetID | PixID | Counts | Sigma | Mean | Median | Sigma |
| A | 10 | 83 | 479477 | 3931.24 | 597 | 586 | 121.8 |
| A | 13 | 248 | 136430 | 1115.15 | 597 | 586 | 121.8 |
| A | 2 | 79 | 21782 | 174.0 | 597 | 586 | 121.8 |
| B | 5 | 255 | 145821 | 1271.1 | 595 | 578 | 114.3 |
| B | 0 | 229 | 17065 | 144.29 | 595 | 578 | 114.3 |
| B | 12 | 111 | 14490 | 121.75 | 595 | 578 | 114.3 |
| C | 4 | 254 | 559434 | 4059.27 | 587 | 593 | 137.7 |
| C | 15 | 214 | 230038 | 1666.63 | 587 | 593 | 137.7 |
| C | 5 | 250 | 85363 | 615.75 | 587 | 593 | 137.7 |
| D | 12 | 227 | 1810211 | 13002.69 | 571 | 558 | 139.2 |
| D | 2 | 249 | 88798 | 634.02 | 571 | 558 | 139.2 |
| D | 13 | 249 | 66191 | 471.59 | 571 | 558 | 139.2 |
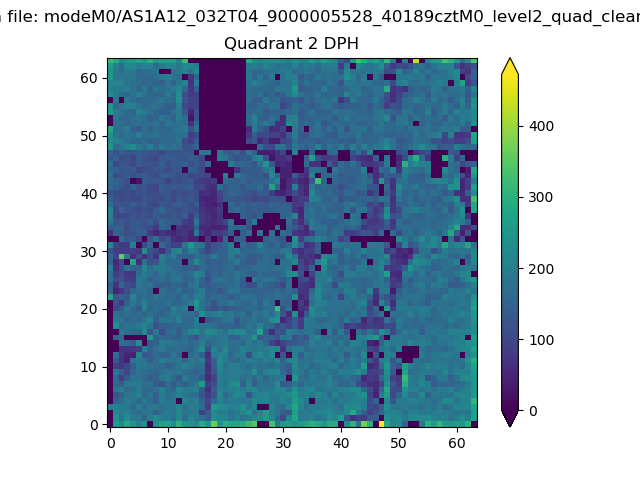
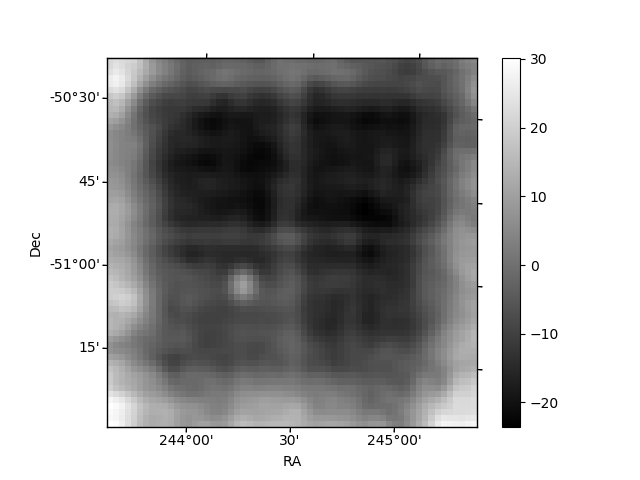
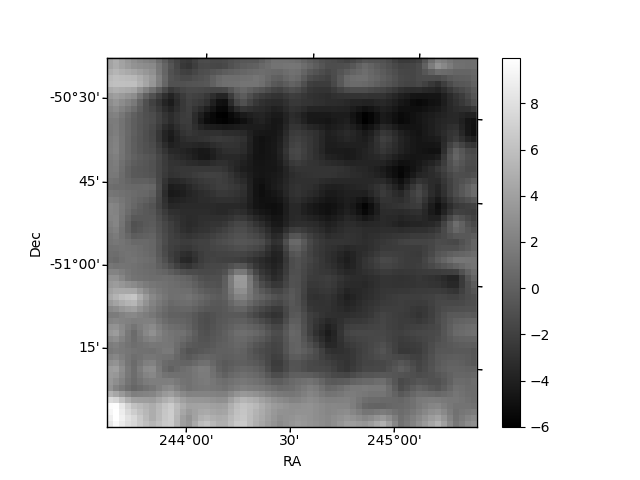
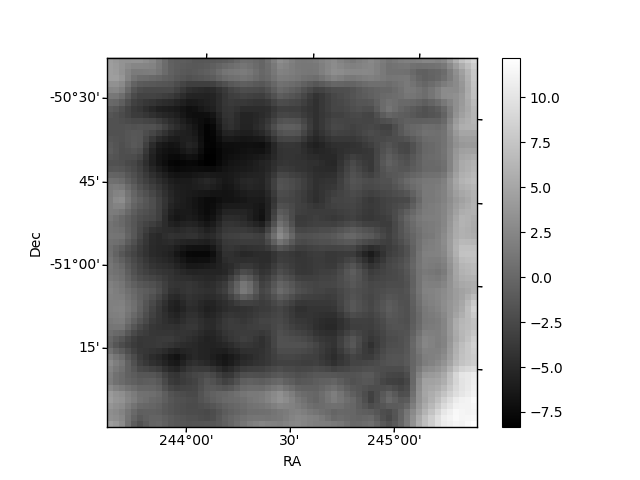
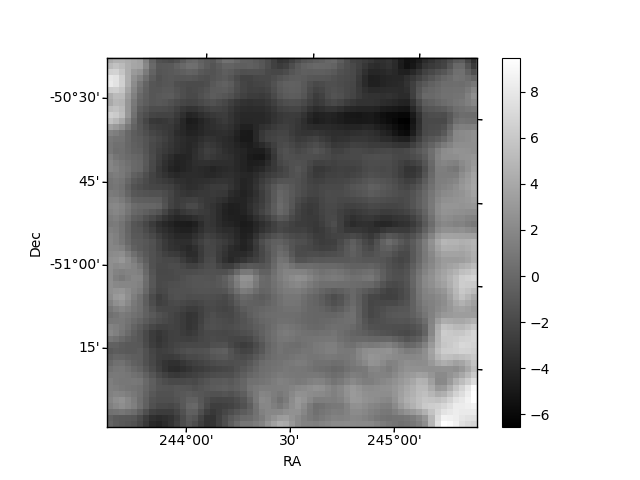
Histogram calculated using DETX and DETY for each event in the final _common_clean file
| Quadrant A | 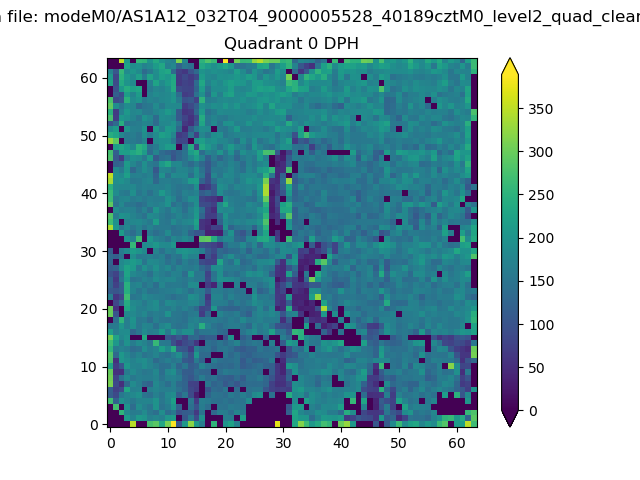 |
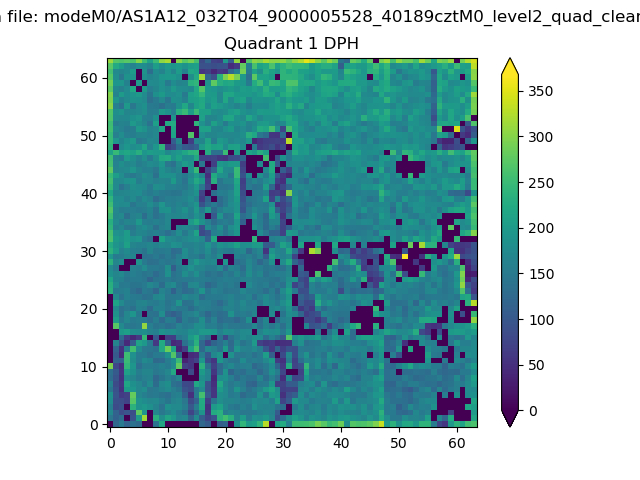 |
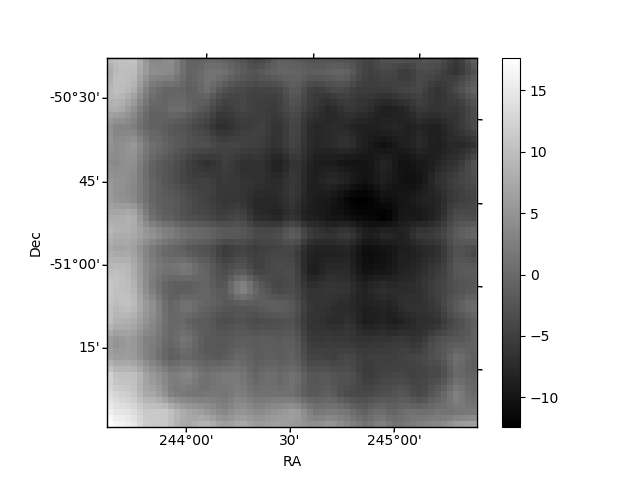
Quadrant B |
|---|---|---|---|
| Quadrant D | 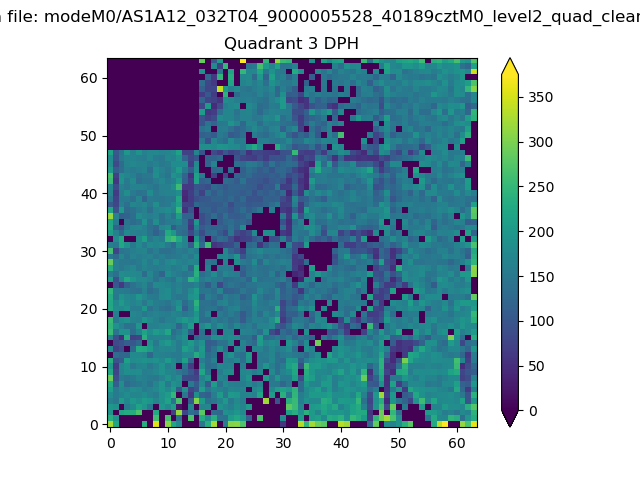 |
 |
Quadrant C |
| Plot type | Count rate plots | Images |
|---|---|---|
| Comparison with Poisson distribution Blue bars denote a histogram of data divided into 1 sec bins. Red curve is a Poisson curve with rate = median count rate of data. |
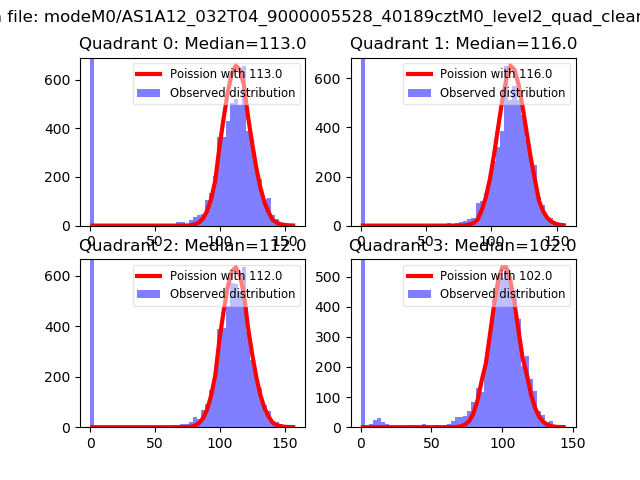 |
 |
| Quadrant-wise count rates Data is divided into 100 sec bins |
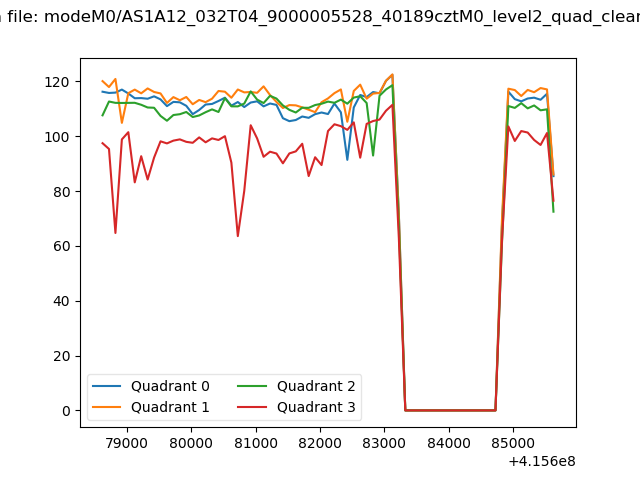 |
|
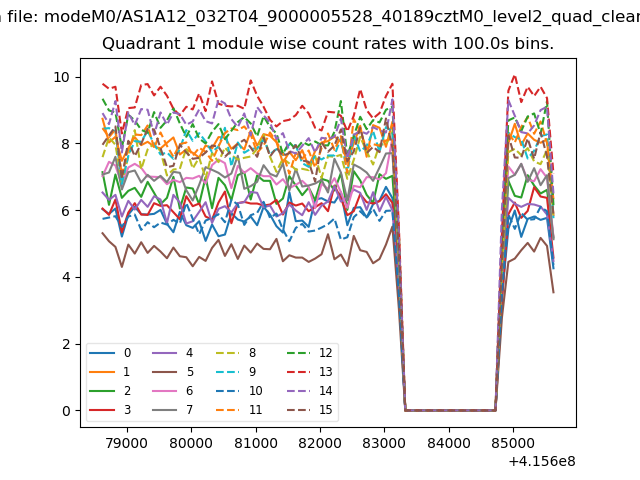
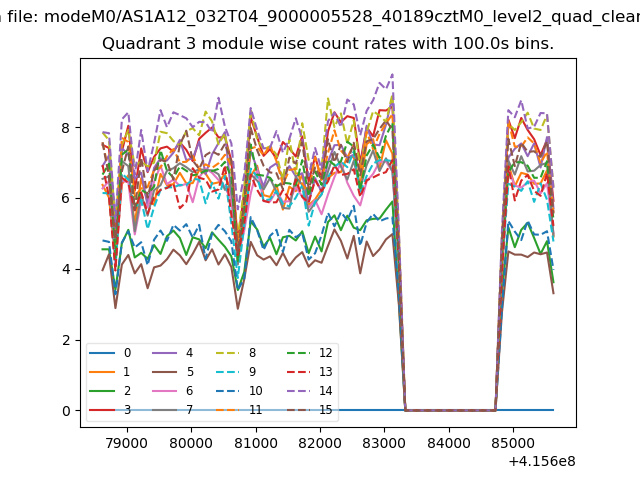
| Module-wise count rates for Quadrant A Data is divided into 100 sec bins |
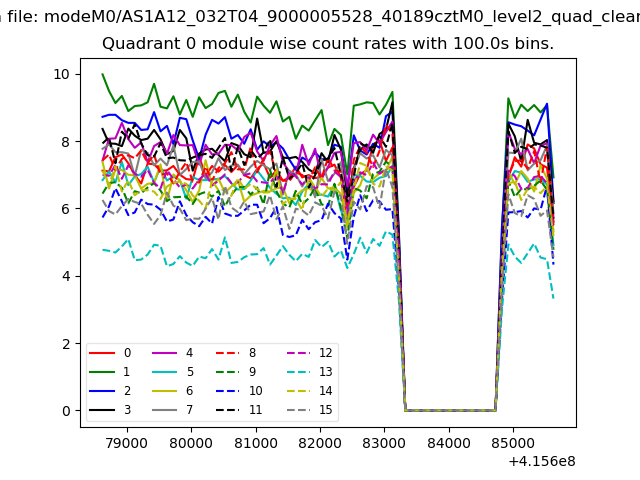 |
 |
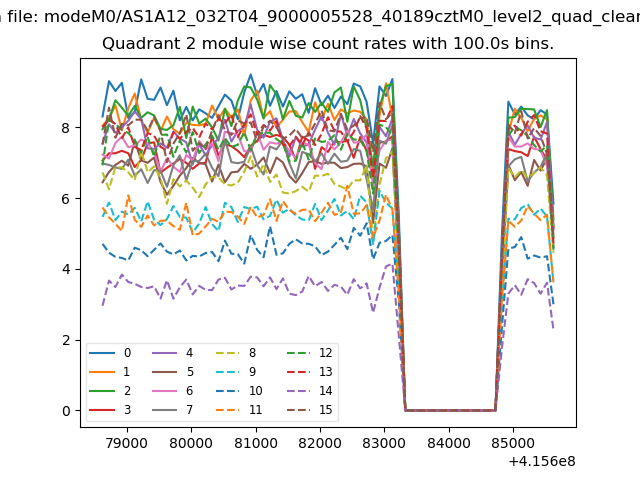
| Module-wise count rates for Quadrant B Data is divided into 100 sec bins |
 |
 |
| Module-wise count rates for Quadrant C Data is divided into 100 sec bins |
 |
 |
| Module-wise count rates for Quadrant D Data is divided into 100 sec bins |
 |
 |
| Parameter | Plot |
|---|---|
| CZT HV Monitor | 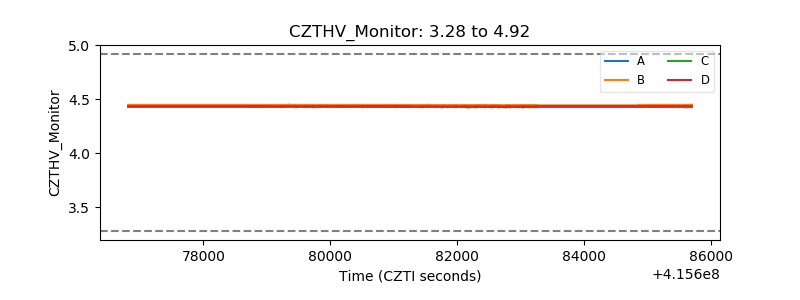 |
| D_VDD | 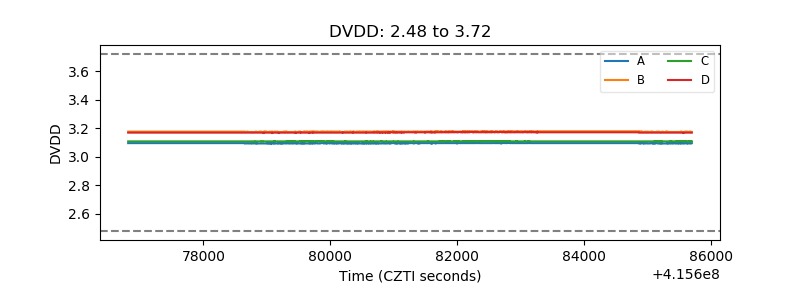 |
| Temperature 1 | 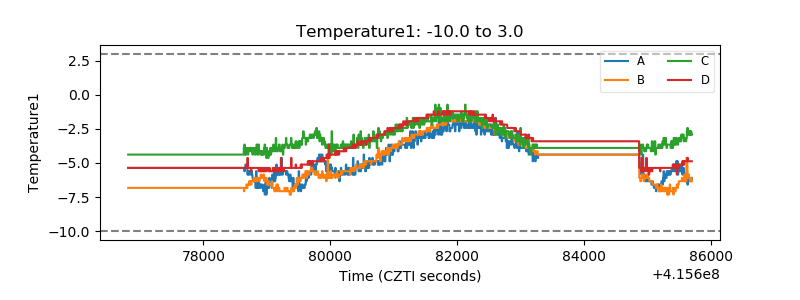 |
| Veto HV Monitor |  |
| Veto LLD | 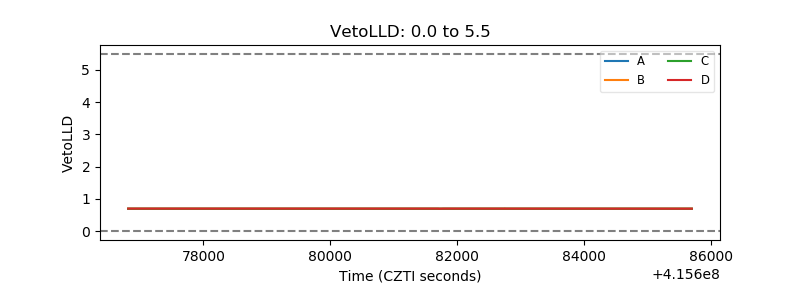 |
| Alpha Counter | 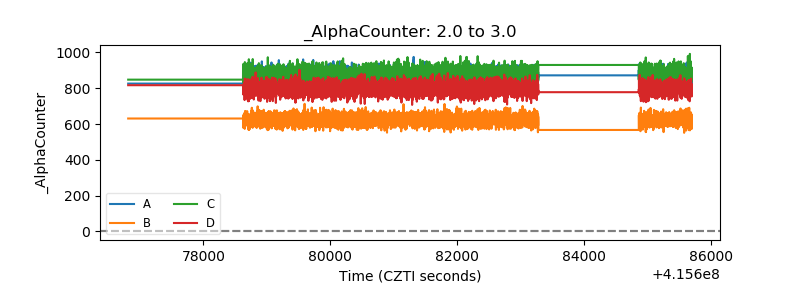 |
| _CPM_Rate | 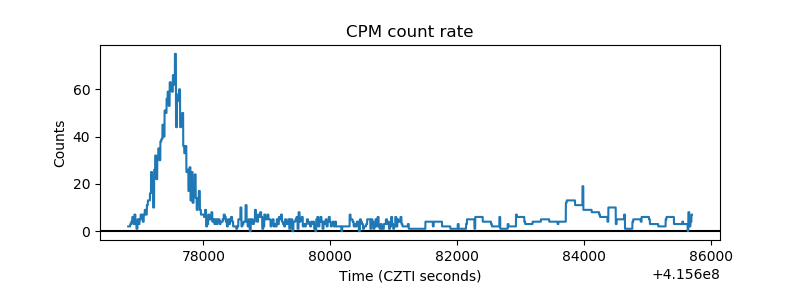 |
| CZT Counter | 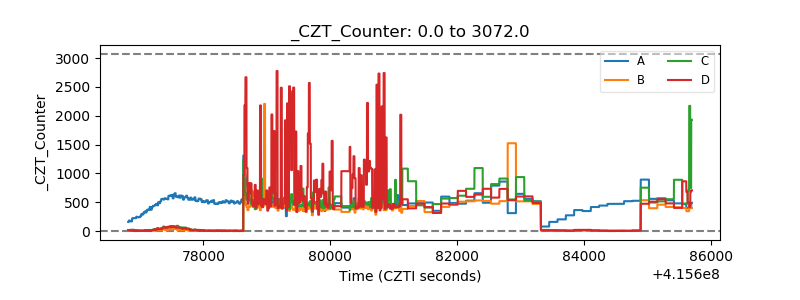 |
| +2.5 Volts monitor | 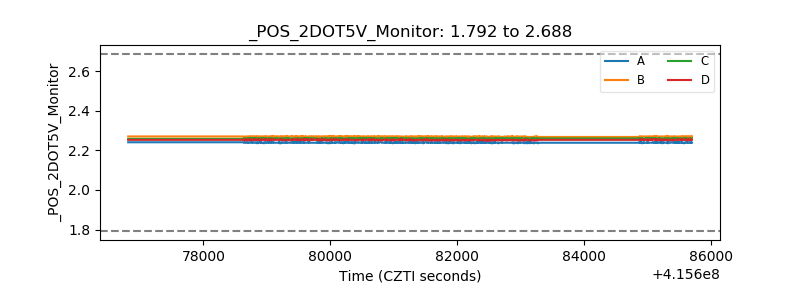 |
| +5 Volts monitor | 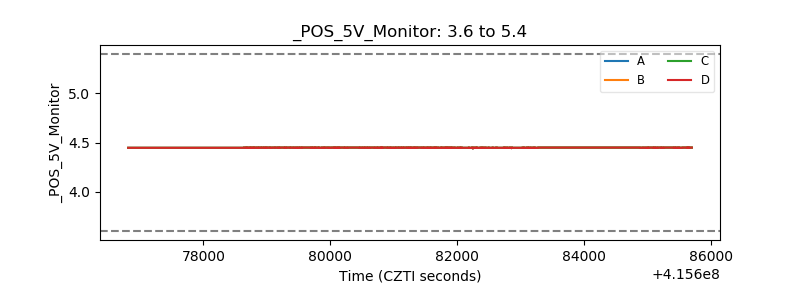 |
| _ROLL_ROT | 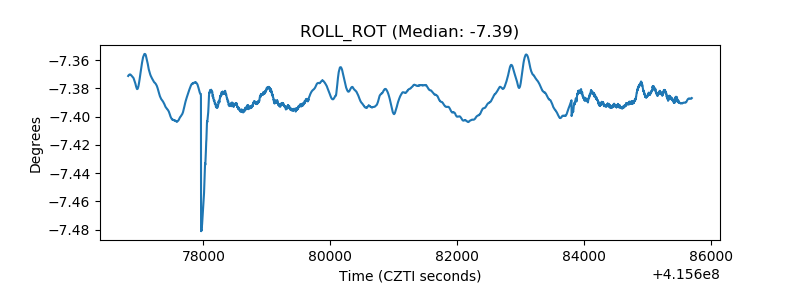 |
| _Roll_DEC | 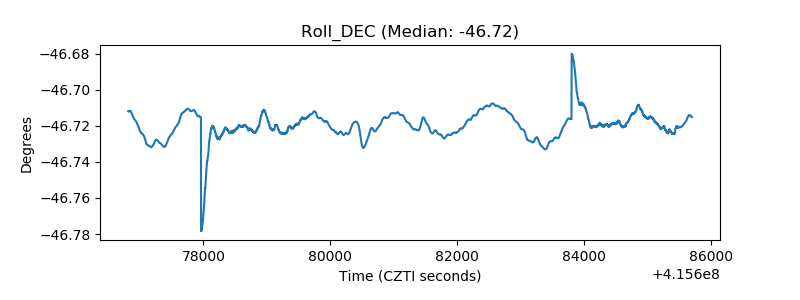 |
| _Roll_RA | 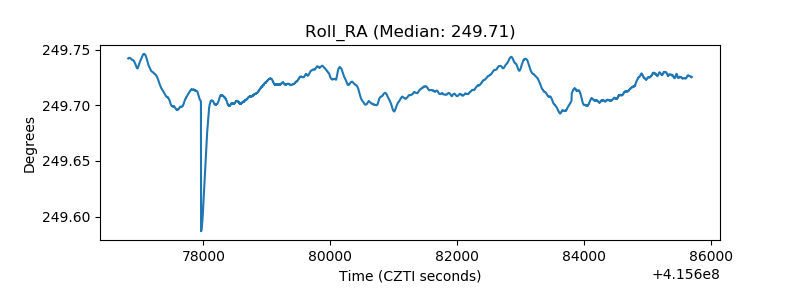 |
| Veto Counter | 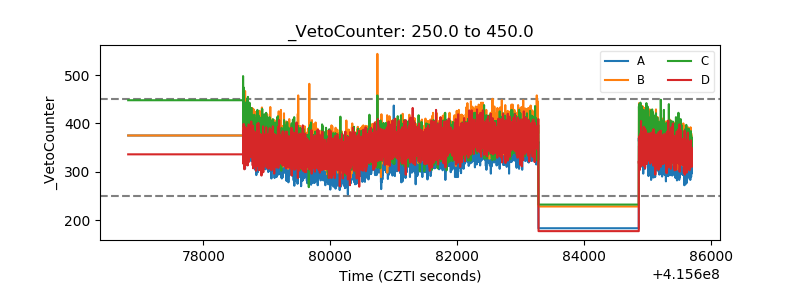 |