| Param | Original file | Final file |
|---|---|---|
| Filename | modeM0/AS1A12_032T04_9000005528_40194cztM0_level2.fits | modeM0/AS1A12_032T04_9000005528_40194cztM0_level2_quad_clean.evt |
| Size (bytes) | 1,299,041,280 | 324,976,320 |
| Size | 1.2 GB | 309.9 MB |
| Events in quadrant A | 11,356,299 | 2,157,294 |
| Events in quadrant B | 9,499,250 | 2,223,583 |
| Events in quadrant C | 12,582,584 | 2,152,938 |
| Events in quadrant D | 13,100,811 | 1,927,532 |
| Mode SS | |||
|---|---|---|---|
| Quadrant | BADHDUFLAG | Total packets | Discarded packets |
| A | 0 | 410 | 0 |
| B | 0 | 410 | 0 |
| C | 0 | 410 | 0 |
| D | 0 | 410 | 0 |
| Mode M0 | |||
|---|---|---|---|
| Quadrant | BADHDUFLAG | Total packets | Discarded packets |
| A | 0 | 45607 | 5 |
| B | 0 | 42032 | 5 |
| C | 0 | 50010 | 5 |
| D | 0 | 53137 | 5 |
| Mode M9 | |||
|---|---|---|---|
| Quadrant | BADHDUFLAG | Total packets | Discarded packets |
| A | 0 | 70 | 0 |
| B | 0 | 70 | 0 |
| C | 0 | 70 | 0 |
| D | 0 | 70 | 0 |
| Quadrant | Total seconds | Saturated seconds | Saturation percentage |
|---|---|---|---|
| A | 20005 | 303 | 1.514621% |
| B | 20005 | 142 | 0.709823% |
| C | 20005 | 210 | 1.049738% |
| D | 20005 | 663 | 3.314171% |
Noise dominated data is calculated using 1-second bins in cleaned event files. If a bin has >2000 counts, and if more than 50% of those come from <1% of pixels, then it is considered to be noise-dominated and hence unusable.
| Quadrant | # 1 sec bins | Bins with >0 counts | Bins with >2000 counts | High rate bins dominated by noise | Noise dominated (total time) | Noise dominated (detector-on time) | Marked lightcurve |
|---|---|---|---|---|---|---|---|
| A | 26988 | 20010 | 200 | 200 | 0.74% | 1.00% | 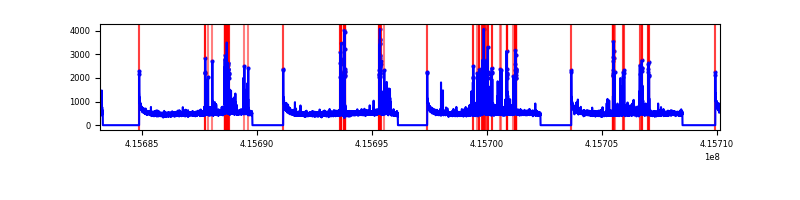 |
| B | 26988 | 20010 | 83 | 83 | 0.31% | 0.41% | 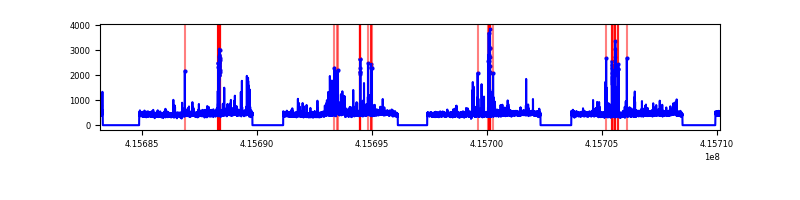 |
| C | 26988 | 20010 | 197 | 197 | 0.73% | 0.98% | 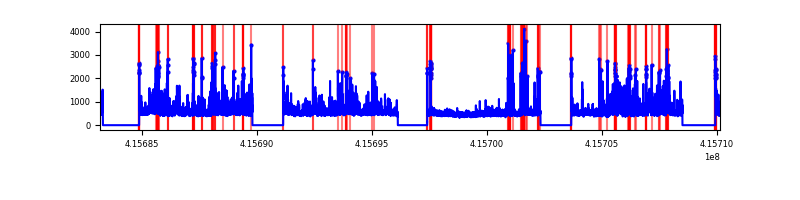 |
| D | 26988 | 20010 | 597 | 597 | 2.21% | 2.98% | 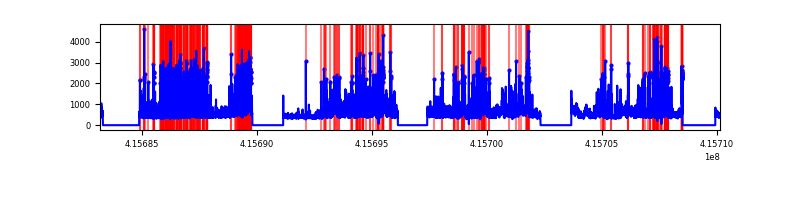 |
Top three noisy pixels from each quadrant. If the there are fewer than three noisy pixels in the level2.evt file, extra rows are filled as -1
| Pixel properties | Quadrant properties | ||||||
|---|---|---|---|---|---|---|---|
| Quadrant | DetID | PixID | Counts | Sigma | Mean | Median | Sigma |
| A | 10 | 83 | 1585160 | 3571.35 | 2194 | 2151 | 443.3 |
| A | 13 | 248 | 1048167 | 2359.86 | 2194 | 2151 | 443.3 |
| A | 2 | 79 | 194002 | 432.83 | 2194 | 2151 | 443.3 |
| B | 5 | 255 | 416387 | 993.37 | 2185 | 2118 | 417.0 |
| B | 0 | 229 | 168856 | 399.82 | 2185 | 2118 | 417.0 |
| B | 0 | 245 | 102978 | 241.85 | 2185 | 2118 | 417.0 |
| C | 4 | 254 | 2671649 | 5380.52 | 2146 | 2163 | 496.1 |
| C | 15 | 214 | 827062 | 1662.64 | 2146 | 2163 | 496.1 |
| C | 14 | 254 | 349330 | 699.74 | 2146 | 2163 | 496.1 |
| D | 12 | 227 | 3093420 | 5953.91 | 2129 | 2075 | 519.2 |
| D | 13 | 249 | 634535 | 1218.11 | 2129 | 2075 | 519.2 |
| D | 2 | 249 | 575928 | 1105.24 | 2129 | 2075 | 519.2 |
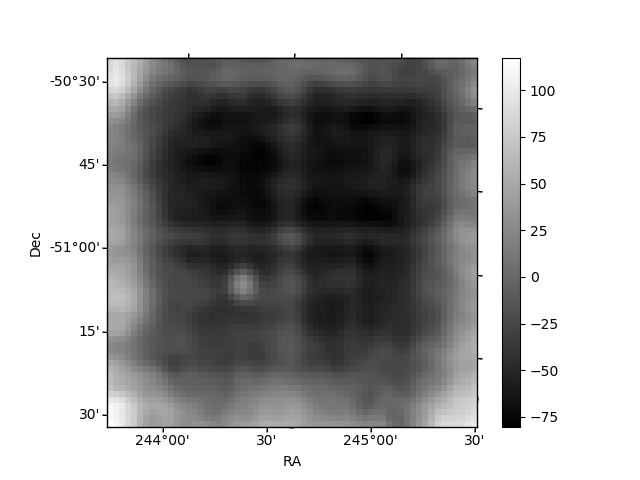
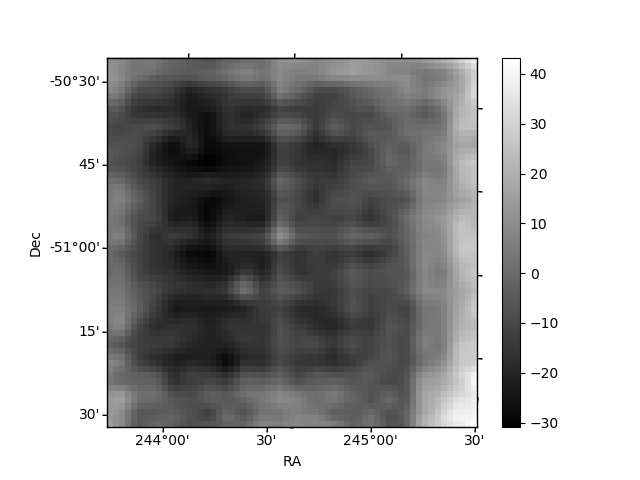
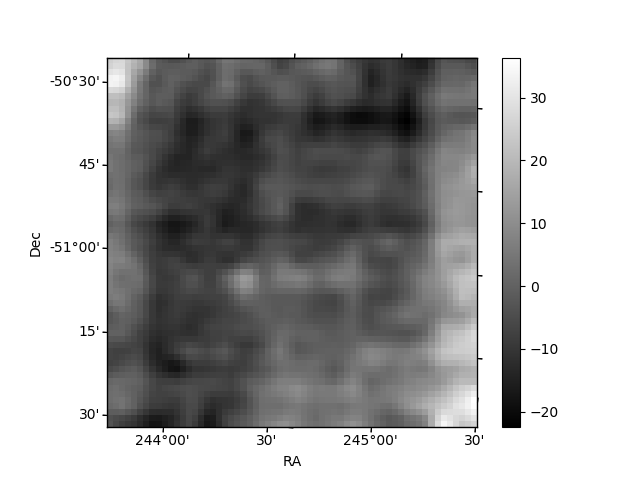
Histogram calculated using DETX and DETY for each event in the final _common_clean file
| Quadrant A | 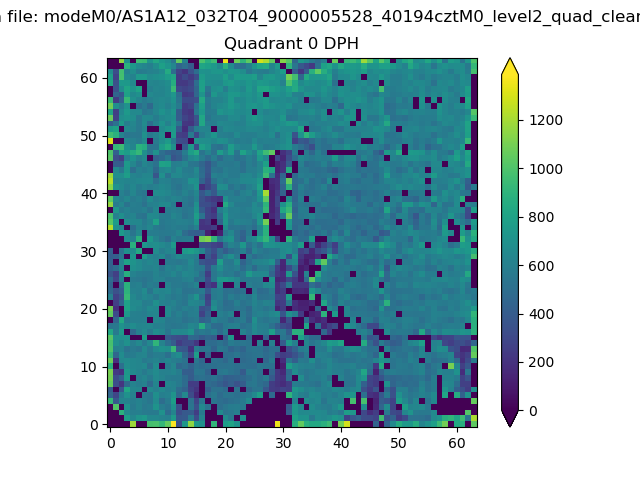 |
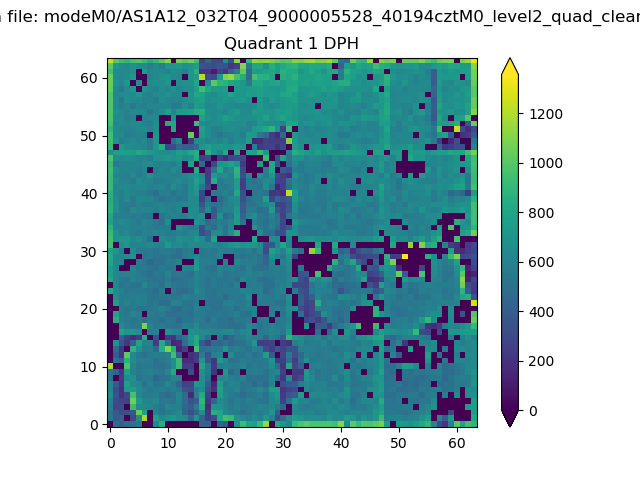 |
Quadrant B |
|---|---|---|---|
| Quadrant D | 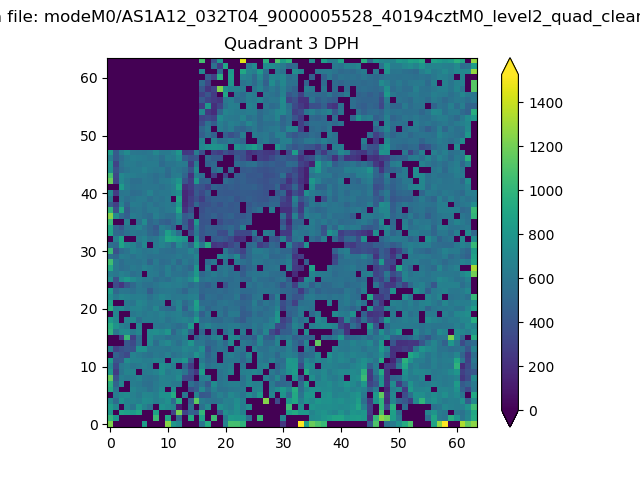 |
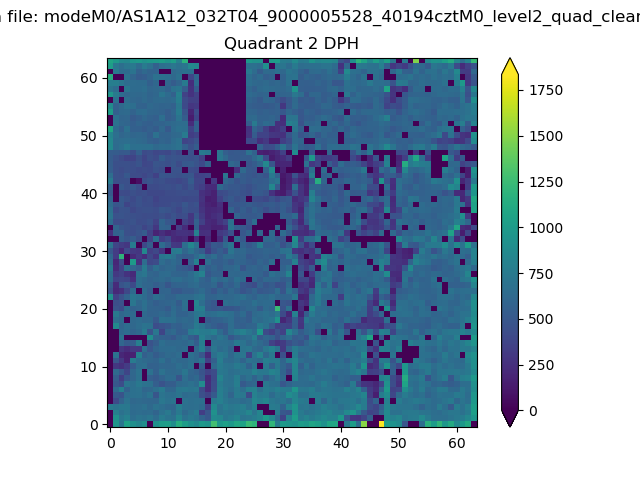 |
Quadrant C |
| Plot type | Count rate plots | Images |
|---|---|---|
| Comparison with Poisson distribution Blue bars denote a histogram of data divided into 1 sec bins. Red curve is a Poisson curve with rate = median count rate of data. |
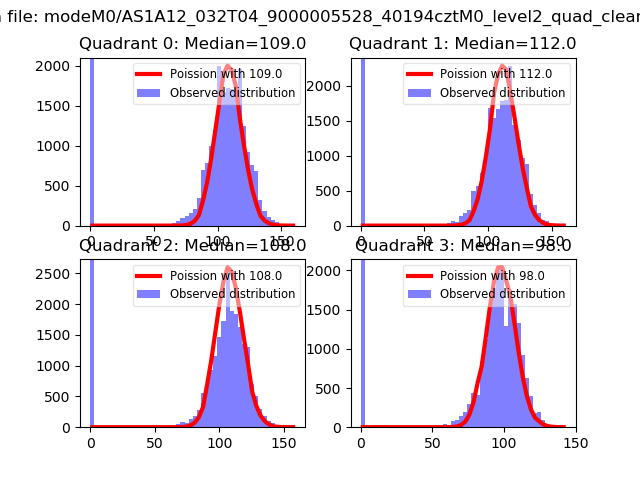 |
 |
| Quadrant-wise count rates Data is divided into 100 sec bins |
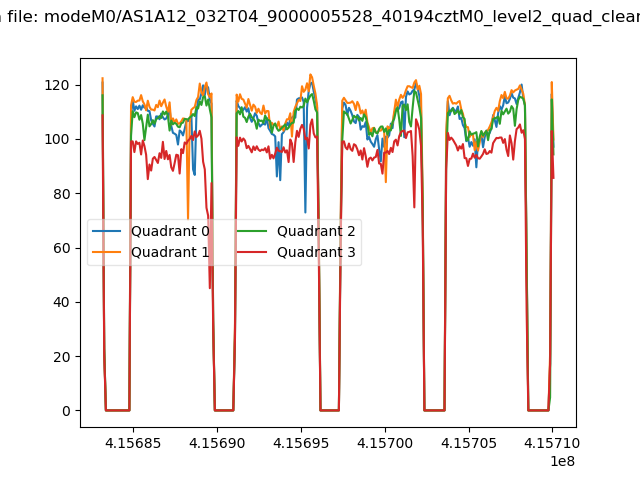 |
|
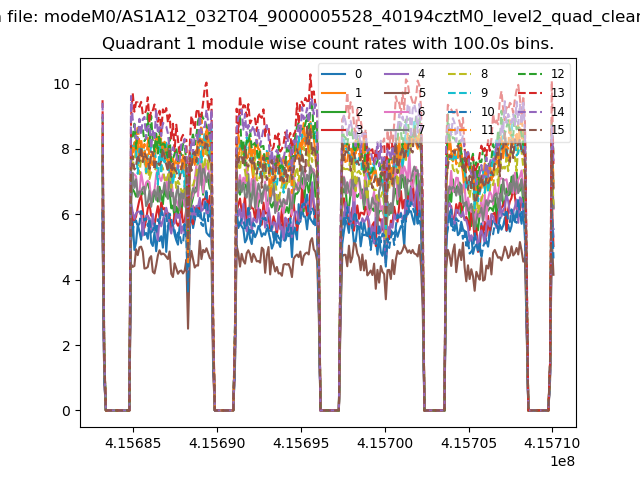
| Module-wise count rates for Quadrant A Data is divided into 100 sec bins |
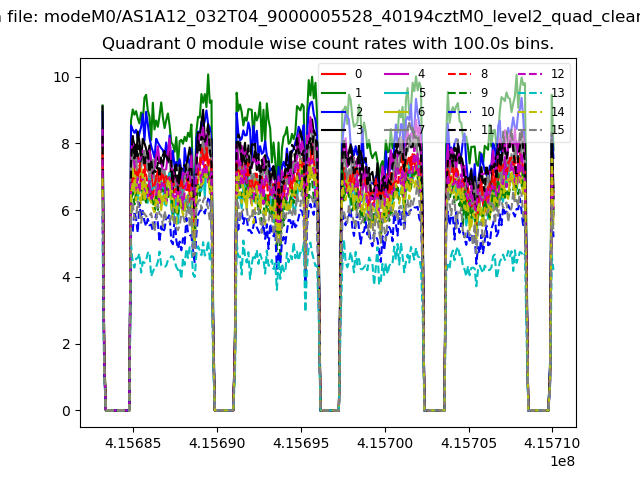 |
 |
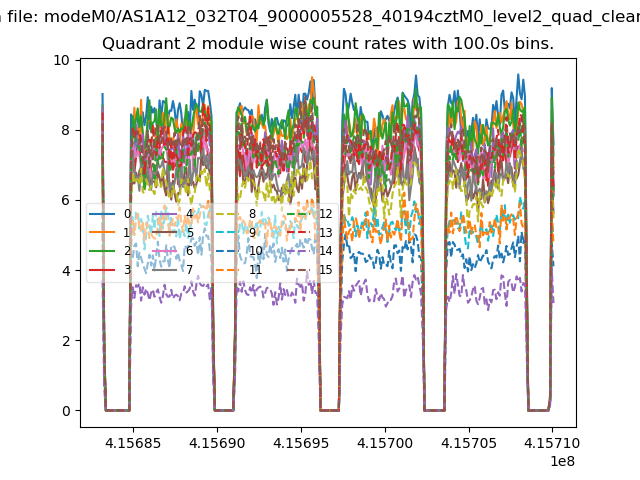
| Module-wise count rates for Quadrant B Data is divided into 100 sec bins |
 |
 |
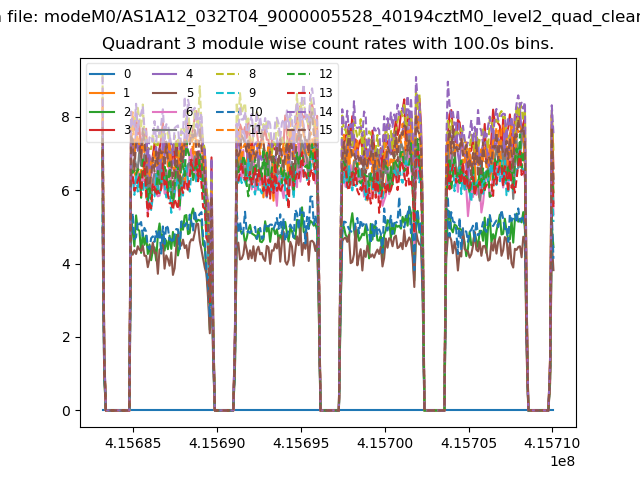
| Module-wise count rates for Quadrant C Data is divided into 100 sec bins |
 |
 |
| Module-wise count rates for Quadrant D Data is divided into 100 sec bins |
 |
 |
| Parameter | Plot |
|---|---|
| CZT HV Monitor | 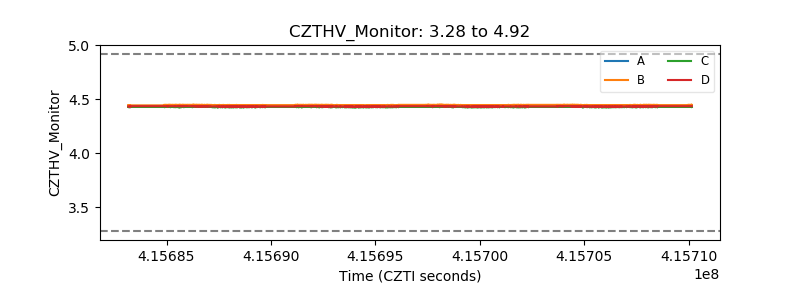 |
| D_VDD | 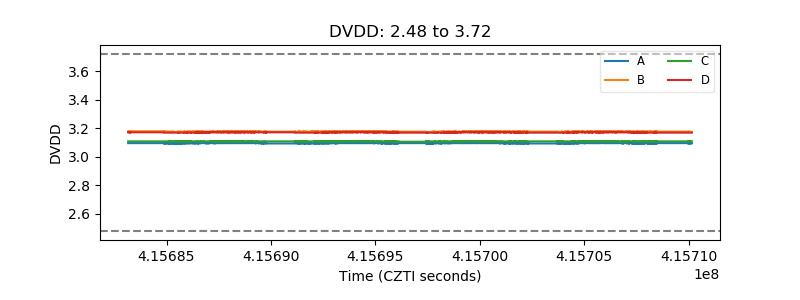 |
| Temperature 1 | 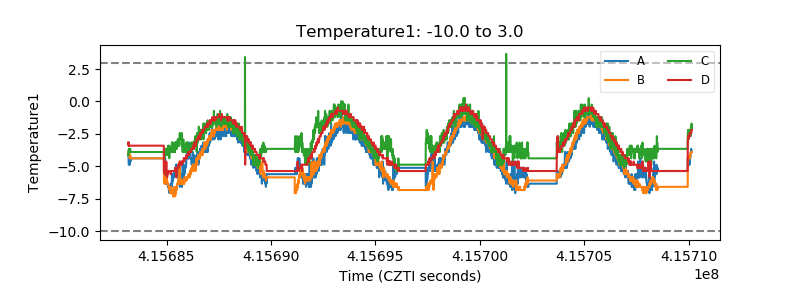 |
| Veto HV Monitor | 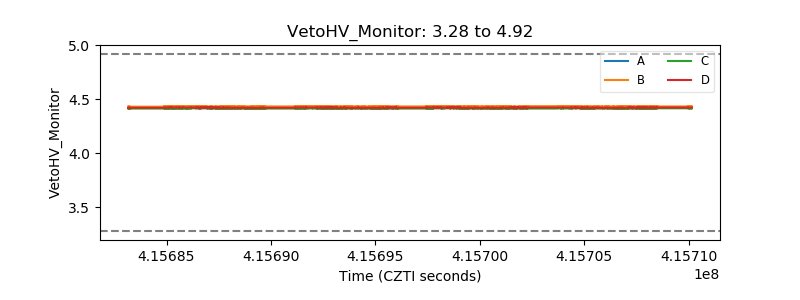 |
| Veto LLD |  |
| Alpha Counter | 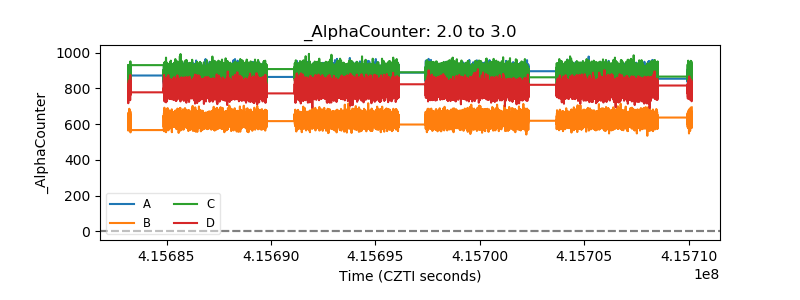 |
| _CPM_Rate | 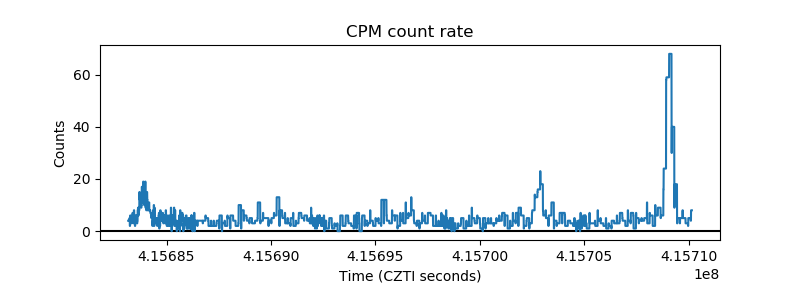 |
| CZT Counter | 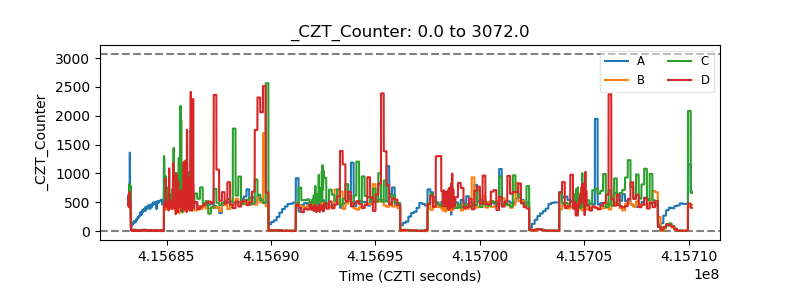 |
| +2.5 Volts monitor | 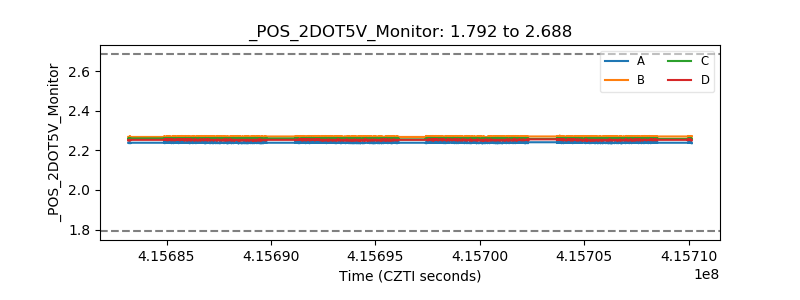 |
| +5 Volts monitor | 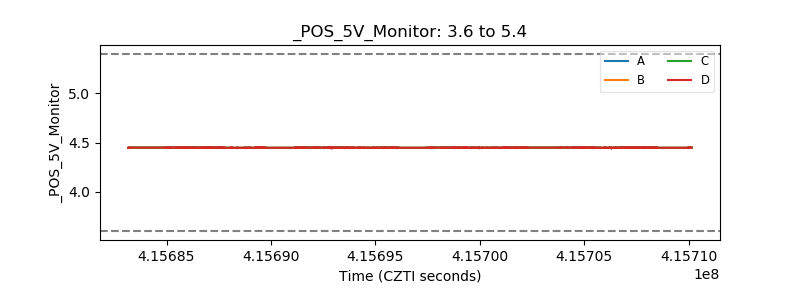 |
| _ROLL_ROT | 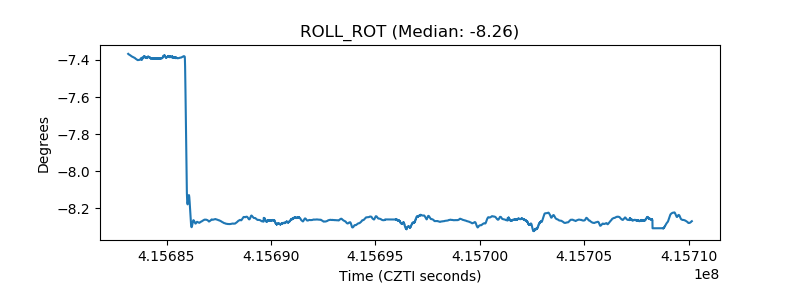 |
| _Roll_DEC | 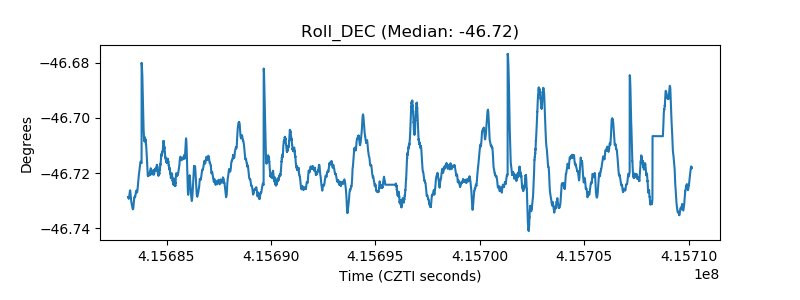 |
| _Roll_RA | 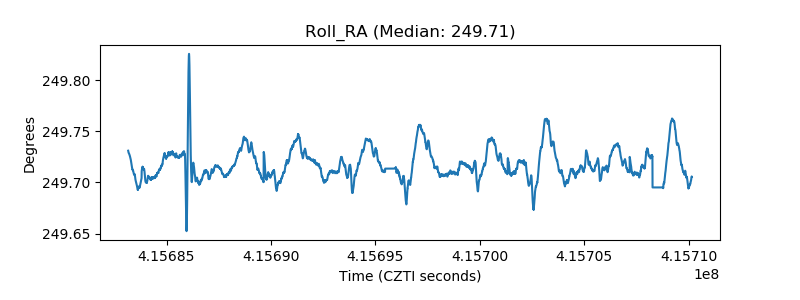 |
| Veto Counter | 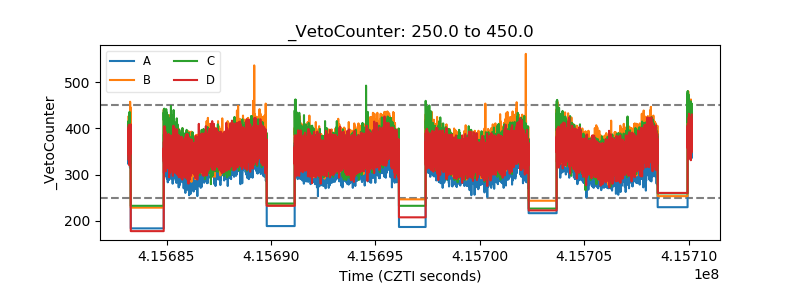 |