| Param | Original file | Final file |
|---|---|---|
| Filename | modeM0/AS1A12_068T01_9000005526_40161cztM0_level2.fits | modeM0/AS1A12_068T01_9000005526_40161cztM0_level2_quad_clean.evt |
| Size (bytes) | 182,862,720 | 20,721,600 |
| Size | 174.4 MB | 19.8 MB |
| Events in quadrant A | 856,516 | 172,080 |
| Events in quadrant B | 696,161 | 180,428 |
| Events in quadrant C | 3,994,288 | 2,715 |
| Events in quadrant D | 1,096,447 | 155,823 |
| Mode SS | |||
|---|---|---|---|
| Quadrant | BADHDUFLAG | Total packets | Discarded packets |
| A | 0 | 34 | 0 |
| B | 0 | 34 | 0 |
| C | 0 | 34 | 0 |
| D | 0 | 34 | 0 |
| Mode M9 | |||
|---|---|---|---|
| Quadrant | BADHDUFLAG | Total packets | Discarded packets |
| A | 0 | 14 | 0 |
| B | 0 | 14 | 0 |
| C | 0 | 14 | 0 |
| D | 0 | 14 | 0 |
| Mode M0 | |||
|---|---|---|---|
| Quadrant | BADHDUFLAG | Total packets | Discarded packets |
| A | 0 | 3471 | 2 |
| B | 0 | 3180 | 1 |
| C | 0 | 12945 | 1 |
| D | 0 | 4364 | 1 |
| Quadrant | Total seconds | Saturated seconds | Saturation percentage |
|---|---|---|---|
| A | 1577 | 6 | 0.380469% |
| B | 1577 | 2 | 0.126823% |
| C | 1577 | 1559 | 98.858592% |
| D | 1577 | 52 | 3.297400% |
Noise dominated data is calculated using 1-second bins in cleaned event files. If a bin has >2000 counts, and if more than 50% of those come from <1% of pixels, then it is considered to be noise-dominated and hence unusable.
| Quadrant | # 1 sec bins | Bins with >0 counts | Bins with >2000 counts | High rate bins dominated by noise | Noise dominated (total time) | Noise dominated (detector-on time) | Marked lightcurve |
|---|---|---|---|---|---|---|---|
| A | 2948 | 1576 | 2 | 2 | 0.07% | 0.13% | 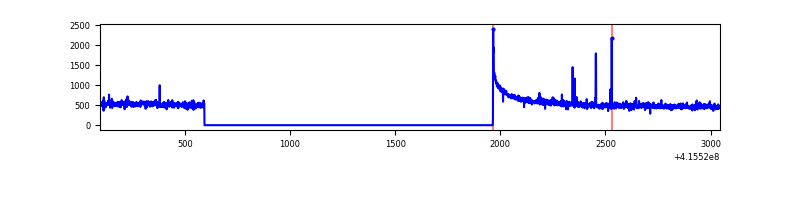 |
| B | 2949 | 1578 | 0 | 0 | 0.00% | 0.00% | 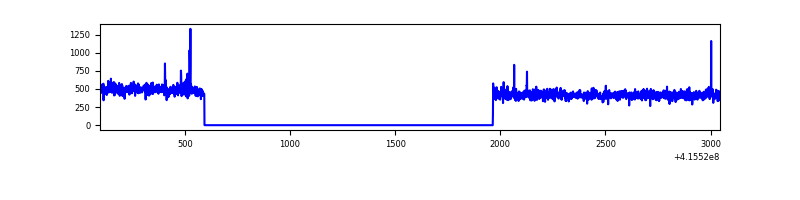 |
| C | 2948 | 1576 | 1536 | 1536 | 52.10% | 97.46% | 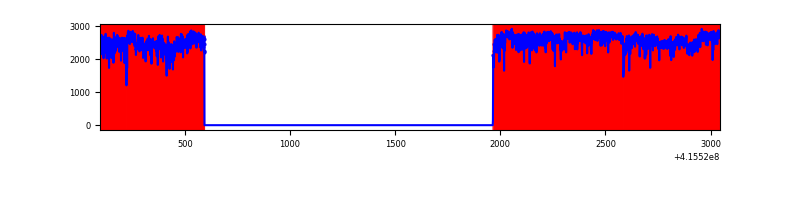 |
| D | 2948 | 1576 | 63 | 63 | 2.14% | 4.00% | 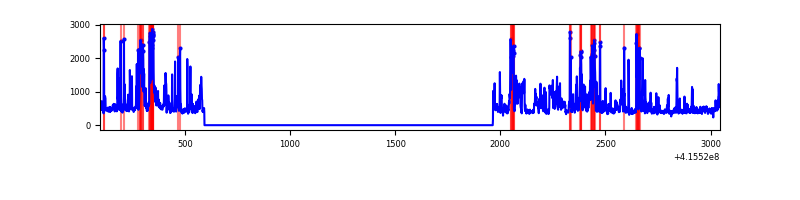 |
Top three noisy pixels from each quadrant. If the there are fewer than three noisy pixels in the level2.evt file, extra rows are filled as -1
| Pixel properties | Quadrant properties | ||||||
|---|---|---|---|---|---|---|---|
| Quadrant | DetID | PixID | Counts | Sigma | Mean | Median | Sigma |
| A | 10 | 83 | 173936 | 4639.16 | 172 | 169 | 37.5 |
| A | 2 | 79 | 13929 | 367.36 | 172 | 169 | 37.5 |
| A | 3 | 137 | 1946 | 47.44 | 172 | 169 | 37.5 |
| B | 5 | 172 | 6475 | 172.31 | 172 | 167 | 36.6 |
| B | 0 | 190 | 6350 | 168.9 | 172 | 167 | 36.6 |
| B | 12 | 111 | 4497 | 118.28 | 172 | 167 | 36.6 |
| C | 9 | 187 | 3675089 | 194347.0 | 71 | 71 | 18.9 |
| C | 15 | 214 | 31020 | 1636.68 | 71 | 71 | 18.9 |
| C | 9 | 203 | 3958 | 205.56 | 71 | 71 | 18.9 |
| D | 13 | 249 | 216753 | 5090.77 | 165 | 159 | 42.5 |
| D | 12 | 0 | 138903 | 3261.0 | 165 | 159 | 42.5 |
| D | 2 | 250 | 45805 | 1072.85 | 165 | 159 | 42.5 |
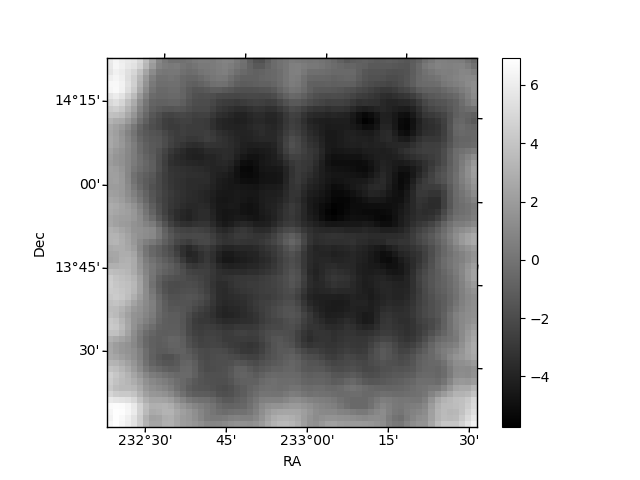
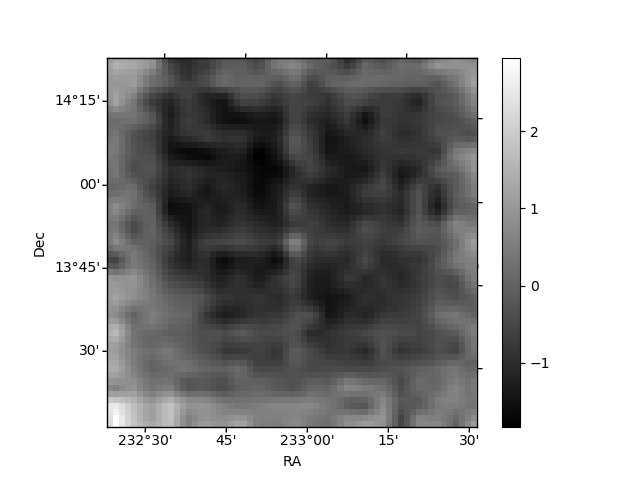
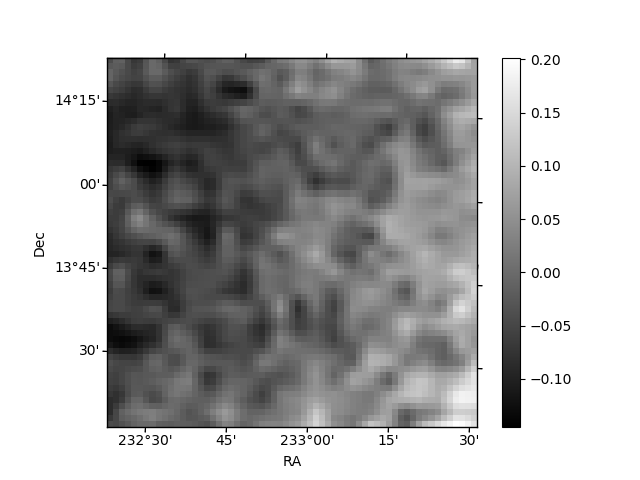
Histogram calculated using DETX and DETY for each event in the final _common_clean file
| Quadrant A | 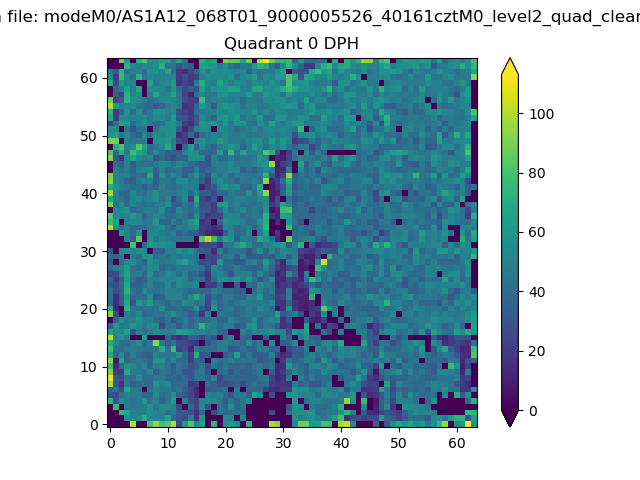 |
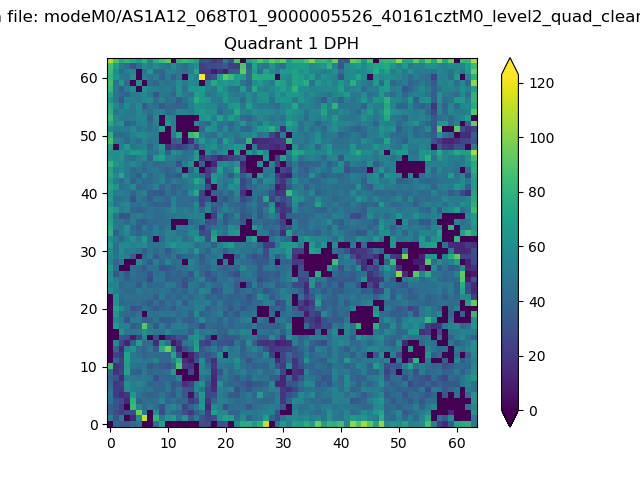 |
Quadrant B |
|---|---|---|---|
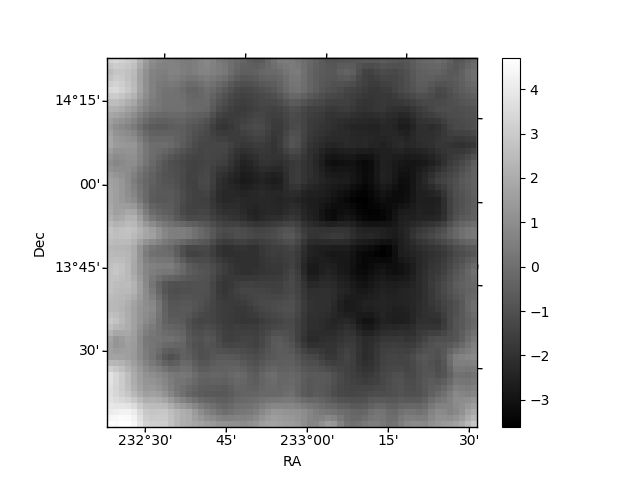
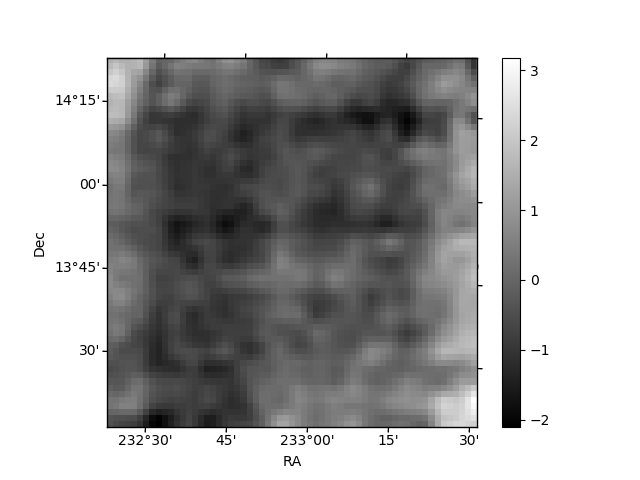
| Quadrant D | 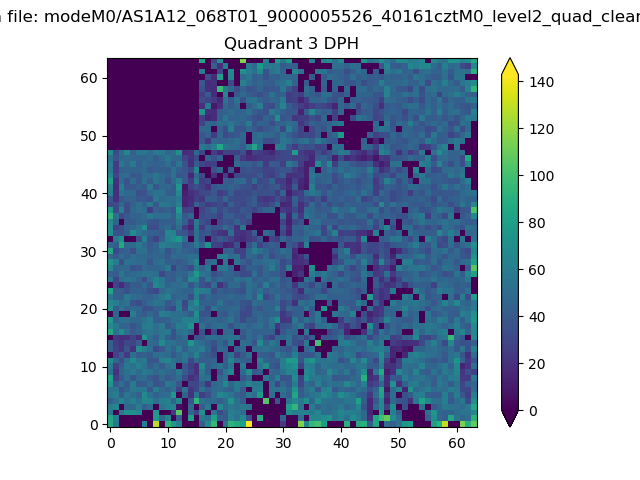 |
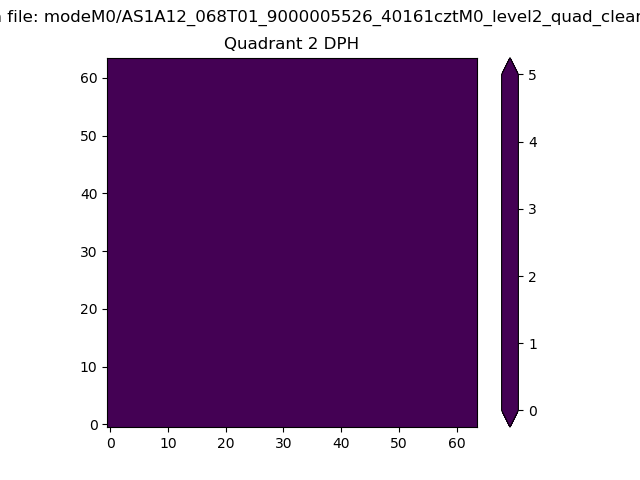 |
Quadrant C |
| Plot type | Count rate plots | Images |
|---|---|---|
| Comparison with Poisson distribution Blue bars denote a histogram of data divided into 1 sec bins. Red curve is a Poisson curve with rate = median count rate of data. |
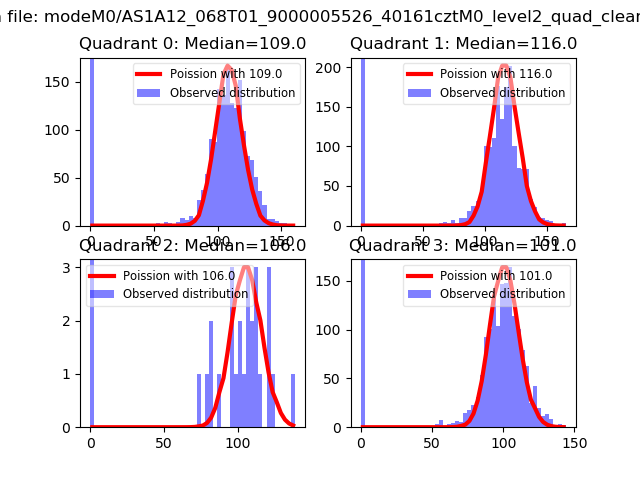 |
 |
| Quadrant-wise count rates Data is divided into 100 sec bins |
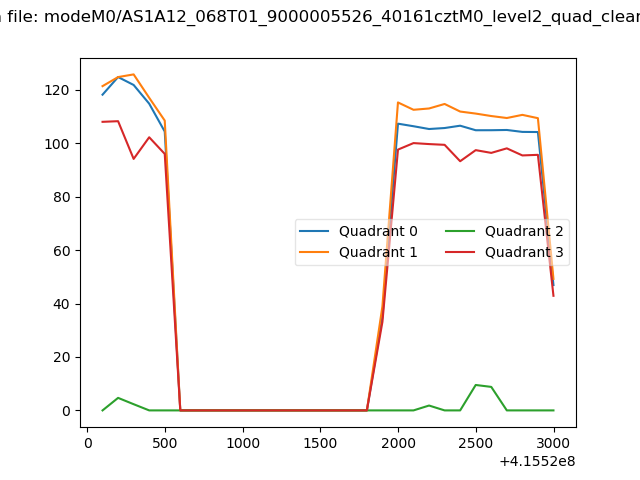 |
|
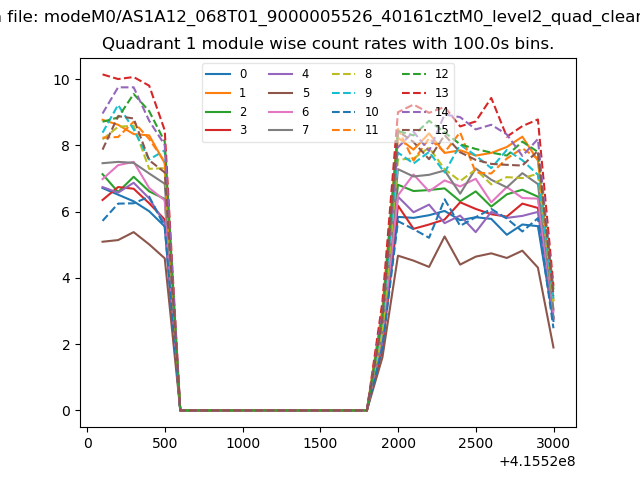
| Module-wise count rates for Quadrant A Data is divided into 100 sec bins |
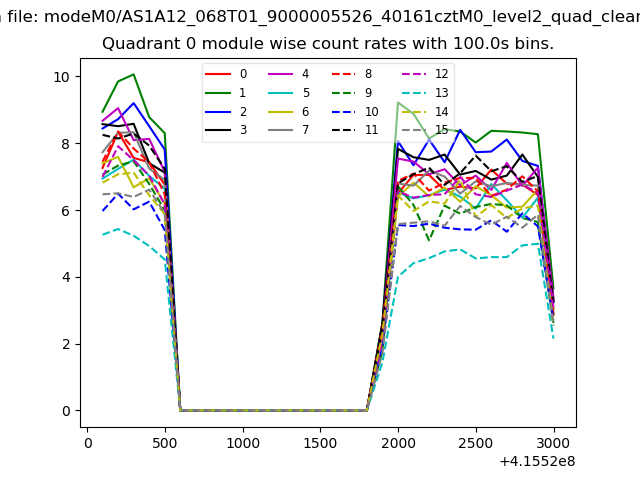 |
 |
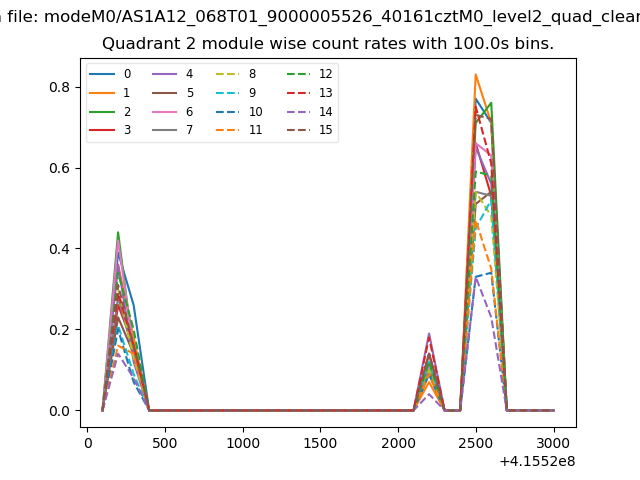
| Module-wise count rates for Quadrant B Data is divided into 100 sec bins |
 |
 |
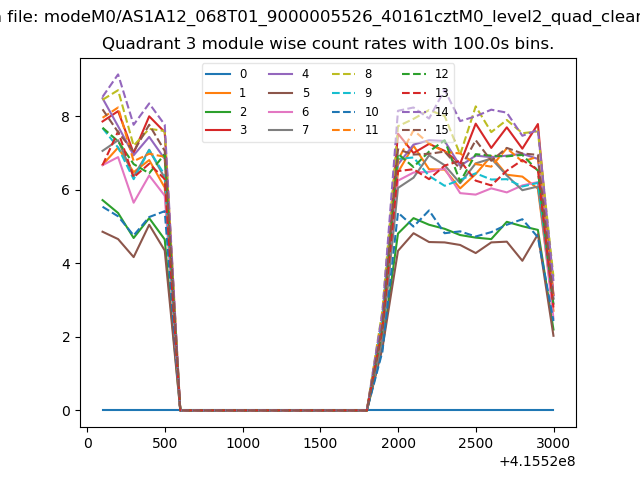
| Module-wise count rates for Quadrant C Data is divided into 100 sec bins |
 |
 |
| Module-wise count rates for Quadrant D Data is divided into 100 sec bins |
 |
 |
| Parameter | Plot |
|---|---|
| CZT HV Monitor | 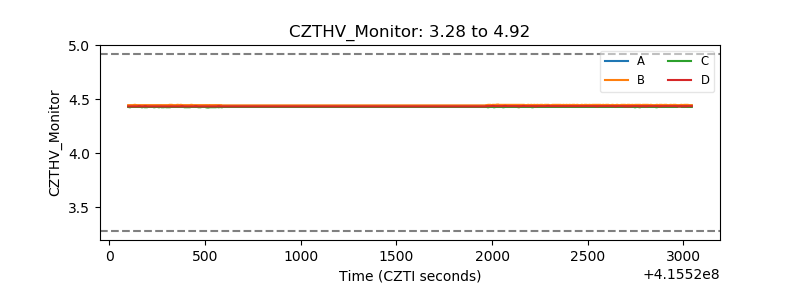 |
| D_VDD | 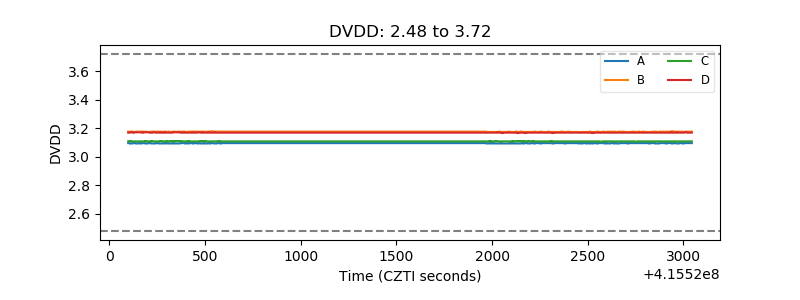 |
| Temperature 1 | 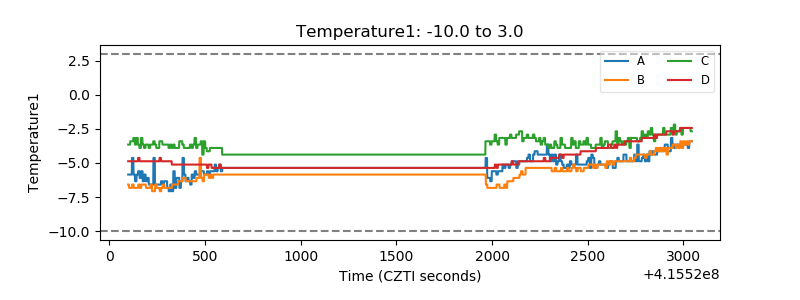 |
| Veto HV Monitor | 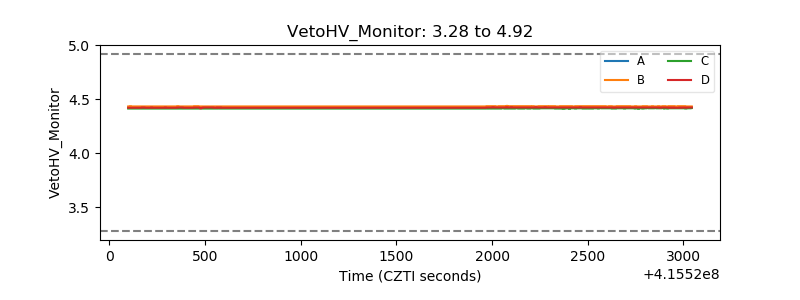 |
| Veto LLD | 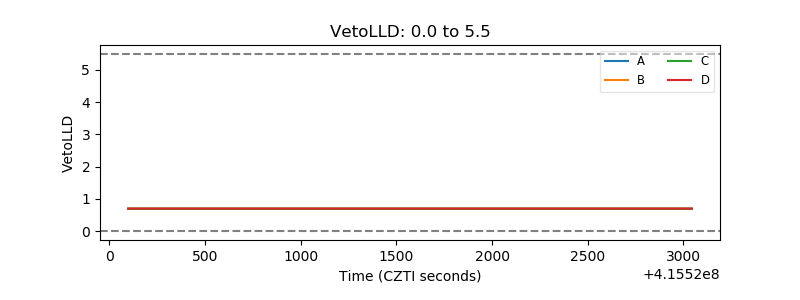 |
| Alpha Counter | 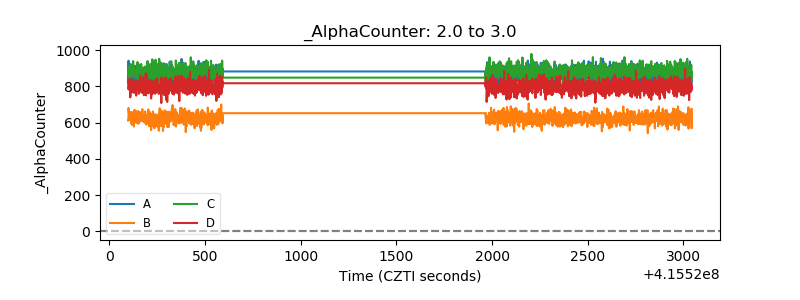 |
| _CPM_Rate | 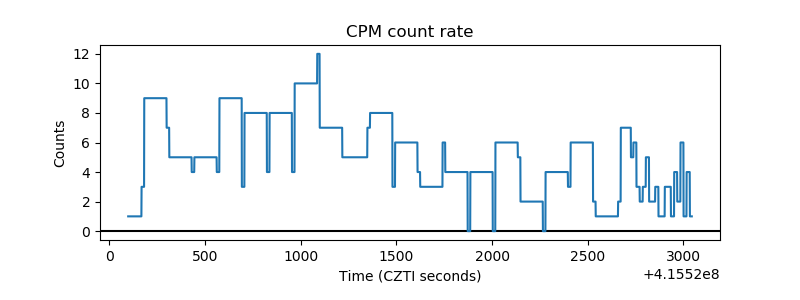 |
| CZT Counter | 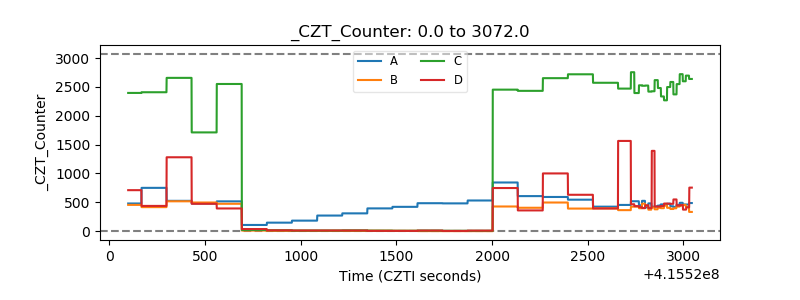 |
| +2.5 Volts monitor | 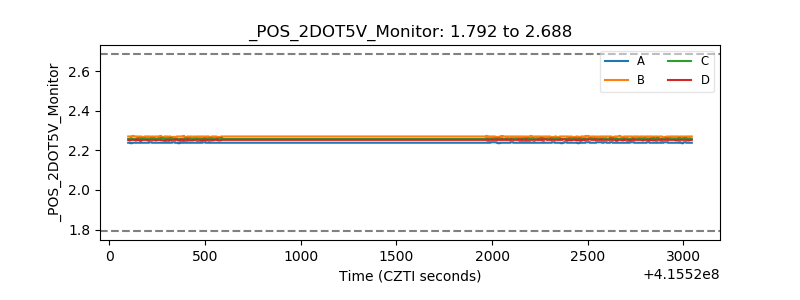 |
| +5 Volts monitor | 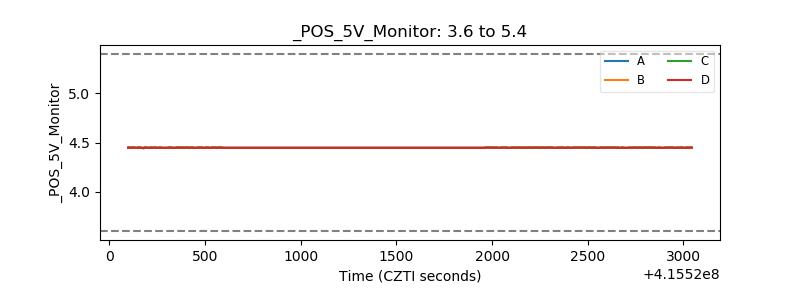 |
| _ROLL_ROT | 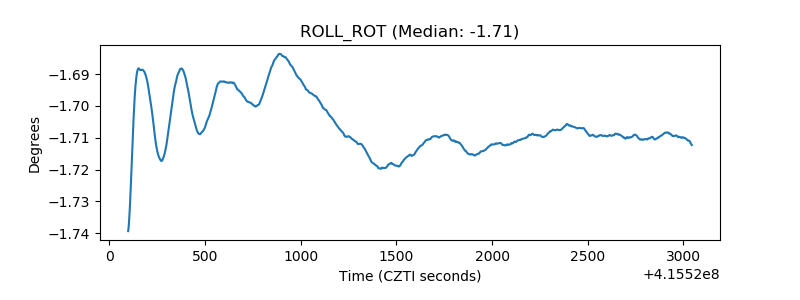 |
| _Roll_DEC | 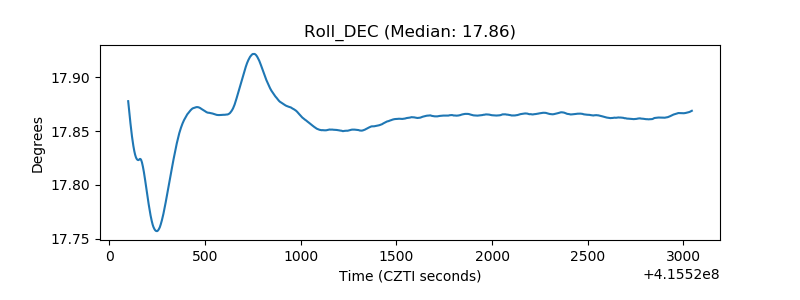 |
| _Roll_RA | 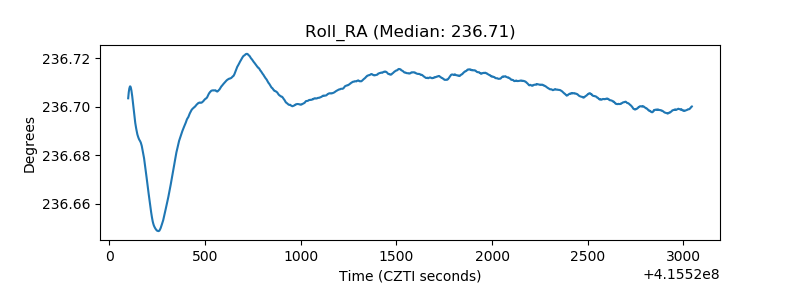 |
| Veto Counter | 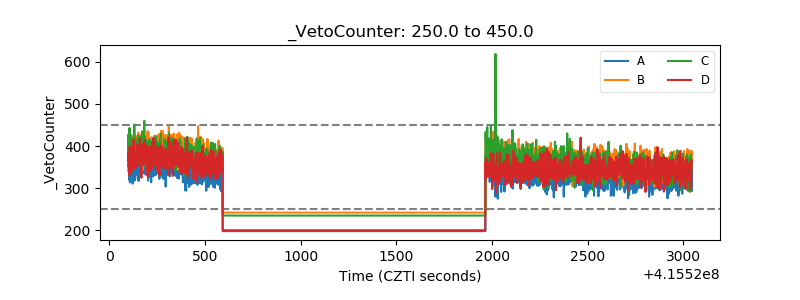 |