| Param | Original file | Final file |
|---|---|---|
| Filename | modeM0/AS1A12_068T01_9000005526_40165cztM0_level2.fits | modeM0/AS1A12_068T01_9000005526_40165cztM0_level2_quad_clean.evt |
| Size (bytes) | 1,341,400,320 | 229,841,280 |
| Size | 1.2 GB | 219.2 MB |
| Events in quadrant A | 9,170,268 | 1,634,269 |
| Events in quadrant B | 7,871,662 | 1,700,668 |
| Events in quadrant C | 21,924,406 | 1,082,272 |
| Events in quadrant D | 9,490,319 | 1,472,836 |
| Mode SS | |||
|---|---|---|---|
| Quadrant | BADHDUFLAG | Total packets | Discarded packets |
| A | 0 | 316 | 0 |
| B | 0 | 316 | 0 |
| C | 0 | 316 | 0 |
| D | 0 | 316 | 0 |
| Mode M9 | |||
|---|---|---|---|
| Quadrant | BADHDUFLAG | Total packets | Discarded packets |
| A | 0 | 46 | 0 |
| B | 0 | 46 | 0 |
| C | 0 | 46 | 0 |
| D | 0 | 47 | 0 |
| Mode M0 | |||
|---|---|---|---|
| Quadrant | BADHDUFLAG | Total packets | Discarded packets |
| A | 0 | 36466 | 5 |
| B | 0 | 33729 | 4 |
| C | 0 | 75291 | 4 |
| D | 0 | 38790 | 4 |
| Quadrant | Total seconds | Saturated seconds | Saturation percentage |
|---|---|---|---|
| A | 15482 | 304 | 1.963571% |
| B | 15482 | 196 | 1.265986% |
| C | 15482 | 5609 | 36.229169% |
| D | 15482 | 527 | 3.403953% |
Noise dominated data is calculated using 1-second bins in cleaned event files. If a bin has >2000 counts, and if more than 50% of those come from <1% of pixels, then it is considered to be noise-dominated and hence unusable.
| Quadrant | # 1 sec bins | Bins with >0 counts | Bins with >2000 counts | High rate bins dominated by noise | Noise dominated (total time) | Noise dominated (detector-on time) | Marked lightcurve |
|---|---|---|---|---|---|---|---|
| A | 19809 | 15483 | 268 | 268 | 1.35% | 1.73% | 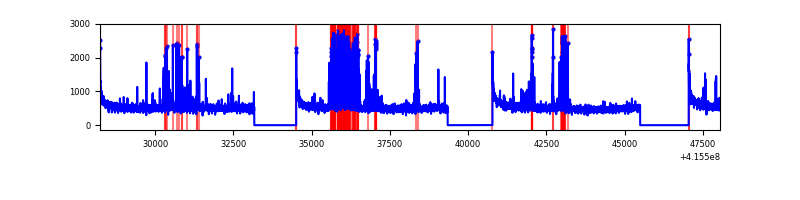 |
| B | 19809 | 15482 | 113 | 113 | 0.57% | 0.73% | 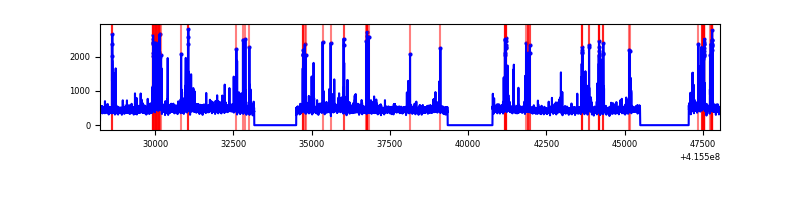 |
| C | 19809 | 15481 | 5655 | 5655 | 28.55% | 36.53% | 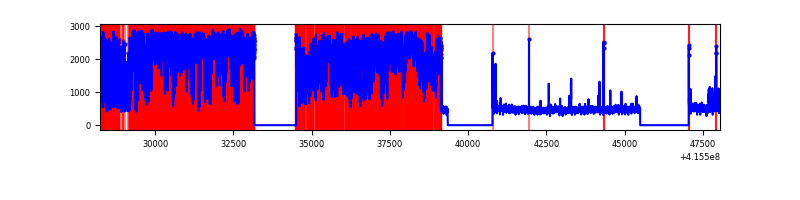 |
| D | 19809 | 15482 | 537 | 537 | 2.71% | 3.47% | 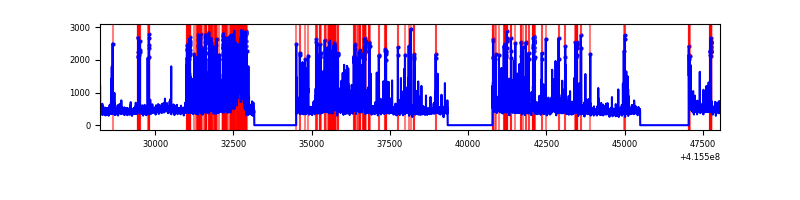 |
Top three noisy pixels from each quadrant. If the there are fewer than three noisy pixels in the level2.evt file, extra rows are filled as -1
| Pixel properties | Quadrant properties | ||||||
|---|---|---|---|---|---|---|---|
| Quadrant | DetID | PixID | Counts | Sigma | Mean | Median | Sigma |
| A | 10 | 83 | 1232359 | 3537.03 | 1711 | 1676 | 347.9 |
| A | 13 | 248 | 1058348 | 3036.91 | 1711 | 1676 | 347.9 |
| A | 2 | 79 | 115669 | 327.62 | 1711 | 1676 | 347.9 |
| B | 5 | 172 | 434947 | 1310.19 | 1714 | 1665 | 330.7 |
| B | 5 | 255 | 321881 | 968.29 | 1714 | 1665 | 330.7 |
| B | 4 | 171 | 121401 | 362.07 | 1714 | 1665 | 330.7 |
| C | 9 | 187 | 15566485 | 46070.04 | 1449 | 1458 | 337.9 |
| C | 15 | 214 | 561231 | 1656.84 | 1449 | 1458 | 337.9 |
| C | 14 | 254 | 64528 | 186.68 | 1449 | 1458 | 337.9 |
| D | 12 | 227 | 1562670 | 3821.05 | 1668 | 1620 | 408.5 |
| D | 13 | 249 | 472667 | 1153.0 | 1668 | 1620 | 408.5 |
| D | 9 | 19 | 342699 | 834.87 | 1668 | 1620 | 408.5 |
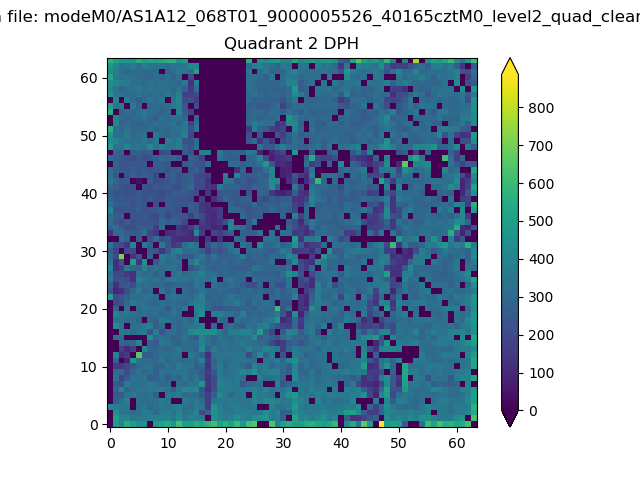
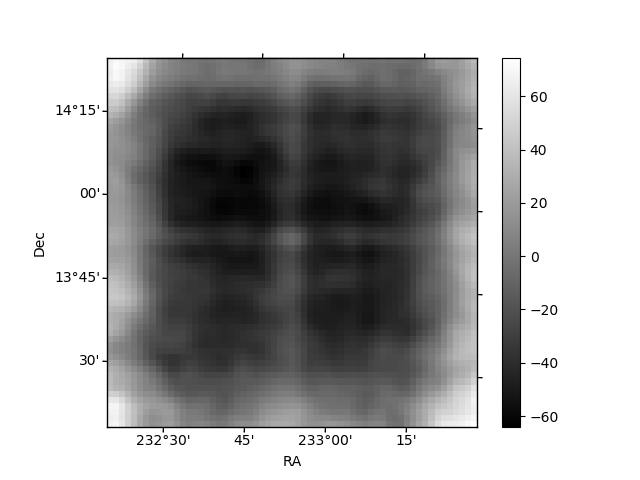
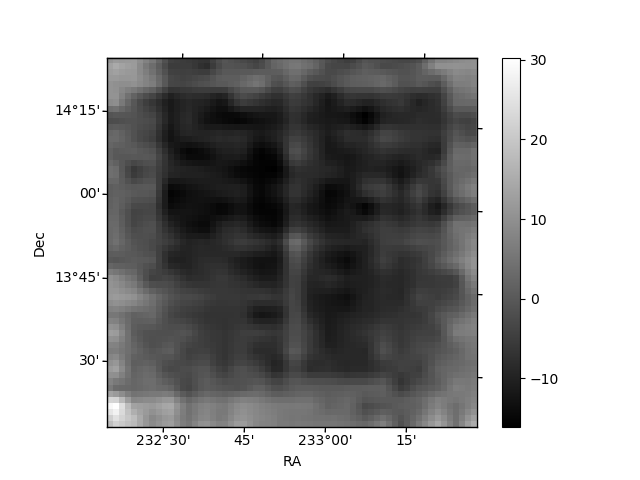
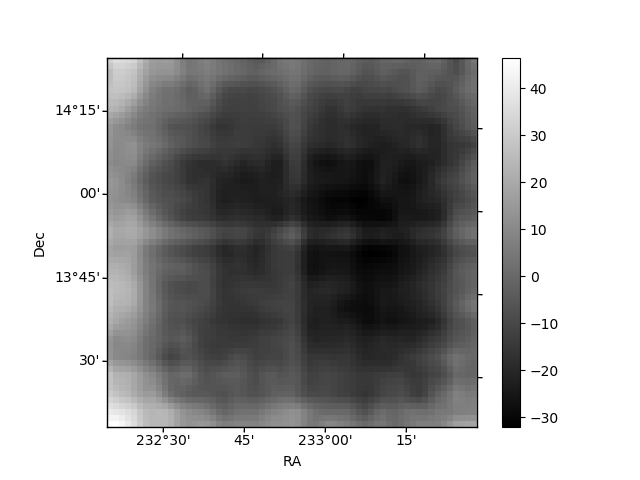
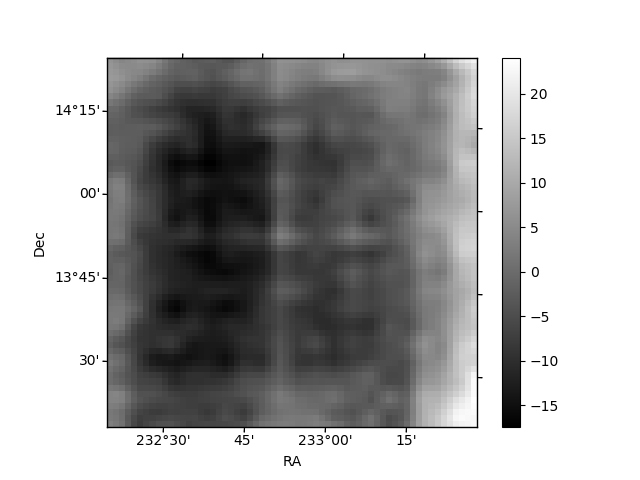
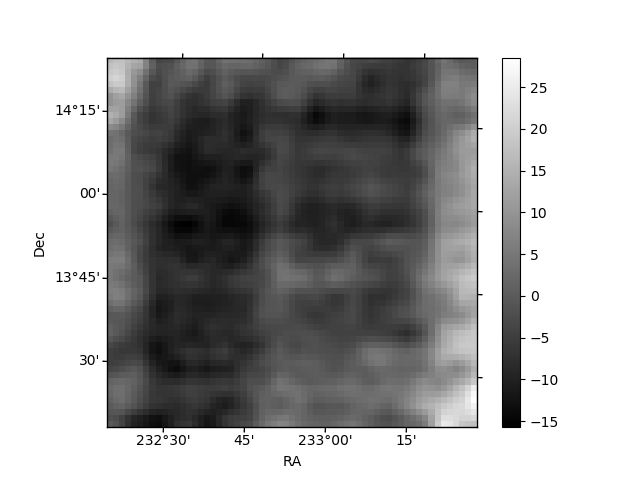
Histogram calculated using DETX and DETY for each event in the final _common_clean file
| Quadrant A | 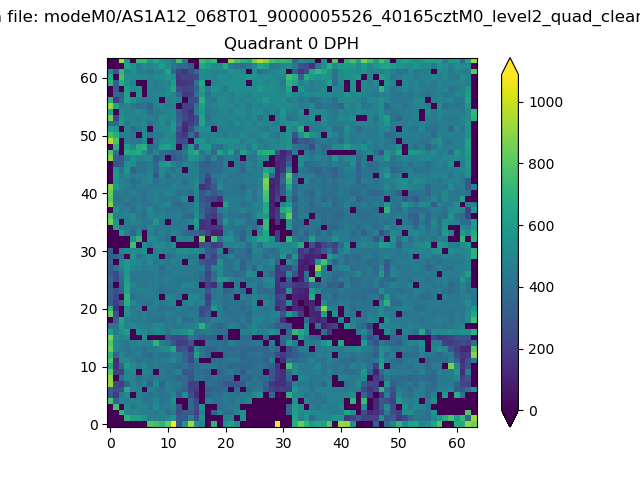 |
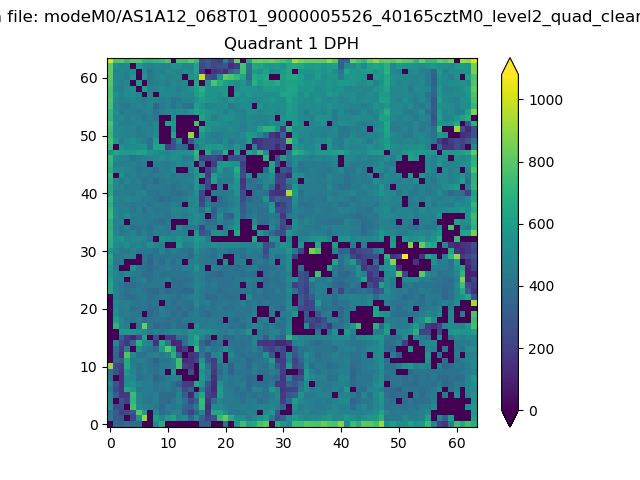 |
Quadrant B |
|---|---|---|---|
| Quadrant D | 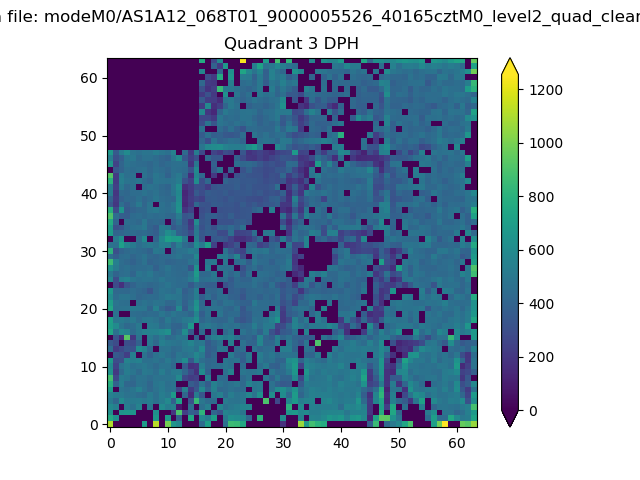 |
 |
Quadrant C |
| Plot type | Count rate plots | Images |
|---|---|---|
| Comparison with Poisson distribution Blue bars denote a histogram of data divided into 1 sec bins. Red curve is a Poisson curve with rate = median count rate of data. |
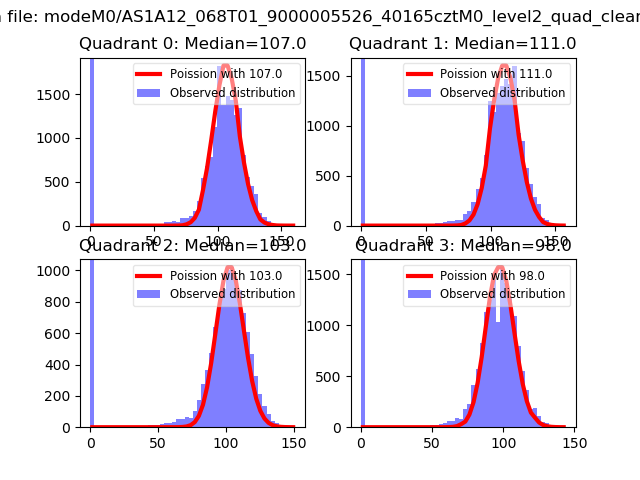 |
 |
| Quadrant-wise count rates Data is divided into 100 sec bins |
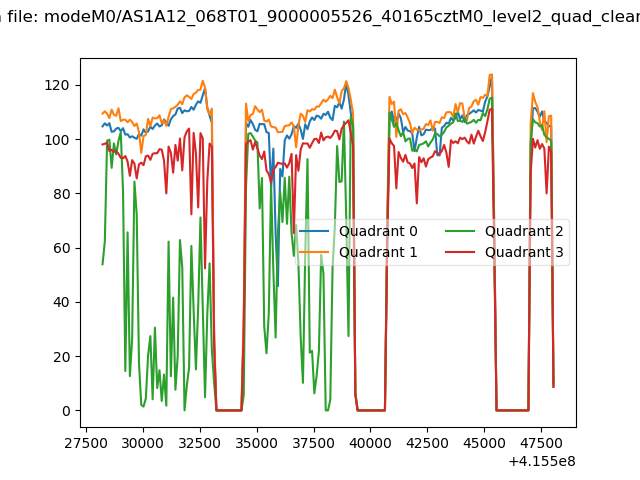 |
|
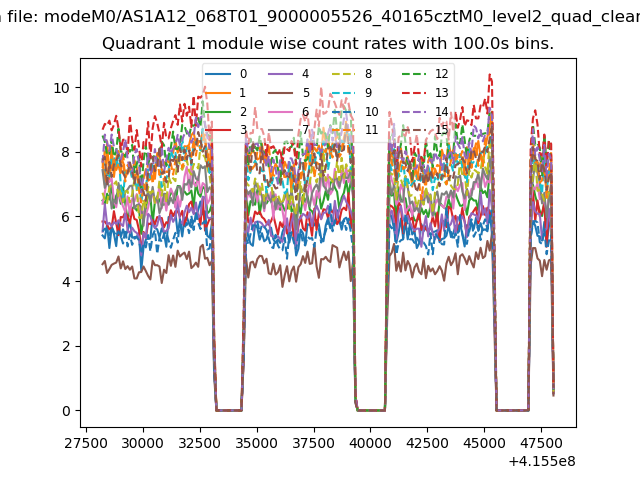
| Module-wise count rates for Quadrant A Data is divided into 100 sec bins |
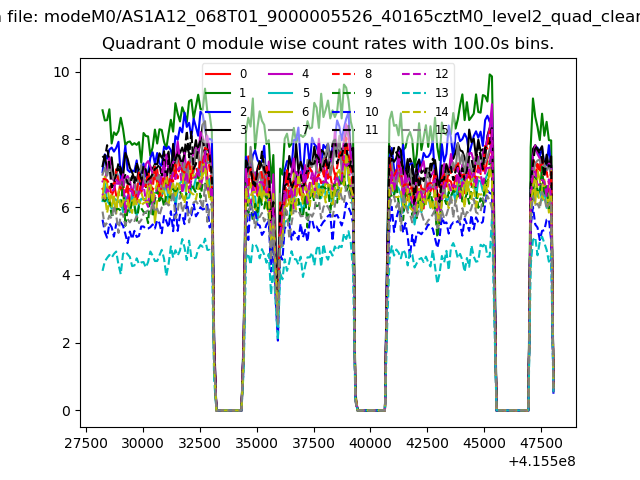 |
 |
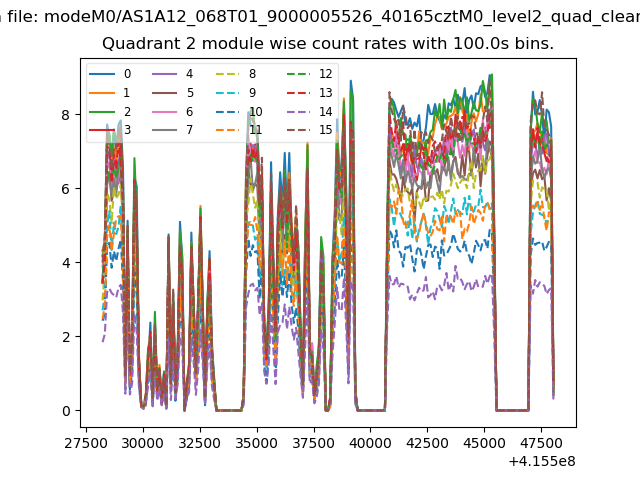
| Module-wise count rates for Quadrant B Data is divided into 100 sec bins |
 |
 |
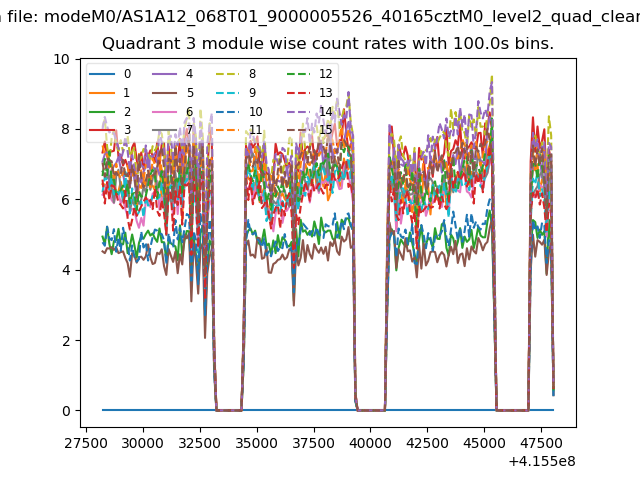
| Module-wise count rates for Quadrant C Data is divided into 100 sec bins |
 |
 |
| Module-wise count rates for Quadrant D Data is divided into 100 sec bins |
 |
 |
| Parameter | Plot |
|---|---|
| CZT HV Monitor | 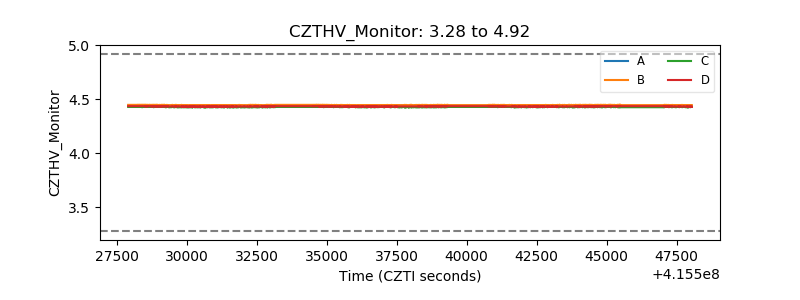 |
| D_VDD | 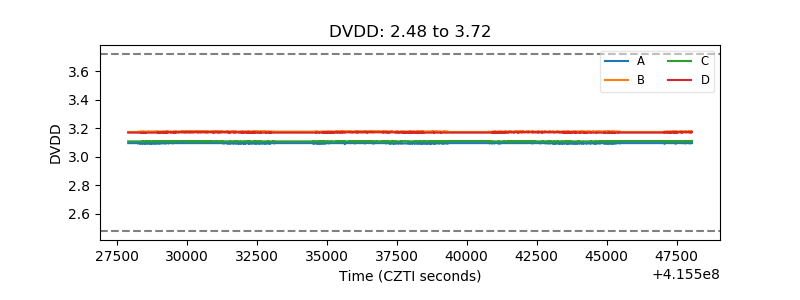 |
| Temperature 1 | 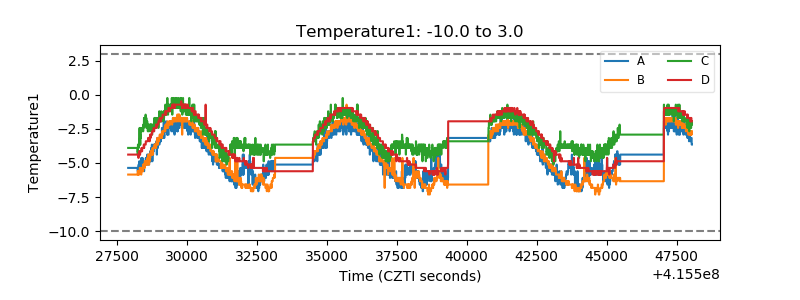 |
| Veto HV Monitor | 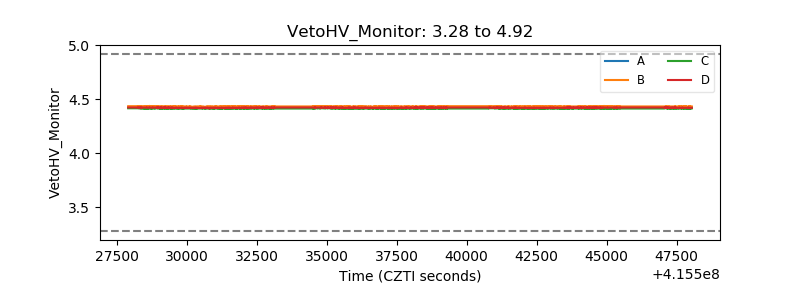 |
| Veto LLD | 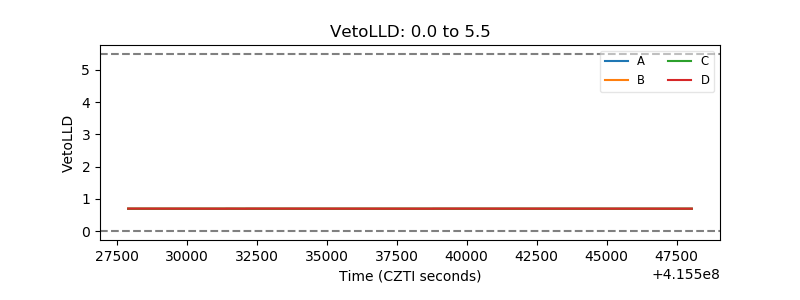 |
| Alpha Counter | 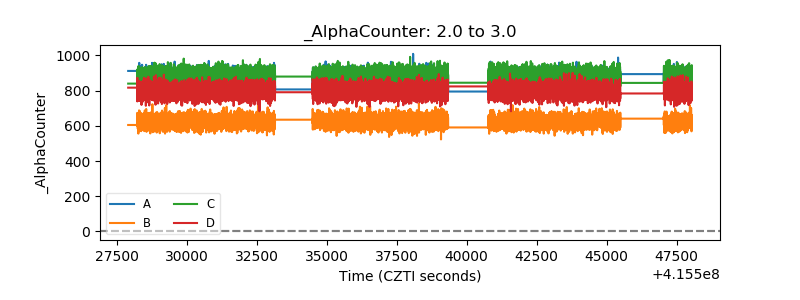 |
| _CPM_Rate | 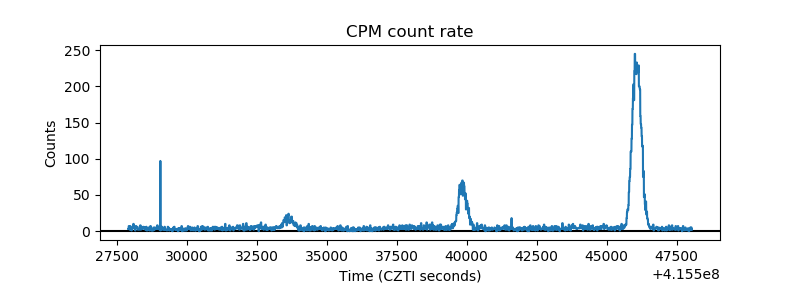 |
| CZT Counter | 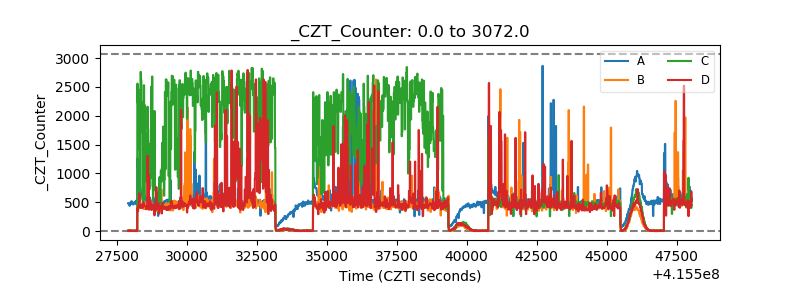 |
| +2.5 Volts monitor | 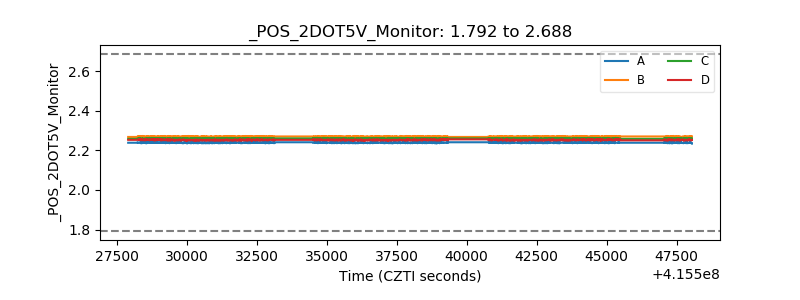 |
| +5 Volts monitor | 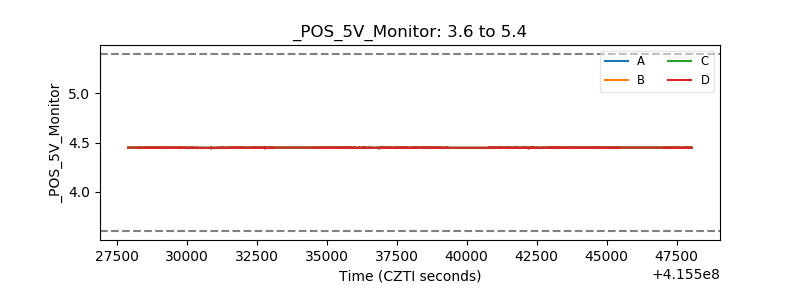 |
| _ROLL_ROT | 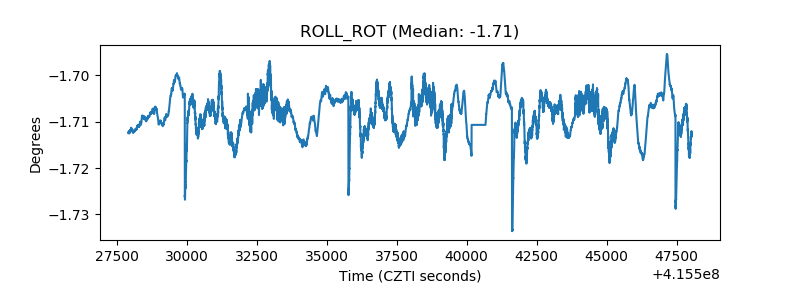 |
| _Roll_DEC | 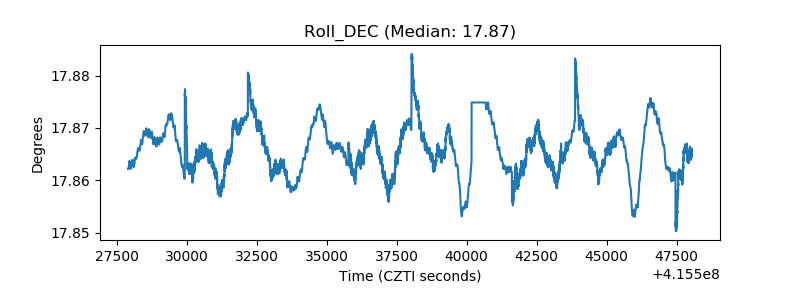 |
| _Roll_RA | 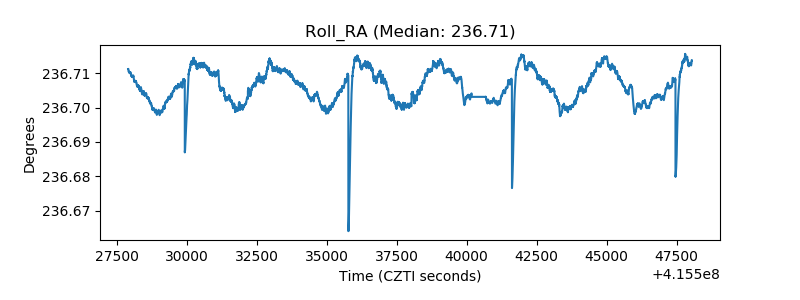 |
| Veto Counter | 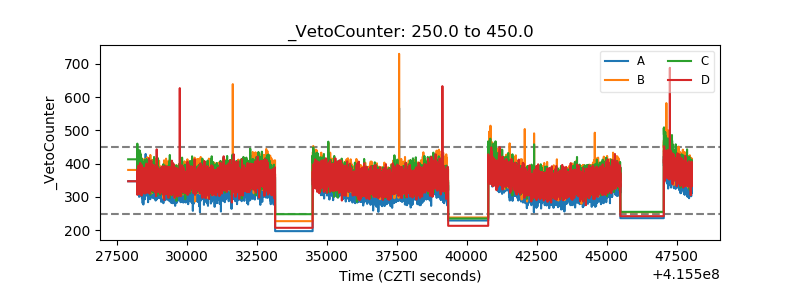 |