| Param | Original file | Final file |
|---|---|---|
| Filename | modeM0/AS1A12_068T01_9000005526_40166cztM0_level2.fits | modeM0/AS1A12_068T01_9000005526_40166cztM0_level2_quad_clean.evt |
| Size (bytes) | 1,175,063,040 | 192,245,760 |
| Size | 1.1 GB | 183.3 MB |
| Events in quadrant A | 7,610,341 | 1,406,483 |
| Events in quadrant B | 7,176,387 | 1,444,151 |
| Events in quadrant C | 20,477,065 | 779,805 |
| Events in quadrant D | 7,219,017 | 1,284,743 |
| Mode SS | |||
|---|---|---|---|
| Quadrant | BADHDUFLAG | Total packets | Discarded packets |
| A | 0 | 270 | 0 |
| B | 0 | 270 | 0 |
| C | 0 | 270 | 0 |
| D | 0 | 270 | 0 |
| Mode M9 | |||
|---|---|---|---|
| Quadrant | BADHDUFLAG | Total packets | Discarded packets |
| A | 0 | 48 | 0 |
| B | 0 | 48 | 0 |
| C | 0 | 48 | 0 |
| D | 0 | 48 | 0 |
| Mode M0 | |||
|---|---|---|---|
| Quadrant | BADHDUFLAG | Total packets | Discarded packets |
| A | 0 | 30543 | 6 |
| B | 0 | 30180 | 4 |
| C | 0 | 69448 | 4 |
| D | 0 | 30395 | 4 |
| Quadrant | Total seconds | Saturated seconds | Saturation percentage |
|---|---|---|---|
| A | 13094 | 224 | 1.710707% |
| B | 13094 | 369 | 2.818085% |
| C | 13094 | 6132 | 46.830609% |
| D | 13094 | 201 | 1.535054% |
Noise dominated data is calculated using 1-second bins in cleaned event files. If a bin has >2000 counts, and if more than 50% of those come from <1% of pixels, then it is considered to be noise-dominated and hence unusable.
| Quadrant | # 1 sec bins | Bins with >0 counts | Bins with >2000 counts | High rate bins dominated by noise | Noise dominated (total time) | Noise dominated (detector-on time) | Marked lightcurve |
|---|---|---|---|---|---|---|---|
| A | 34046 | 13095 | 179 | 179 | 0.53% | 1.37% | 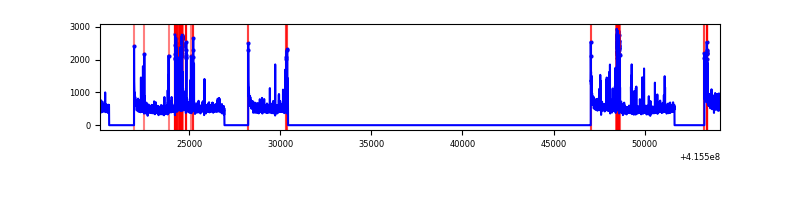 |
| B | 34046 | 13095 | 244 | 244 | 0.72% | 1.86% | 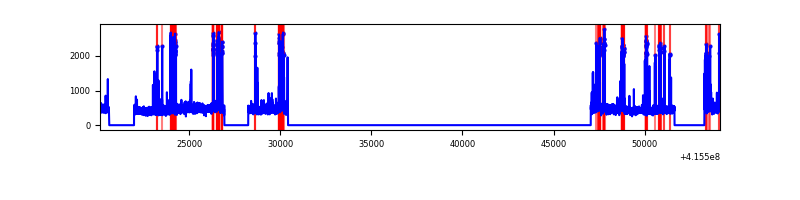 |
| C | 34046 | 13093 | 6105 | 6105 | 17.93% | 46.63% | 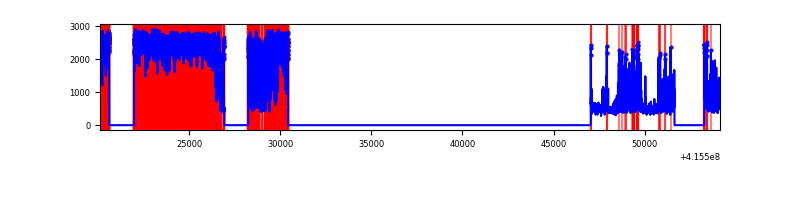 |
| D | 34046 | 13093 | 193 | 193 | 0.57% | 1.47% | 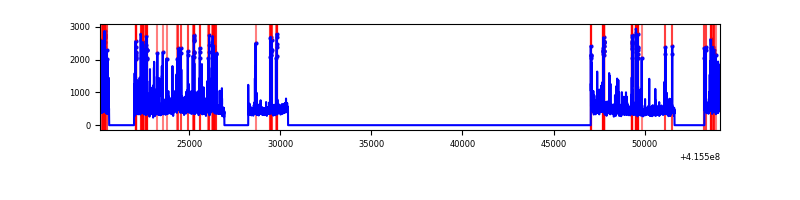 |
Top three noisy pixels from each quadrant. If the there are fewer than three noisy pixels in the level2.evt file, extra rows are filled as -1
| Pixel properties | Quadrant properties | ||||||
|---|---|---|---|---|---|---|---|
| Quadrant | DetID | PixID | Counts | Sigma | Mean | Median | Sigma |
| A | 10 | 83 | 1104803 | 3727.87 | 1450 | 1418 | 296.0 |
| A | 13 | 248 | 612723 | 2065.34 | 1450 | 1418 | 296.0 |
| A | 7 | 3 | 104849 | 349.45 | 1450 | 1418 | 296.0 |
| B | 5 | 255 | 530603 | 1885.29 | 1443 | 1402 | 280.7 |
| B | 5 | 172 | 523404 | 1859.64 | 1443 | 1402 | 280.7 |
| B | 4 | 171 | 231916 | 821.21 | 1443 | 1402 | 280.7 |
| C | 9 | 187 | 15735959 | 63150.99 | 1072 | 1080 | 249.2 |
| C | 15 | 214 | 416216 | 1666.12 | 1072 | 1080 | 249.2 |
| C | 10 | 20 | 41171 | 160.9 | 1072 | 1080 | 249.2 |
| D | 13 | 249 | 501352 | 1427.1 | 1425 | 1385 | 350.3 |
| D | 9 | 19 | 287273 | 816.04 | 1425 | 1385 | 350.3 |
| D | 12 | 233 | 191530 | 542.75 | 1425 | 1385 | 350.3 |
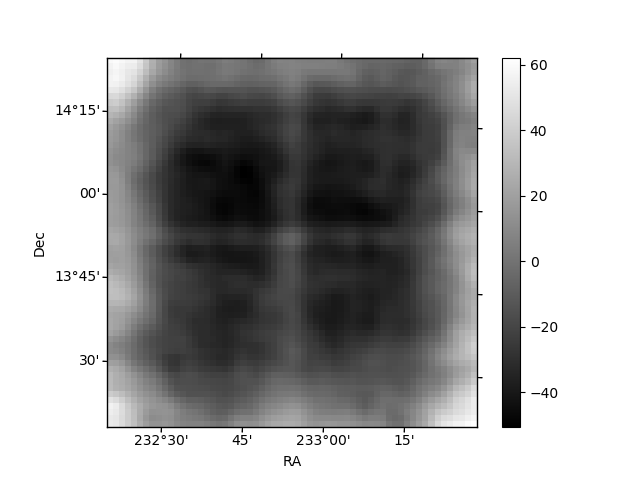
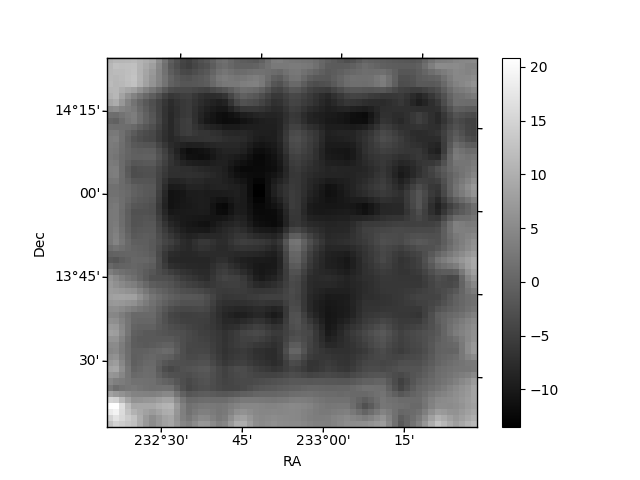
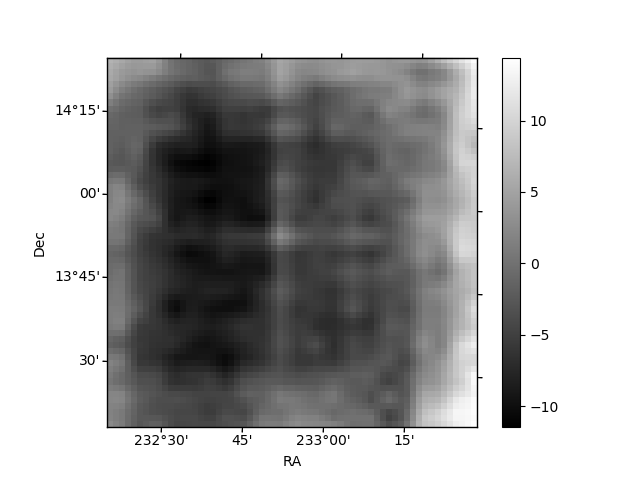
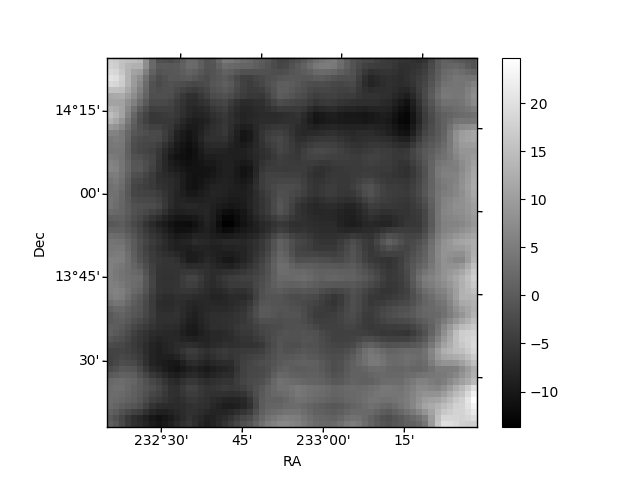
Histogram calculated using DETX and DETY for each event in the final _common_clean file
| Quadrant A | 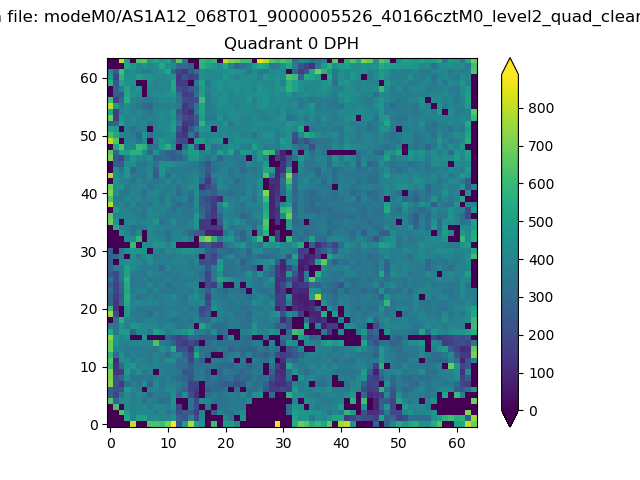 |
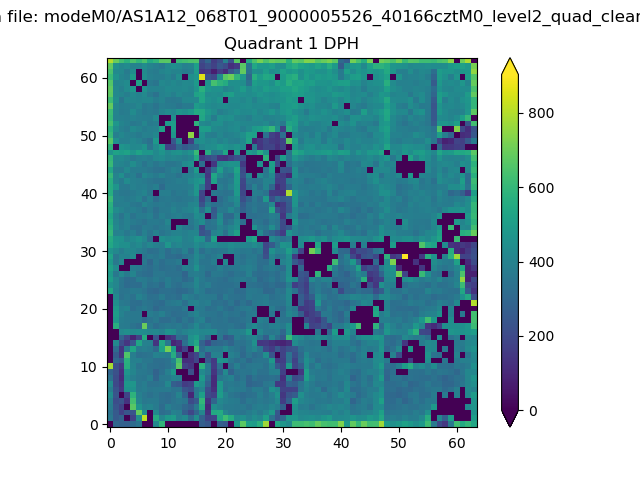 |
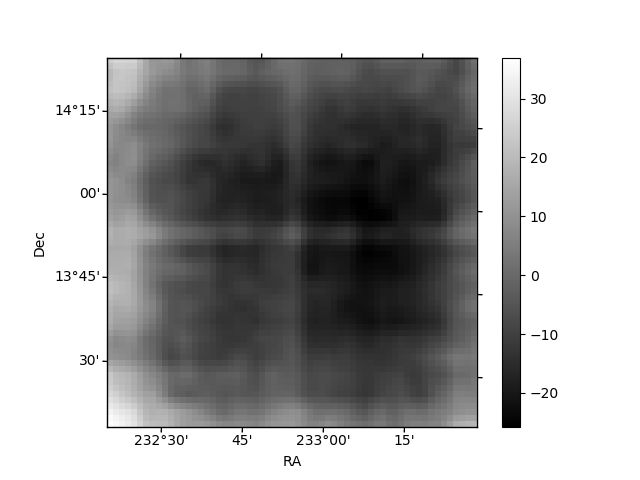
Quadrant B |
|---|---|---|---|
| Quadrant D | 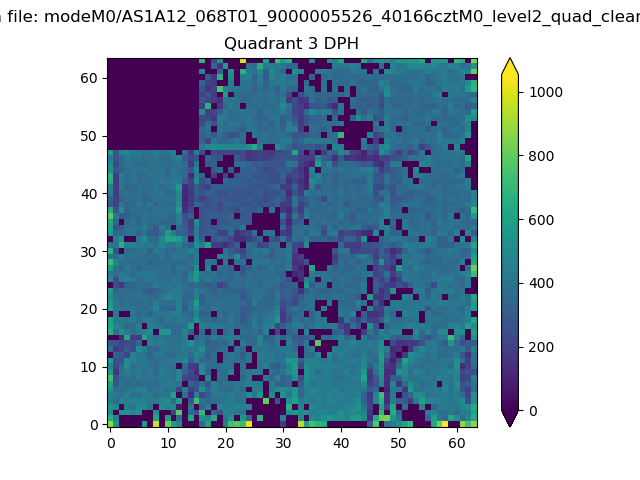 |
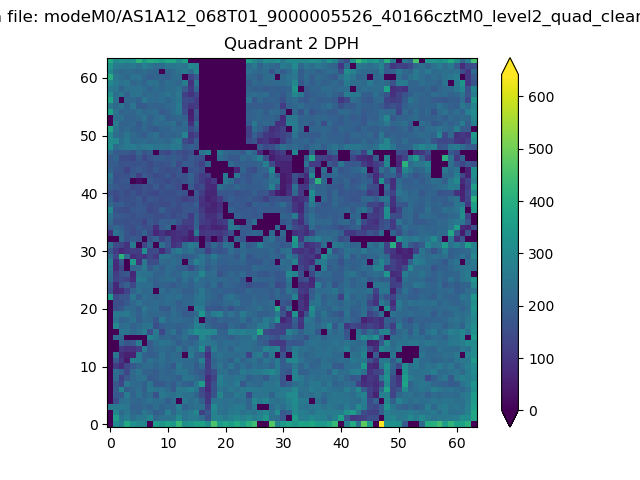 |
Quadrant C |
| Plot type | Count rate plots | Images |
|---|---|---|
| Comparison with Poisson distribution Blue bars denote a histogram of data divided into 1 sec bins. Red curve is a Poisson curve with rate = median count rate of data. |
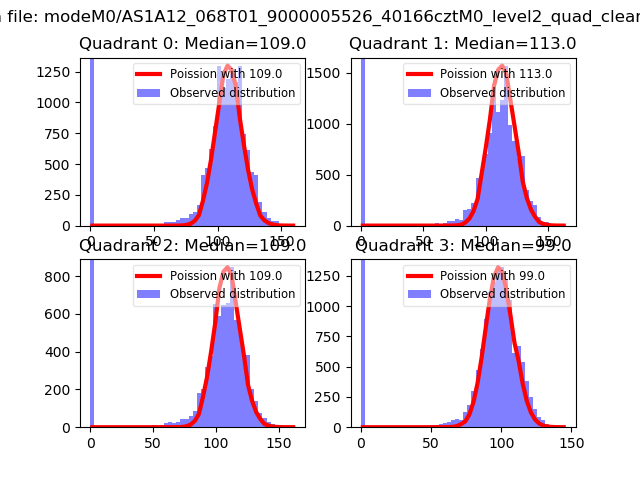 |
 |
| Quadrant-wise count rates Data is divided into 100 sec bins |
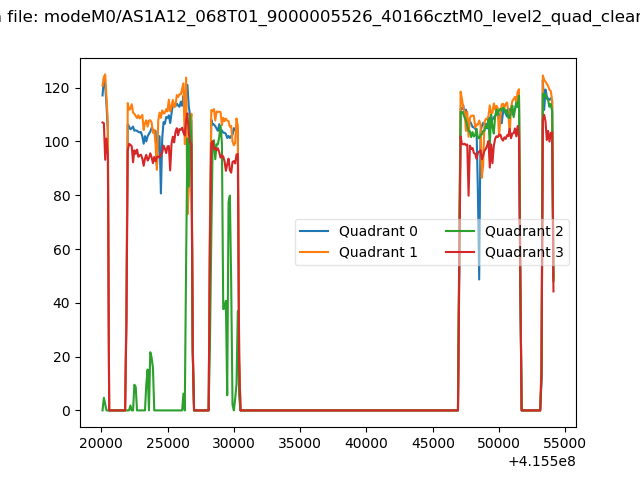 |
|
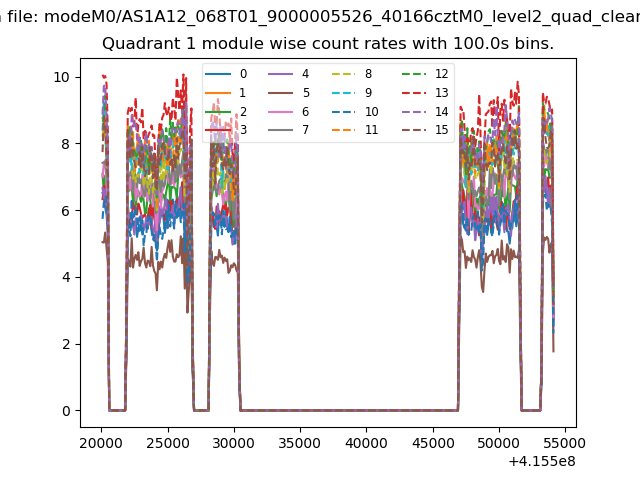
| Module-wise count rates for Quadrant A Data is divided into 100 sec bins |
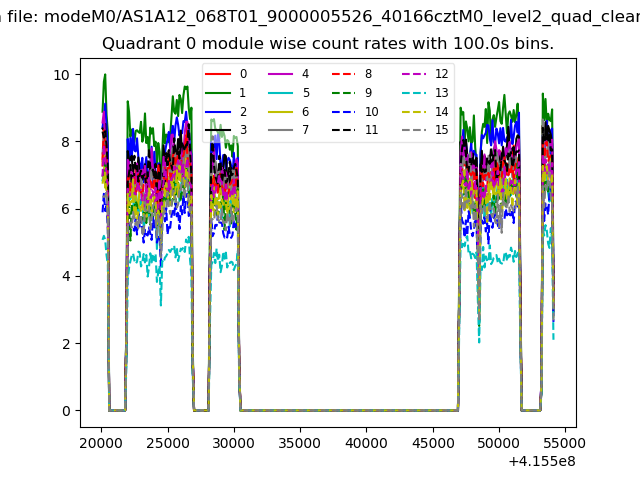 |
 |
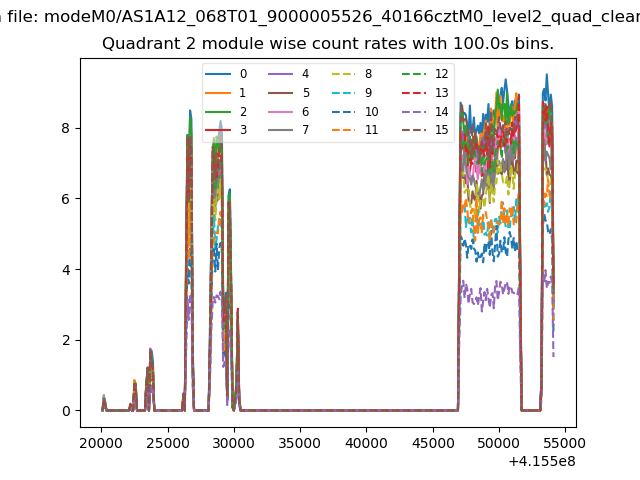
| Module-wise count rates for Quadrant B Data is divided into 100 sec bins |
 |
 |
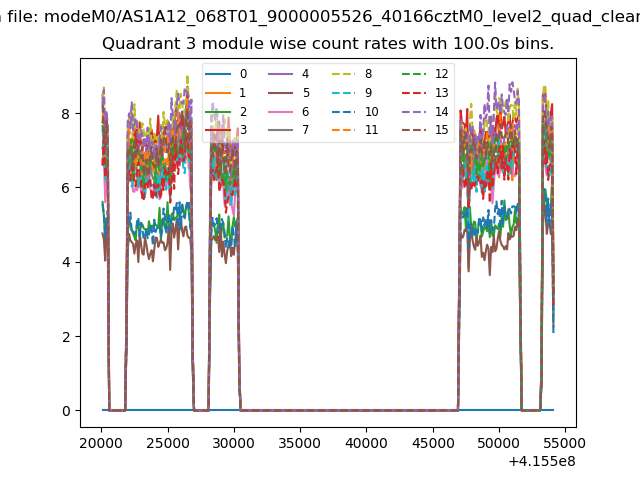
| Module-wise count rates for Quadrant C Data is divided into 100 sec bins |
 |
 |
| Module-wise count rates for Quadrant D Data is divided into 100 sec bins |
 |
 |
| Parameter | Plot |
|---|---|
| CZT HV Monitor | 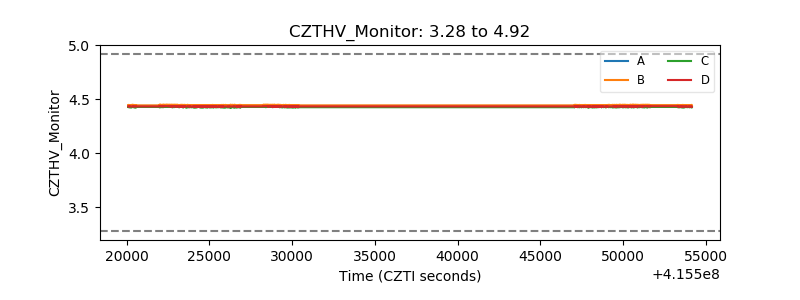 |
| D_VDD | 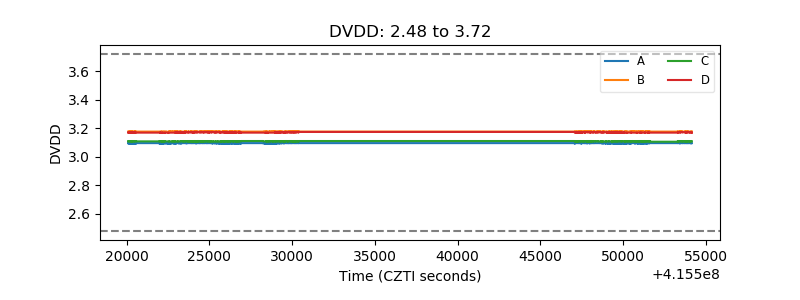 |
| Temperature 1 | 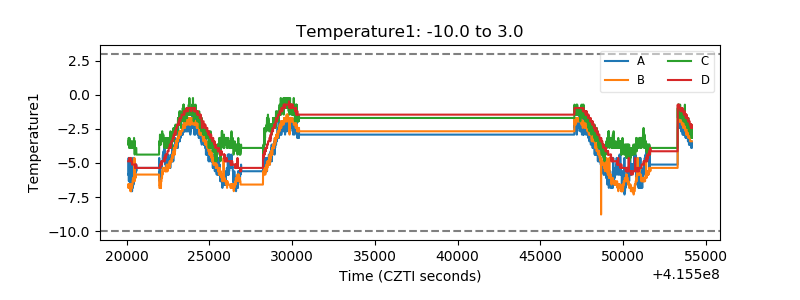 |
| Veto HV Monitor | 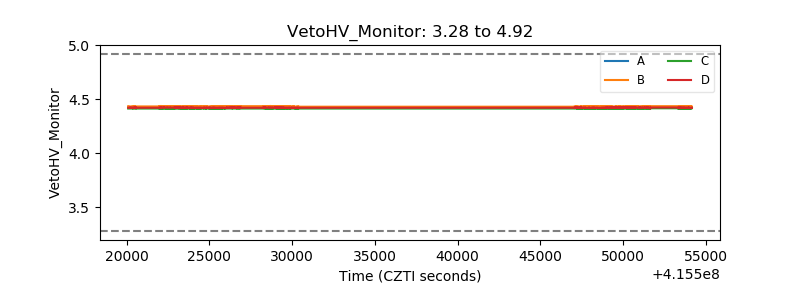 |
| Veto LLD | 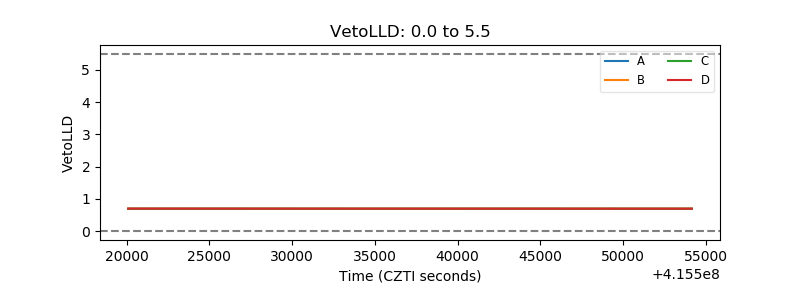 |
| Alpha Counter | 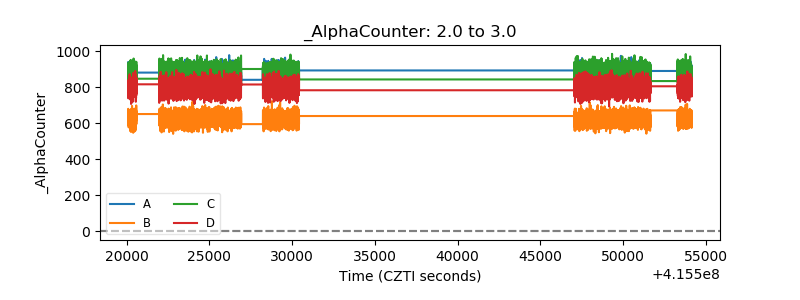 |
| _CPM_Rate | 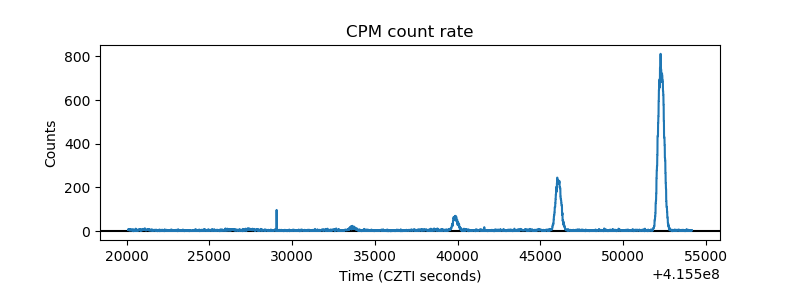 |
| CZT Counter | 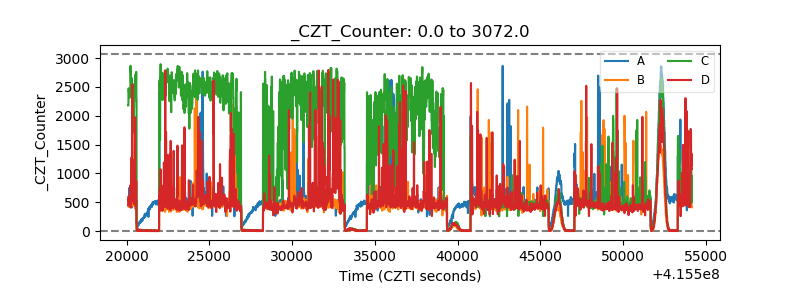 |
| +2.5 Volts monitor | 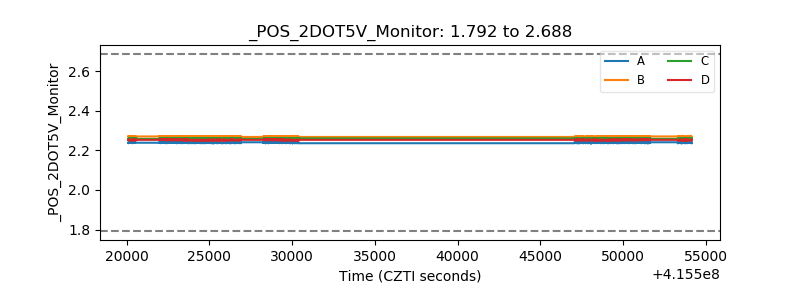 |
| +5 Volts monitor | 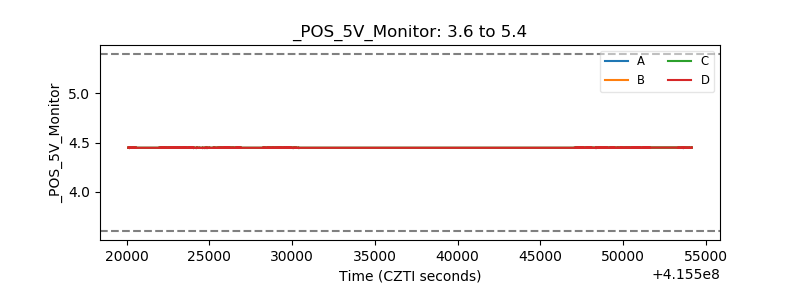 |
| _ROLL_ROT | 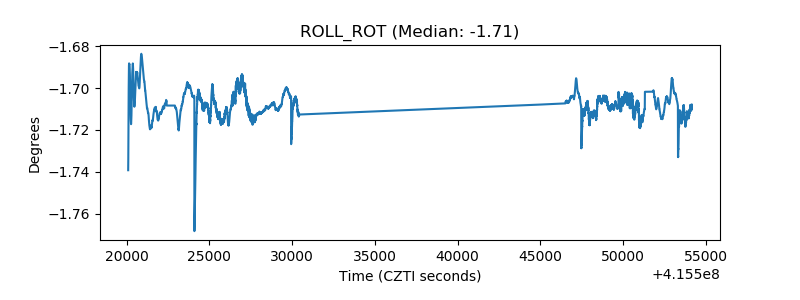 |
| _Roll_DEC | 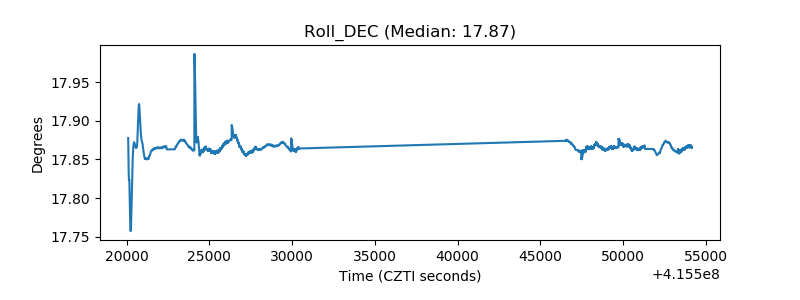 |
| _Roll_RA | 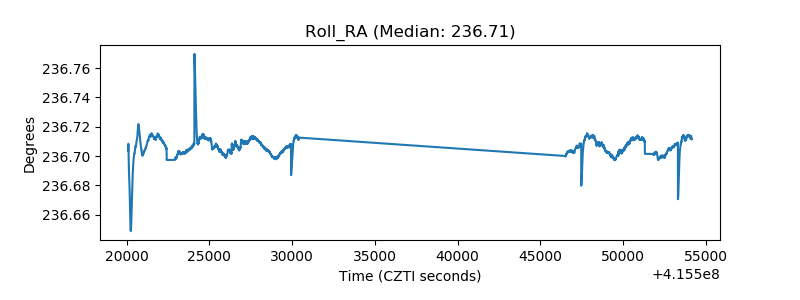 |
| Veto Counter | 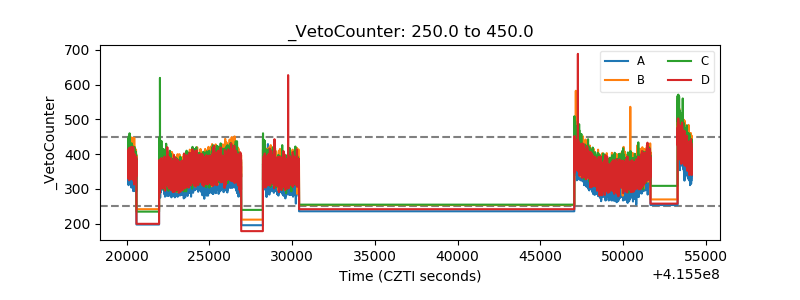 |