| Param | Original file | Final file |
|---|---|---|
| Filename | modeM0/AS1A12_068T01_9000005526_40168cztM0_level2.fits | modeM0/AS1A12_068T01_9000005526_40168cztM0_level2_quad_clean.evt |
| Size (bytes) | 364,337,280 | 93,309,120 |
| Size | 347.5 MB | 89.0 MB |
| Events in quadrant A | 3,056,750 | 623,766 |
| Events in quadrant B | 3,112,605 | 638,273 |
| Events in quadrant C | 3,931,287 | 615,958 |
| Events in quadrant D | 2,963,651 | 567,574 |
| Mode SS | |||
|---|---|---|---|
| Quadrant | BADHDUFLAG | Total packets | Discarded packets |
| A | 0 | 112 | 0 |
| B | 0 | 112 | 0 |
| C | 0 | 112 | 0 |
| D | 0 | 112 | 0 |
| Mode M9 | |||
|---|---|---|---|
| Quadrant | BADHDUFLAG | Total packets | Discarded packets |
| A | 0 | 34 | 0 |
| B | 0 | 34 | 0 |
| C | 0 | 34 | 0 |
| D | 0 | 34 | 0 |
| Mode M0 | |||
|---|---|---|---|
| Quadrant | BADHDUFLAG | Total packets | Discarded packets |
| A | 0 | 12550 | 3 |
| B | 0 | 12917 | 2 |
| C | 0 | 15383 | 2 |
| D | 0 | 12638 | 2 |
| Quadrant | Total seconds | Saturated seconds | Saturation percentage |
|---|---|---|---|
| A | 5427 | 38 | 0.700203% |
| B | 5427 | 146 | 2.690252% |
| C | 5427 | 96 | 1.768933% |
| D | 5427 | 79 | 1.455685% |
Noise dominated data is calculated using 1-second bins in cleaned event files. If a bin has >2000 counts, and if more than 50% of those come from <1% of pixels, then it is considered to be noise-dominated and hence unusable.
| Quadrant | # 1 sec bins | Bins with >0 counts | Bins with >2000 counts | High rate bins dominated by noise | Noise dominated (total time) | Noise dominated (detector-on time) | Marked lightcurve |
|---|---|---|---|---|---|---|---|
| A | 8862 | 5429 | 23 | 23 | 0.26% | 0.42% | 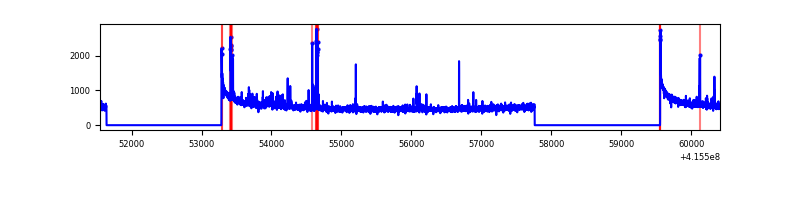 |
| B | 8862 | 5427 | 85 | 85 | 0.96% | 1.57% | 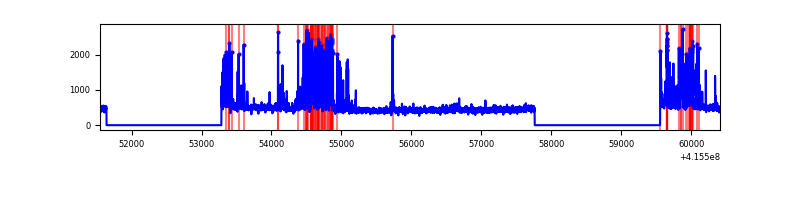 |
| C | 8862 | 5427 | 95 | 95 | 1.07% | 1.75% | 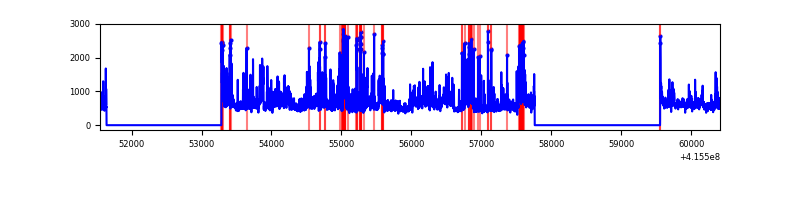 |
| D | 8862 | 5427 | 60 | 60 | 0.68% | 1.11% | 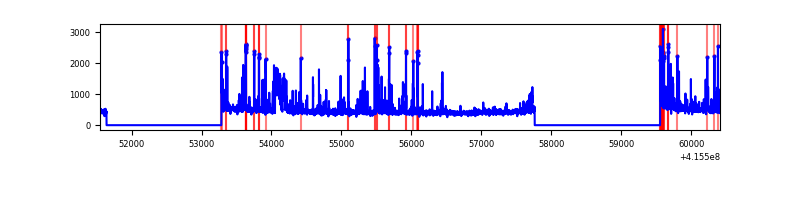 |
Top three noisy pixels from each quadrant. If the there are fewer than three noisy pixels in the level2.evt file, extra rows are filled as -1
| Pixel properties | Quadrant properties | ||||||
|---|---|---|---|---|---|---|---|
| Quadrant | DetID | PixID | Counts | Sigma | Mean | Median | Sigma |
| A | 10 | 83 | 499382 | 3970.97 | 616 | 603 | 125.6 |
| A | 13 | 248 | 76864 | 607.14 | 616 | 603 | 125.6 |
| A | 7 | 3 | 48881 | 384.36 | 616 | 603 | 125.6 |
| B | 5 | 255 | 505370 | 4211.7 | 614 | 598 | 119.8 |
| B | 4 | 171 | 88111 | 730.19 | 614 | 598 | 119.8 |
| B | 0 | 190 | 34851 | 285.8 | 614 | 598 | 119.8 |
| C | 9 | 187 | 1003922 | 7118.11 | 607 | 612 | 141.0 |
| C | 15 | 214 | 226649 | 1603.65 | 607 | 612 | 141.0 |
| C | 10 | 20 | 210586 | 1489.69 | 607 | 612 | 141.0 |
| D | 12 | 227 | 169549 | 1137.92 | 606 | 590 | 148.5 |
| D | 13 | 249 | 143452 | 962.16 | 606 | 590 | 148.5 |
| D | 1 | 47 | 125822 | 843.42 | 606 | 590 | 148.5 |
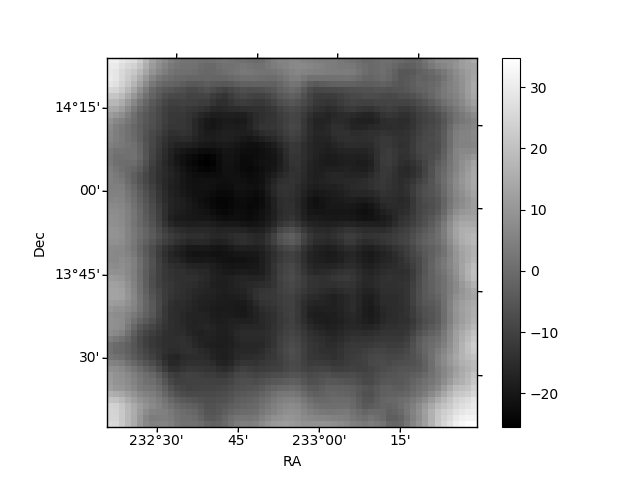
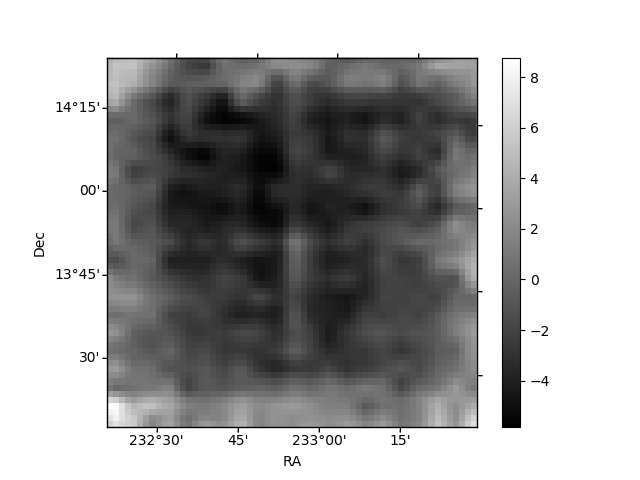
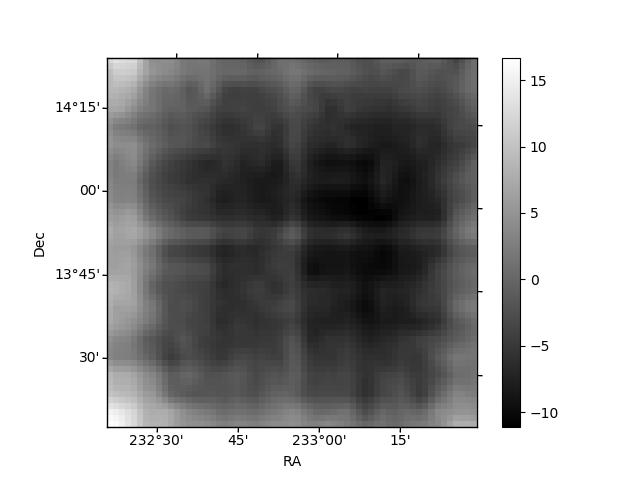
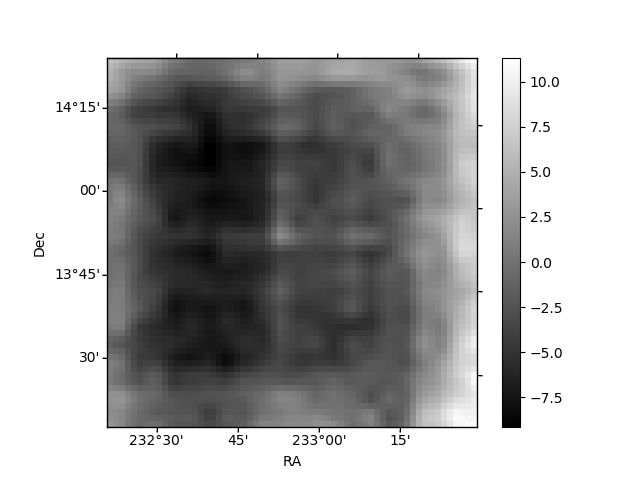
Histogram calculated using DETX and DETY for each event in the final _common_clean file
| Quadrant A | 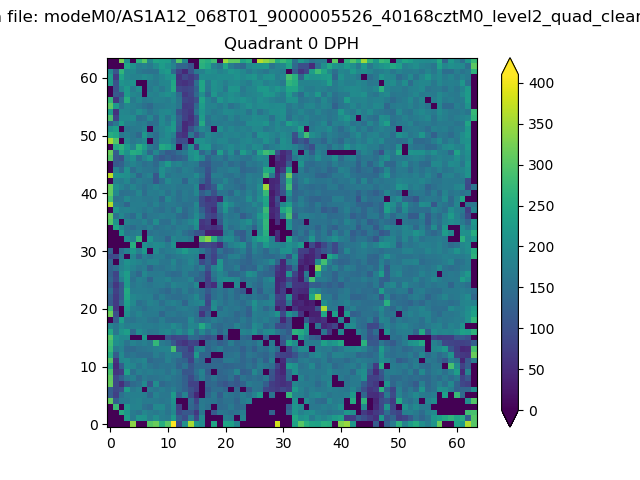 |
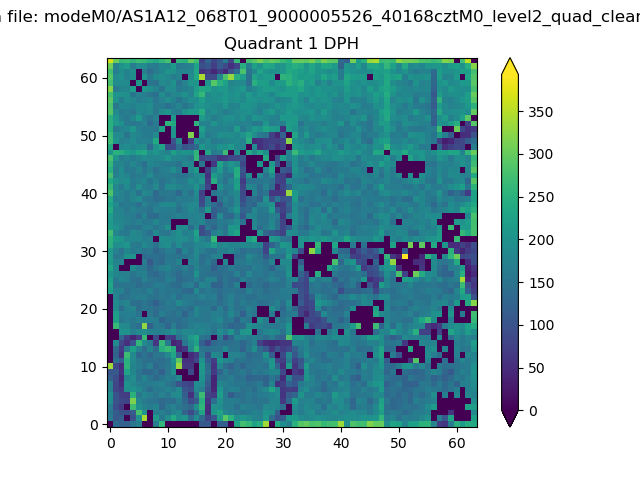 |
Quadrant B |
|---|---|---|---|
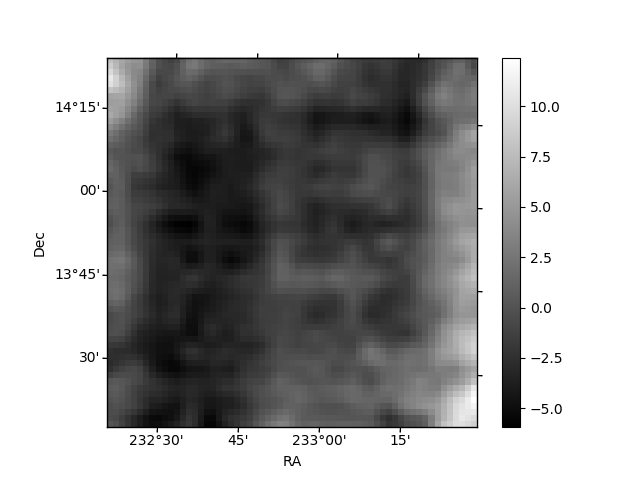
| Quadrant D | 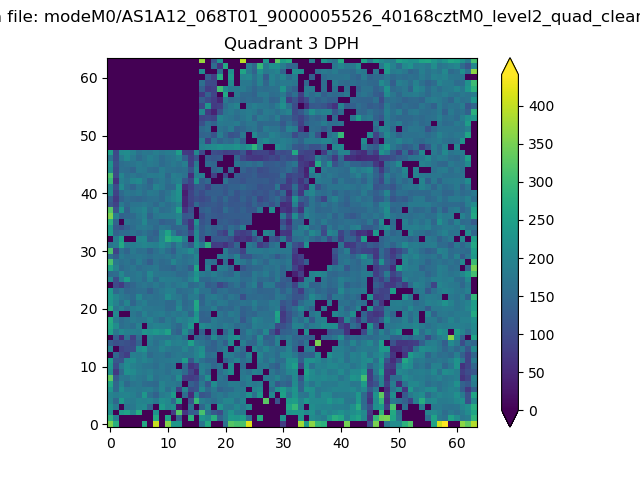 |
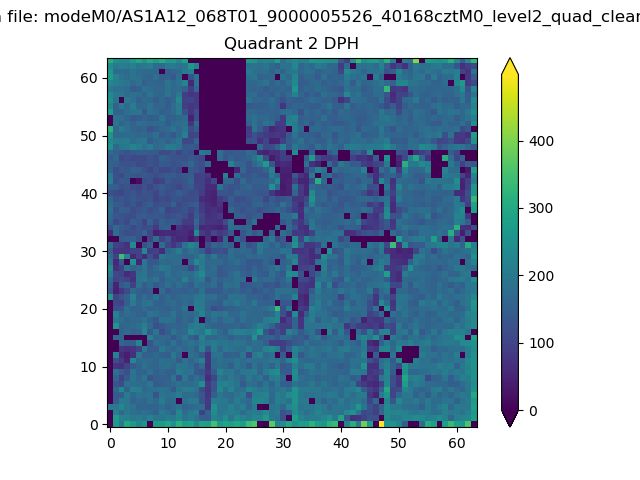 |
Quadrant C |
| Plot type | Count rate plots | Images |
|---|---|---|
| Comparison with Poisson distribution Blue bars denote a histogram of data divided into 1 sec bins. Red curve is a Poisson curve with rate = median count rate of data. |
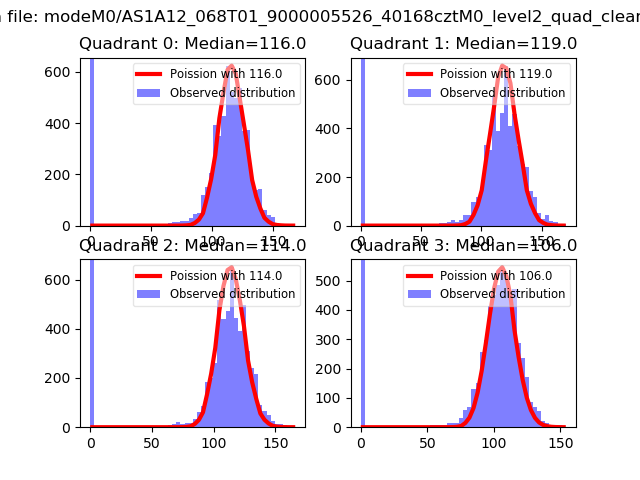 |
 |
| Quadrant-wise count rates Data is divided into 100 sec bins |
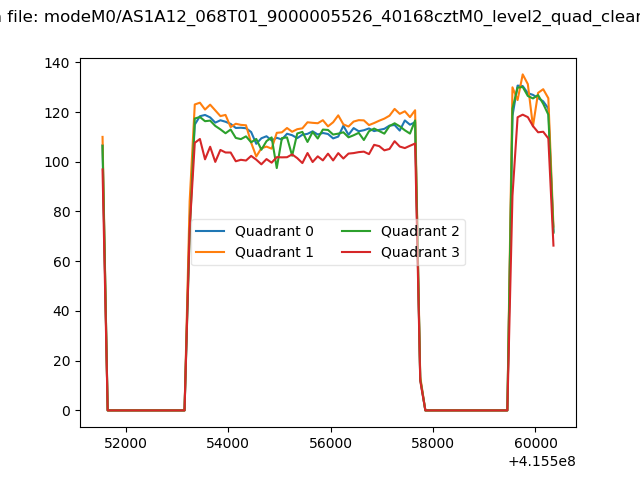 |
|
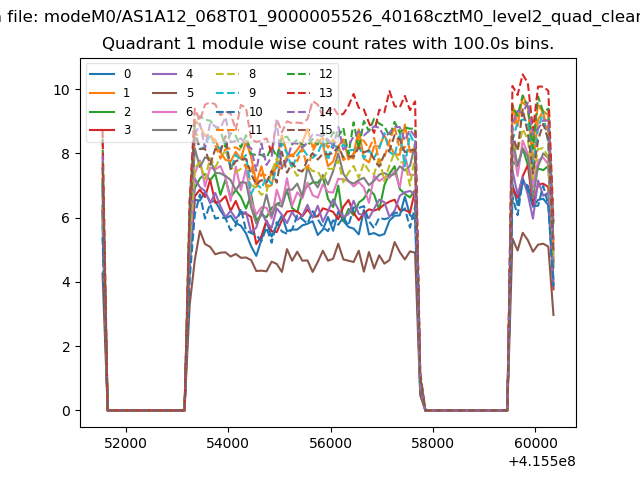
| Module-wise count rates for Quadrant A Data is divided into 100 sec bins |
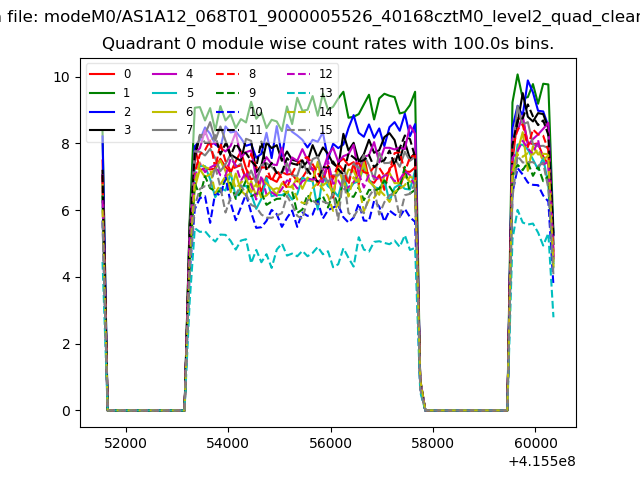 |
 |
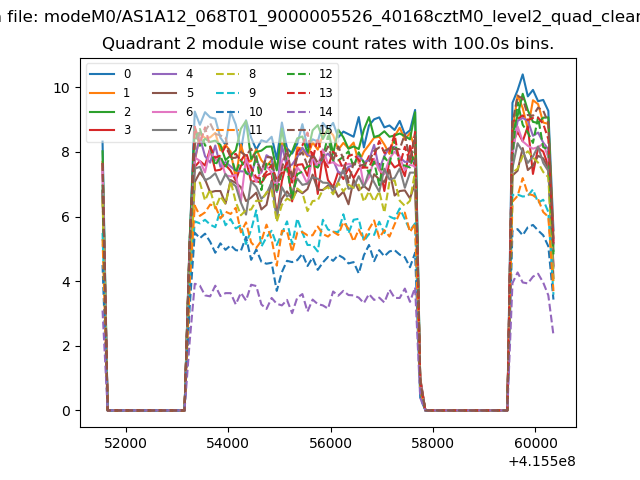
| Module-wise count rates for Quadrant B Data is divided into 100 sec bins |
 |
 |
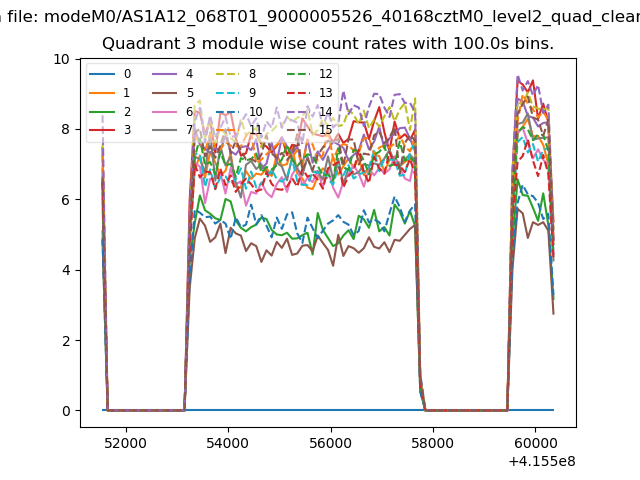
| Module-wise count rates for Quadrant C Data is divided into 100 sec bins |
 |
 |
| Module-wise count rates for Quadrant D Data is divided into 100 sec bins |
 |
 |
| Parameter | Plot |
|---|---|
| CZT HV Monitor | 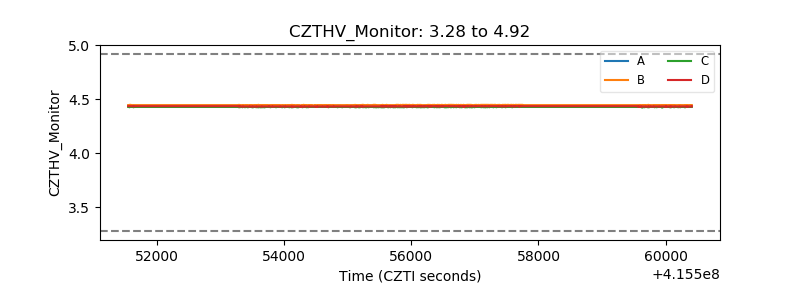 |
| D_VDD | 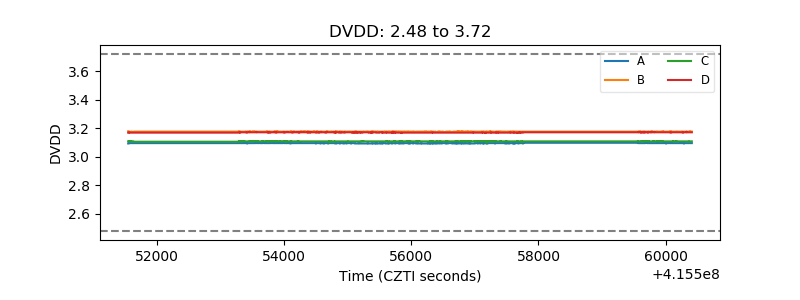 |
| Temperature 1 | 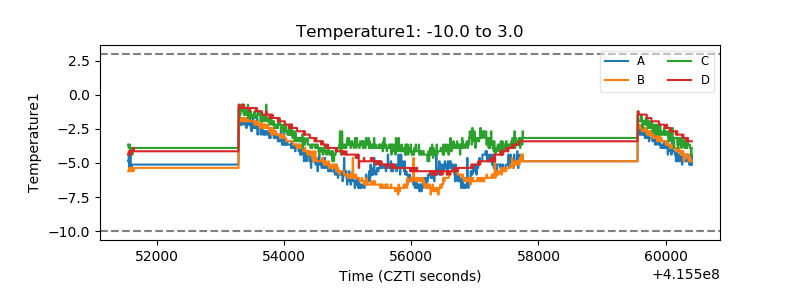 |
| Veto HV Monitor |  |
| Veto LLD | 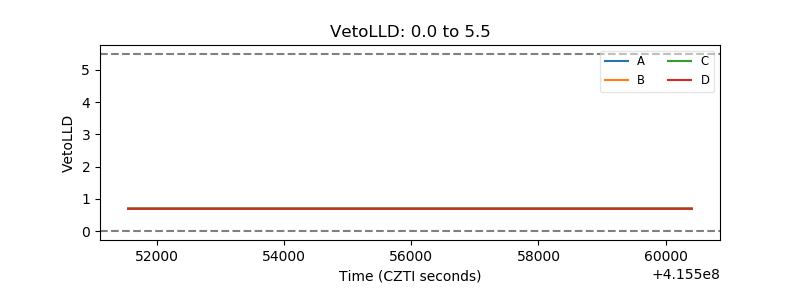 |
| Alpha Counter | 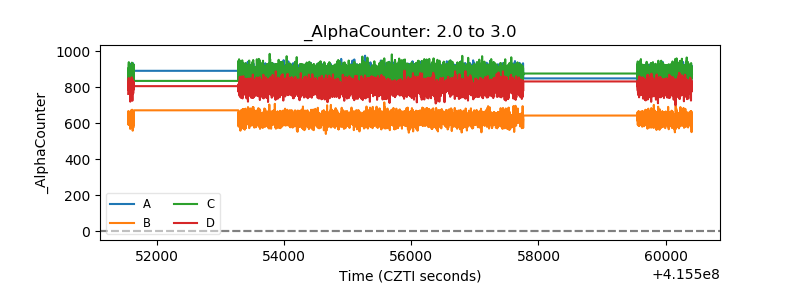 |
| _CPM_Rate | 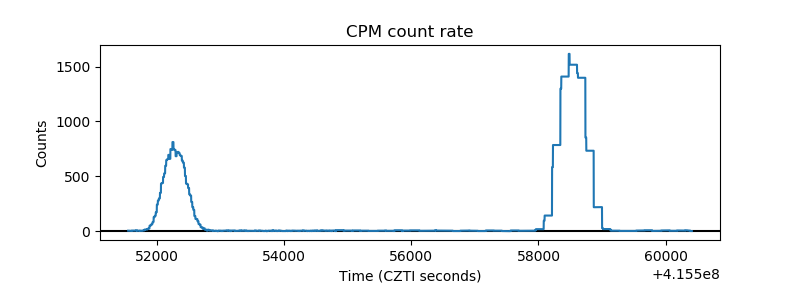 |
| CZT Counter | 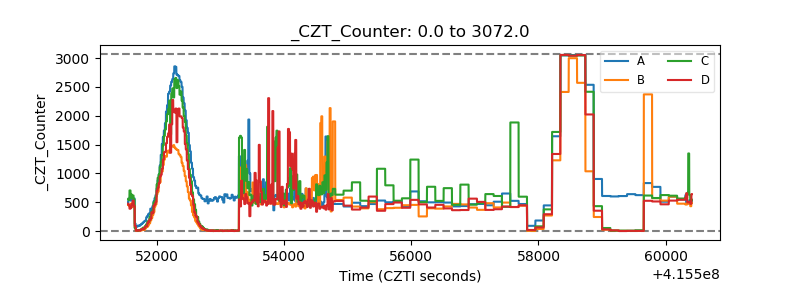 |
| +2.5 Volts monitor | 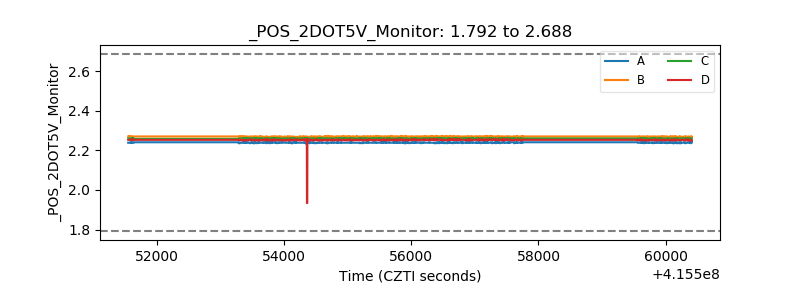 |
| +5 Volts monitor |  |
| _ROLL_ROT | 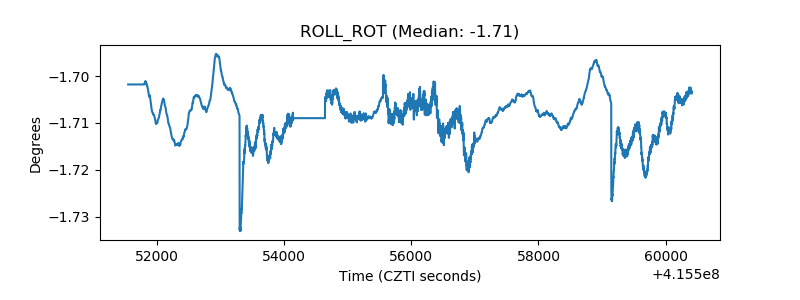 |
| _Roll_DEC | 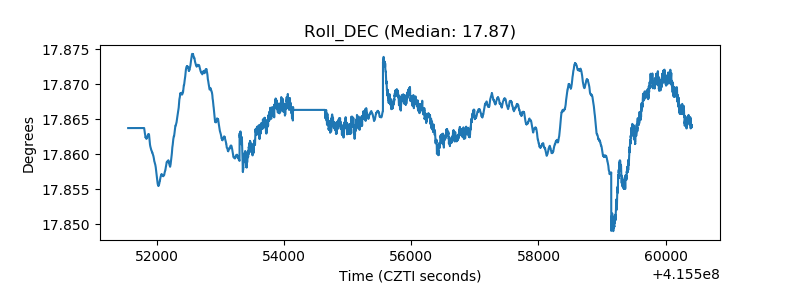 |
| _Roll_RA | 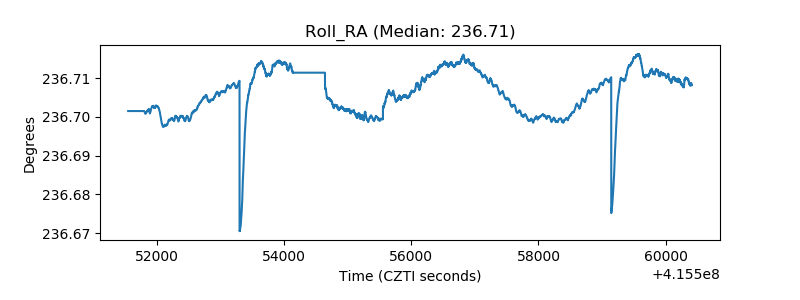 |
| Veto Counter | 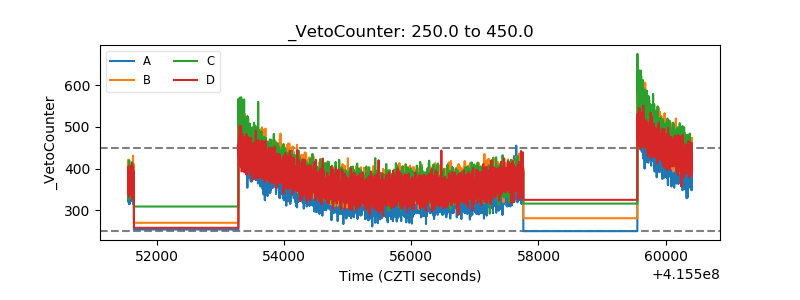 |