| Param | Original file | Final file |
|---|---|---|
| Filename | modeM0/AS1A12_068T01_9000005526_40169cztM0_level2.fits | modeM0/AS1A12_068T01_9000005526_40169cztM0_level2_quad_clean.evt |
| Size (bytes) | 377,665,920 | 90,383,040 |
| Size | 360.2 MB | 86.2 MB |
| Events in quadrant A | 3,243,385 | 598,055 |
| Events in quadrant B | 2,783,280 | 636,094 |
| Events in quadrant C | 4,455,898 | 589,168 |
| Events in quadrant D | 3,097,231 | 553,936 |
| Mode SS | |||
|---|---|---|---|
| Quadrant | BADHDUFLAG | Total packets | Discarded packets |
| A | 0 | 102 | 0 |
| B | 0 | 102 | 0 |
| C | 0 | 102 | 0 |
| D | 0 | 102 | 0 |
| Mode M9 | |||
|---|---|---|---|
| Quadrant | BADHDUFLAG | Total packets | Discarded packets |
| A | 0 | 37 | 0 |
| B | 0 | 37 | 0 |
| C | 0 | 37 | 0 |
| D | 0 | 37 | 0 |
| Mode M0 | |||
|---|---|---|---|
| Quadrant | BADHDUFLAG | Total packets | Discarded packets |
| A | 0 | 12754 | 3 |
| B | 0 | 11671 | 2 |
| C | 0 | 16728 | 2 |
| D | 0 | 12777 | 2 |
| Quadrant | Total seconds | Saturated seconds | Saturation percentage |
|---|---|---|---|
| A | 5141 | 212 | 4.123711% |
| B | 5141 | 117 | 2.275822% |
| C | 5141 | 370 | 7.197043% |
| D | 5141 | 188 | 3.656876% |
Noise dominated data is calculated using 1-second bins in cleaned event files. If a bin has >2000 counts, and if more than 50% of those come from <1% of pixels, then it is considered to be noise-dominated and hence unusable.
| Quadrant | # 1 sec bins | Bins with >0 counts | Bins with >2000 counts | High rate bins dominated by noise | Noise dominated (total time) | Noise dominated (detector-on time) | Marked lightcurve |
|---|---|---|---|---|---|---|---|
| A | 7053 | 5142 | 166 | 166 | 2.35% | 3.23% | 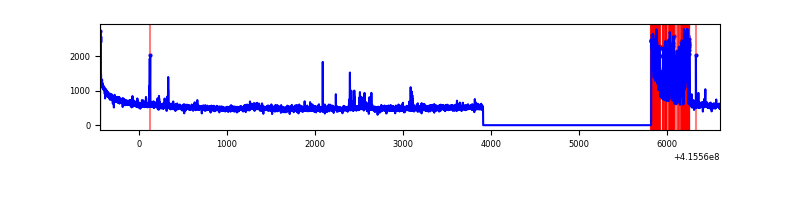 |
| B | 7052 | 5140 | 75 | 75 | 1.06% | 1.46% | 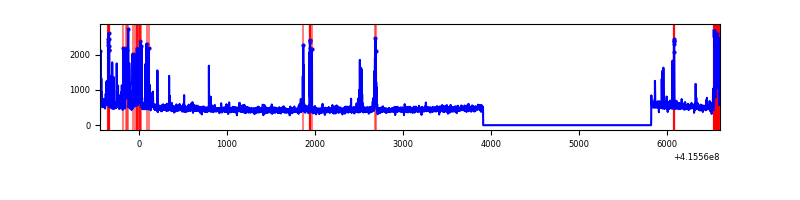 |
| C | 7052 | 5140 | 389 | 389 | 5.52% | 7.57% | 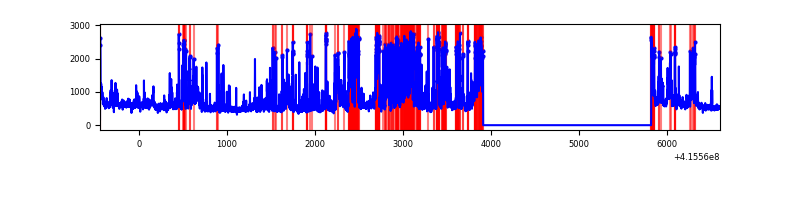 |
| D | 7052 | 5140 | 177 | 177 | 2.51% | 3.44% | 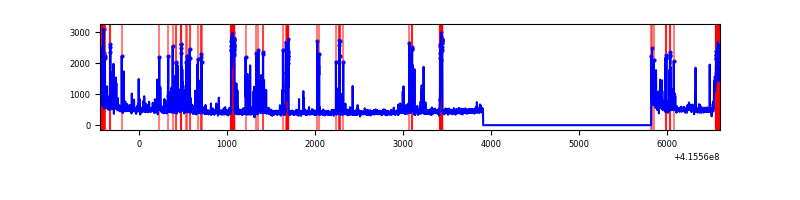 |
Top three noisy pixels from each quadrant. If the there are fewer than three noisy pixels in the level2.evt file, extra rows are filled as -1
| Pixel properties | Quadrant properties | ||||||
|---|---|---|---|---|---|---|---|
| Quadrant | DetID | PixID | Counts | Sigma | Mean | Median | Sigma |
| A | 10 | 83 | 445184 | 3747.55 | 587 | 576 | 118.6 |
| A | 13 | 248 | 441755 | 3718.65 | 587 | 576 | 118.6 |
| A | 15 | 223 | 40785 | 338.92 | 587 | 576 | 118.6 |
| B | 5 | 172 | 189288 | 1661.75 | 594 | 581 | 113.6 |
| B | 5 | 255 | 161625 | 1418.15 | 594 | 581 | 113.6 |
| B | 4 | 171 | 38790 | 336.47 | 594 | 581 | 113.6 |
| C | 9 | 187 | 1892114 | 13946.37 | 580 | 585 | 135.6 |
| C | 15 | 214 | 213064 | 1566.62 | 580 | 585 | 135.6 |
| C | 0 | 10 | 45329 | 329.9 | 580 | 585 | 135.6 |
| D | 1 | 47 | 234137 | 1639.16 | 581 | 567 | 142.5 |
| D | 13 | 249 | 210470 | 1473.06 | 581 | 567 | 142.5 |
| D | 9 | 19 | 138384 | 967.18 | 581 | 567 | 142.5 |
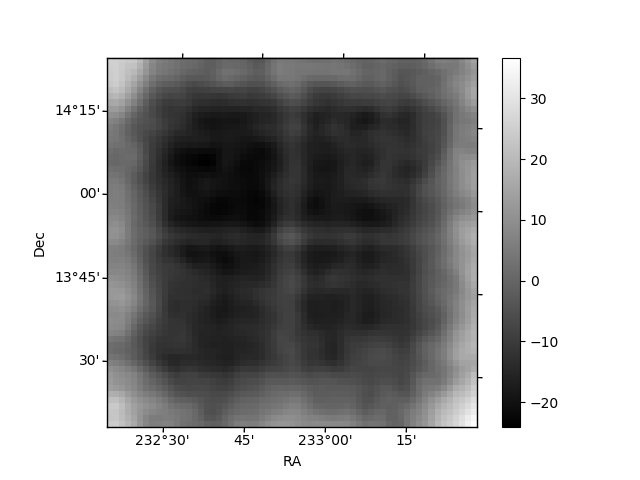
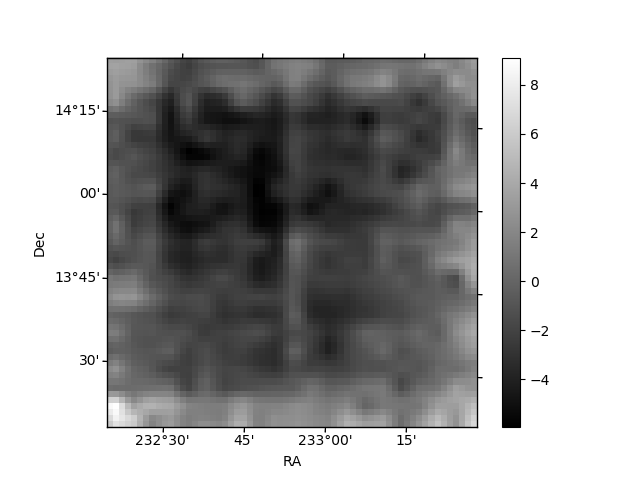
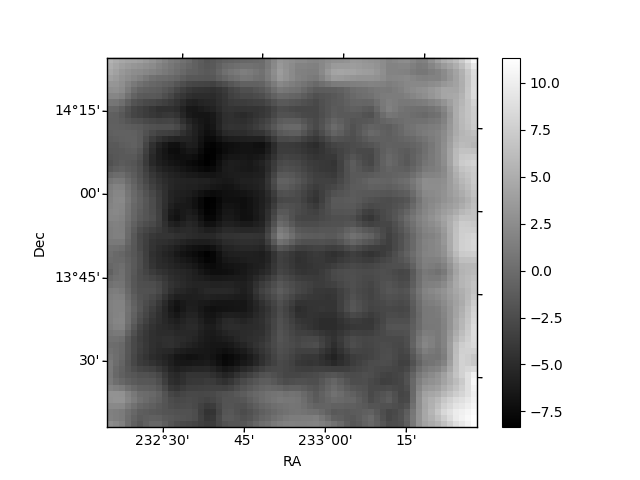
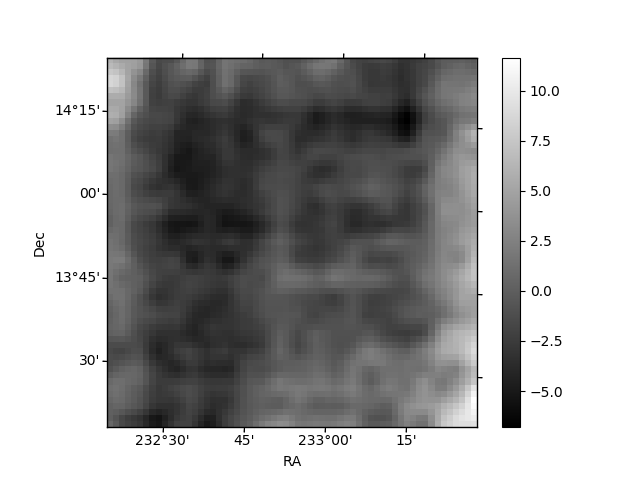
Histogram calculated using DETX and DETY for each event in the final _common_clean file
| Quadrant A | 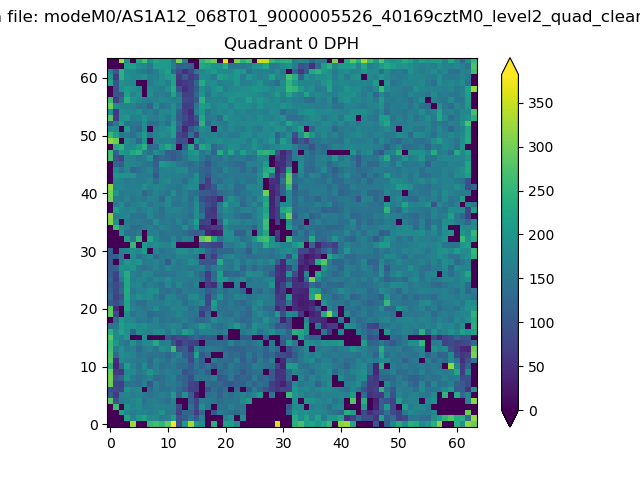 |
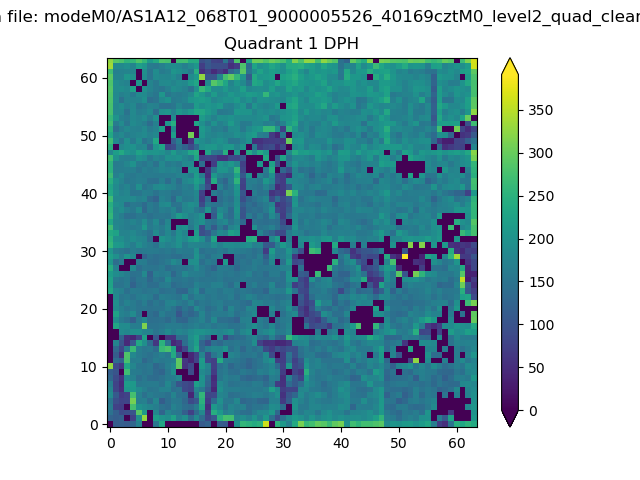 |
Quadrant B |
|---|---|---|---|
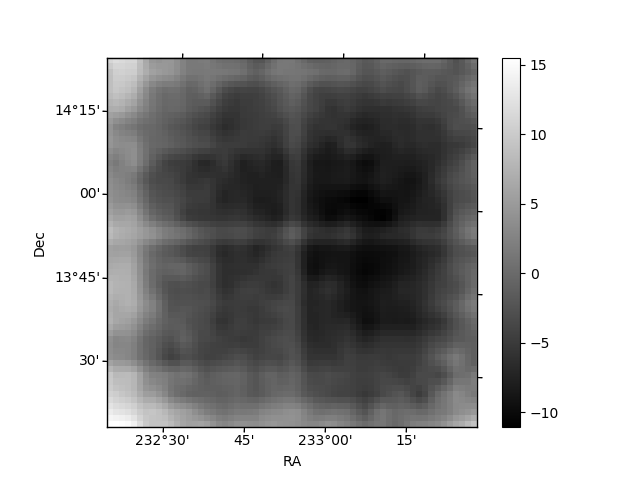
| Quadrant D | 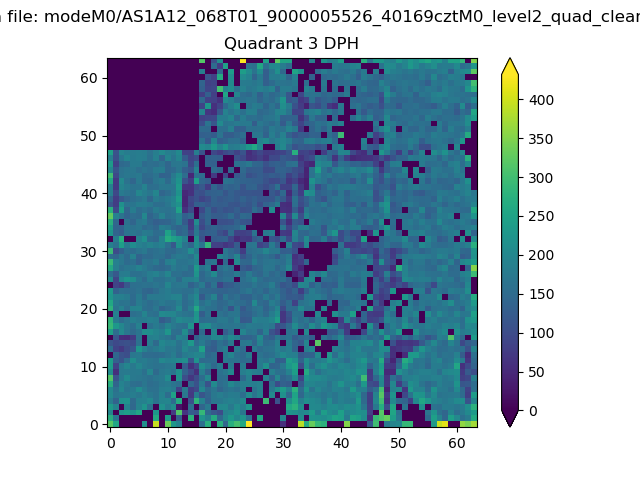 |
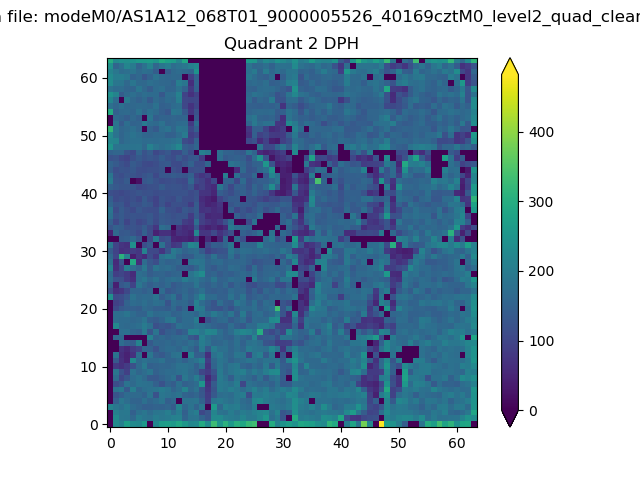 |
Quadrant C |
| Plot type | Count rate plots | Images |
|---|---|---|
| Comparison with Poisson distribution Blue bars denote a histogram of data divided into 1 sec bins. Red curve is a Poisson curve with rate = median count rate of data. |
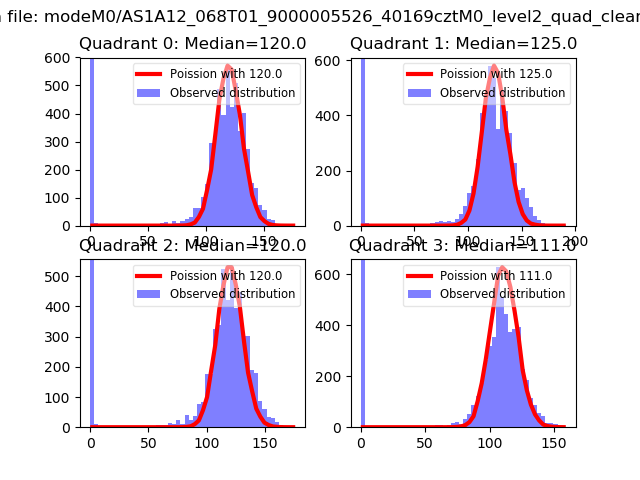 |
 |
| Quadrant-wise count rates Data is divided into 100 sec bins |
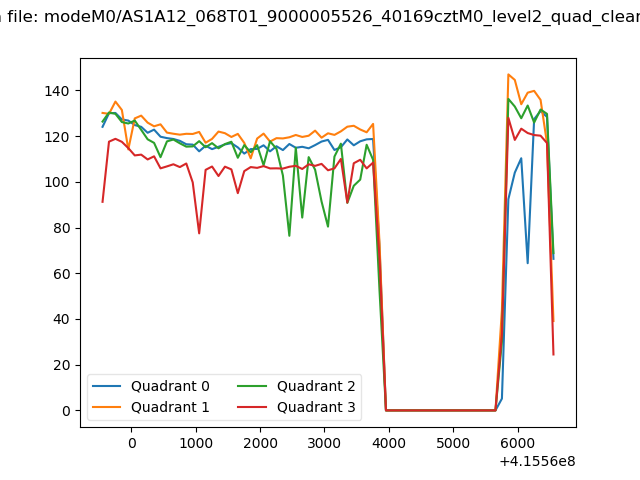 |
|
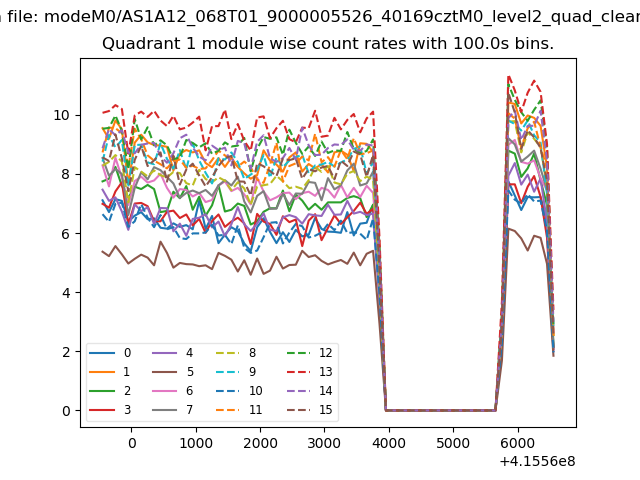
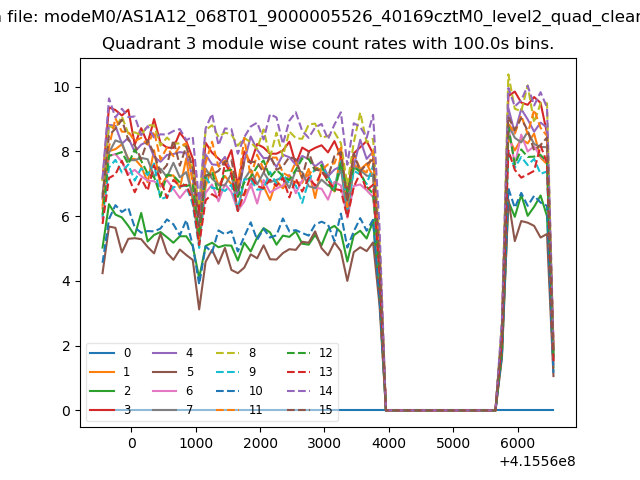
| Module-wise count rates for Quadrant A Data is divided into 100 sec bins |
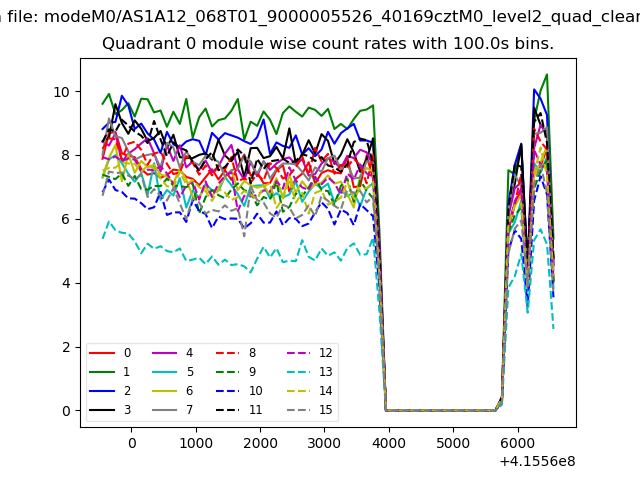 |
 |
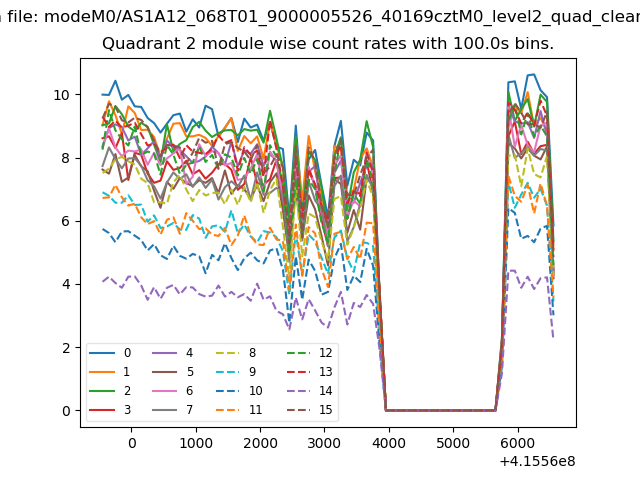
| Module-wise count rates for Quadrant B Data is divided into 100 sec bins |
 |
 |
| Module-wise count rates for Quadrant C Data is divided into 100 sec bins |
 |
 |
| Module-wise count rates for Quadrant D Data is divided into 100 sec bins |
 |
 |
| Parameter | Plot |
|---|---|
| CZT HV Monitor | 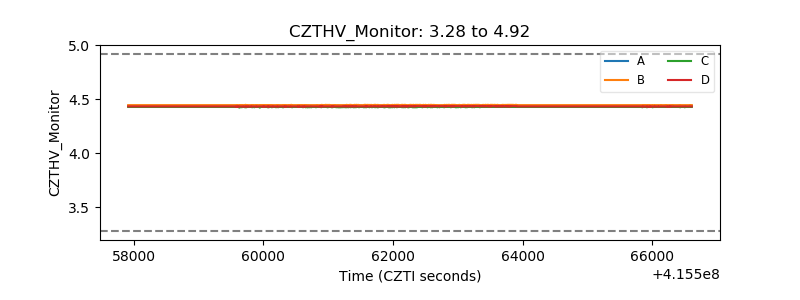 |
| D_VDD | 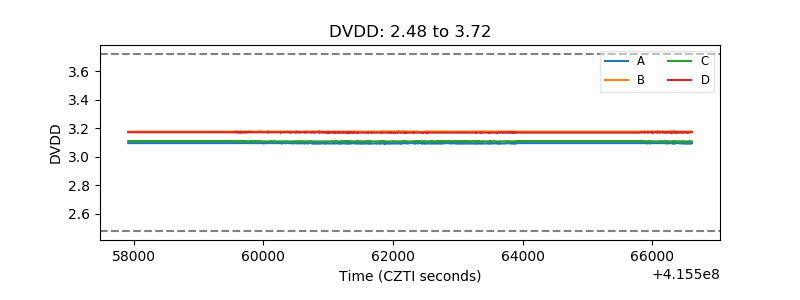 |
| Temperature 1 | 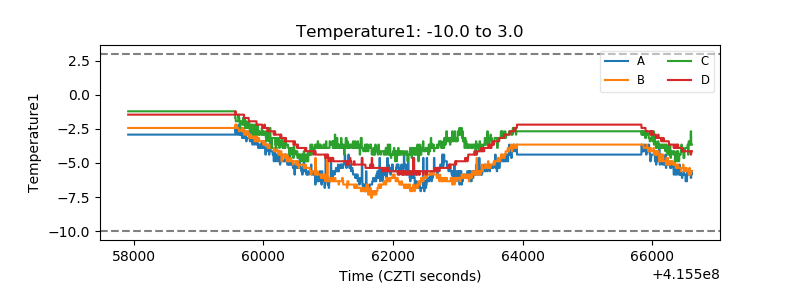 |
| Veto HV Monitor | 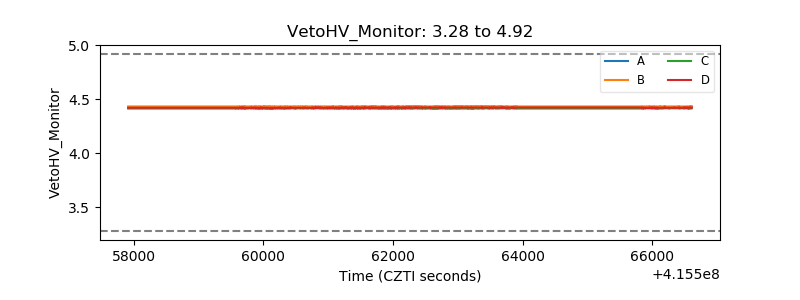 |
| Veto LLD | 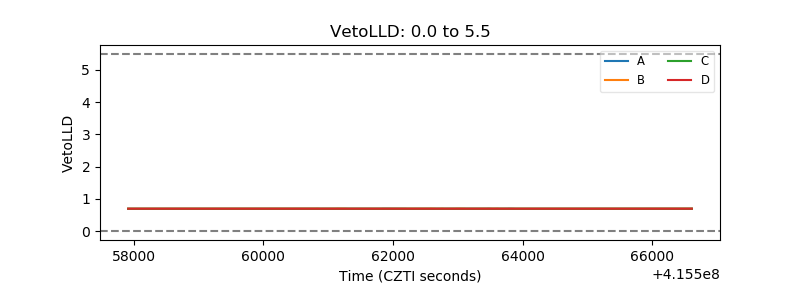 |
| Alpha Counter |  |
| _CPM_Rate | 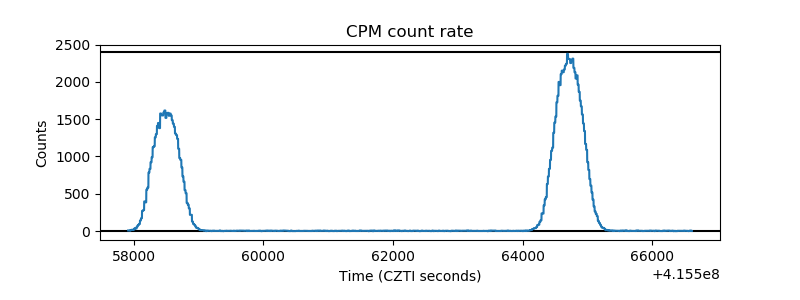 |
| CZT Counter | 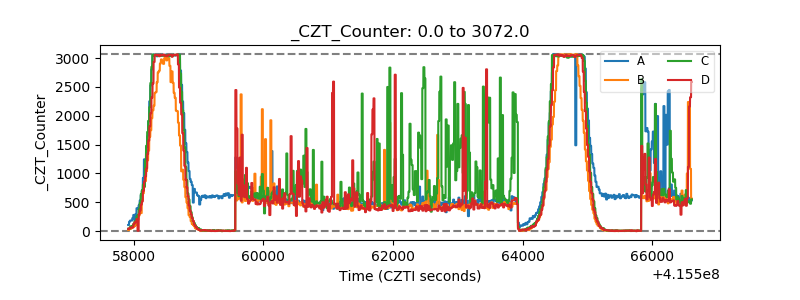 |
| +2.5 Volts monitor | 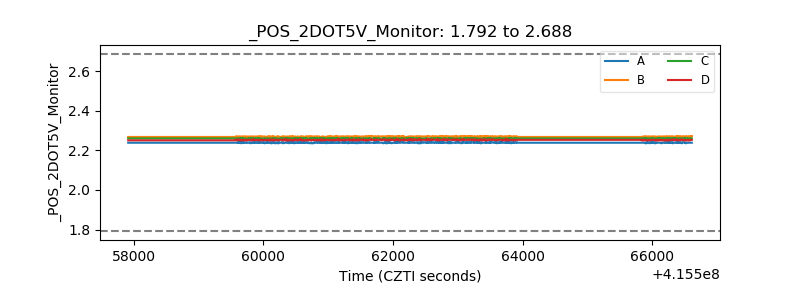 |
| +5 Volts monitor | 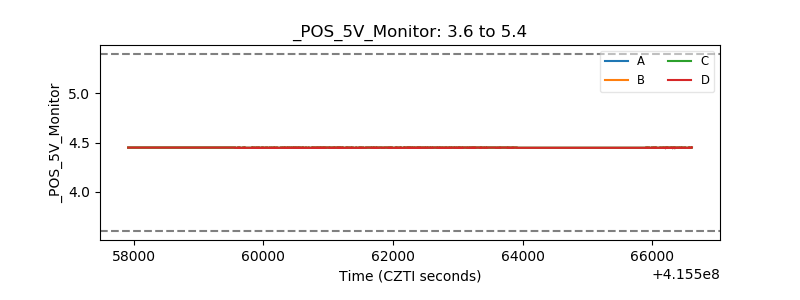 |
| _ROLL_ROT | 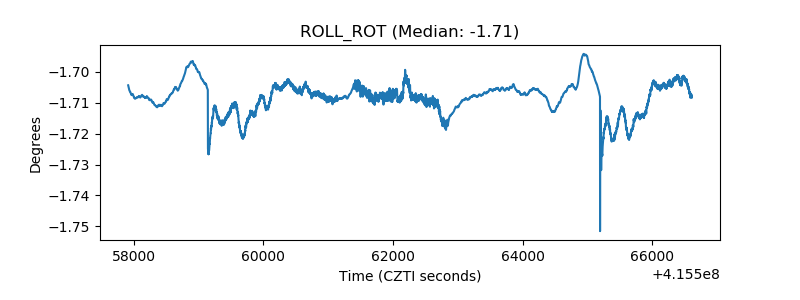 |
| _Roll_DEC | 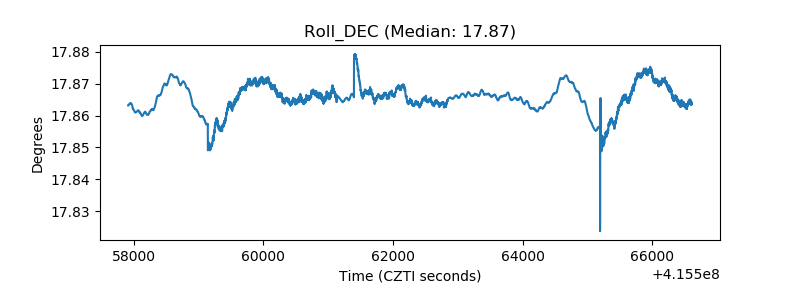 |
| _Roll_RA | 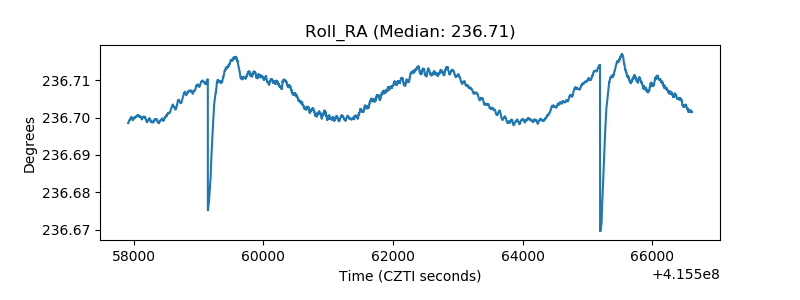 |
| Veto Counter | 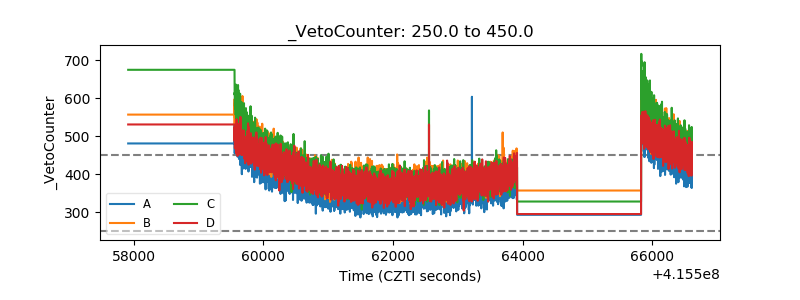 |