| Param | Original file | Final file |
|---|---|---|
| Filename | modeM0/AS1A12_068T01_9000005526_40170cztM0_level2.fits | modeM0/AS1A12_068T01_9000005526_40170cztM0_level2_quad_clean.evt |
| Size (bytes) | 371,779,200 | 91,287,360 |
| Size | 354.6 MB | 87.1 MB |
| Events in quadrant A | 3,619,267 | 582,794 |
| Events in quadrant B | 2,644,431 | 650,719 |
| Events in quadrant C | 3,898,214 | 627,254 |
| Events in quadrant D | 3,205,262 | 548,287 |
| Mode SS | |||
|---|---|---|---|
| Quadrant | BADHDUFLAG | Total packets | Discarded packets |
| A | 0 | 104 | 0 |
| B | 0 | 104 | 0 |
| C | 0 | 104 | 0 |
| D | 0 | 104 | 0 |
| Mode M9 | |||
|---|---|---|---|
| Quadrant | BADHDUFLAG | Total packets | Discarded packets |
| A | 0 | 40 | 0 |
| B | 0 | 40 | 0 |
| C | 0 | 40 | 0 |
| D | 0 | 40 | 0 |
| Mode M0 | |||
|---|---|---|---|
| Quadrant | BADHDUFLAG | Total packets | Discarded packets |
| A | 0 | 13803 | 3 |
| B | 0 | 11076 | 2 |
| C | 0 | 14963 | 2 |
| D | 0 | 13005 | 2 |
| Quadrant | Total seconds | Saturated seconds | Saturation percentage |
|---|---|---|---|
| A | 5074 | 429 | 8.454868% |
| B | 5074 | 78 | 1.537249% |
| C | 5074 | 127 | 2.502956% |
| D | 5074 | 316 | 6.227828% |
Noise dominated data is calculated using 1-second bins in cleaned event files. If a bin has >2000 counts, and if more than 50% of those come from <1% of pixels, then it is considered to be noise-dominated and hence unusable.
| Quadrant | # 1 sec bins | Bins with >0 counts | Bins with >2000 counts | High rate bins dominated by noise | Noise dominated (total time) | Noise dominated (detector-on time) | Marked lightcurve |
|---|---|---|---|---|---|---|---|
| A | 9018 | 5076 | 366 | 366 | 4.06% | 7.21% | 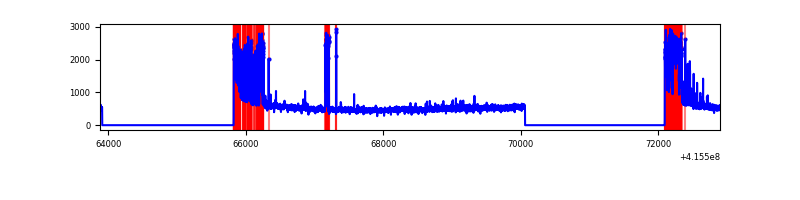 |
| B | 9018 | 5075 | 52 | 52 | 0.58% | 1.02% | 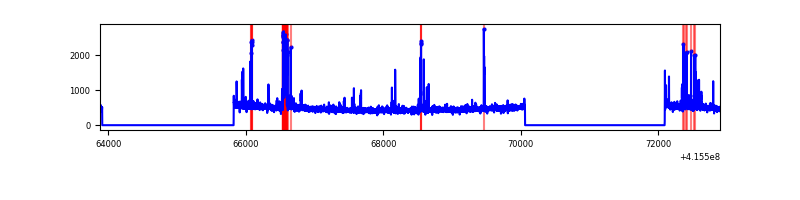 |
| C | 9018 | 5075 | 131 | 131 | 1.45% | 2.58% | 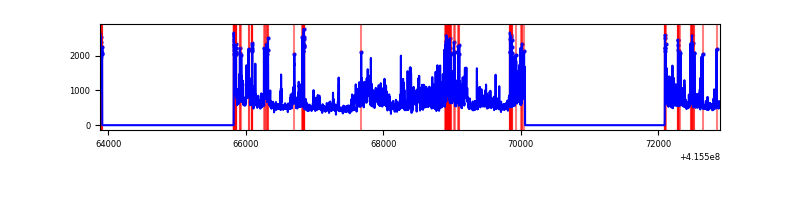 |
| D | 9018 | 5075 | 317 | 317 | 3.52% | 6.25% | 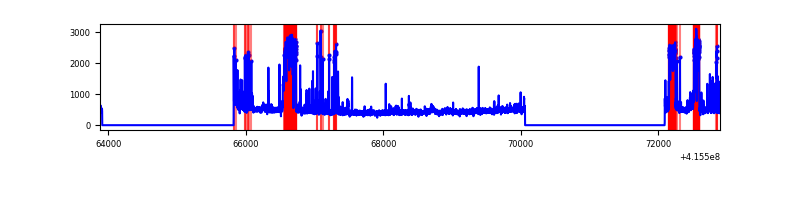 |
Top three noisy pixels from each quadrant. If the there are fewer than three noisy pixels in the level2.evt file, extra rows are filled as -1
| Pixel properties | Quadrant properties | ||||||
|---|---|---|---|---|---|---|---|
| Quadrant | DetID | PixID | Counts | Sigma | Mean | Median | Sigma |
| A | 13 | 248 | 829899 | 7124.64 | 571 | 561 | 116.4 |
| A | 10 | 83 | 397688 | 3411.62 | 571 | 561 | 116.4 |
| A | 2 | 79 | 112211 | 959.16 | 571 | 561 | 116.4 |
| B | 5 | 172 | 229170 | 2012.23 | 596 | 581 | 113.6 |
| B | 0 | 245 | 30301 | 261.62 | 596 | 581 | 113.6 |
| B | 4 | 171 | 20037 | 171.27 | 596 | 581 | 113.6 |
| C | 9 | 187 | 1322026 | 9635.84 | 591 | 598 | 137.1 |
| C | 15 | 214 | 213820 | 1554.81 | 591 | 598 | 137.1 |
| C | 0 | 10 | 46963 | 338.09 | 591 | 598 | 137.1 |
| D | 13 | 249 | 797277 | 5643.19 | 576 | 561 | 141.2 |
| D | 12 | 233 | 61516 | 431.75 | 576 | 561 | 141.2 |
| D | 1 | 47 | 54076 | 379.05 | 576 | 561 | 141.2 |
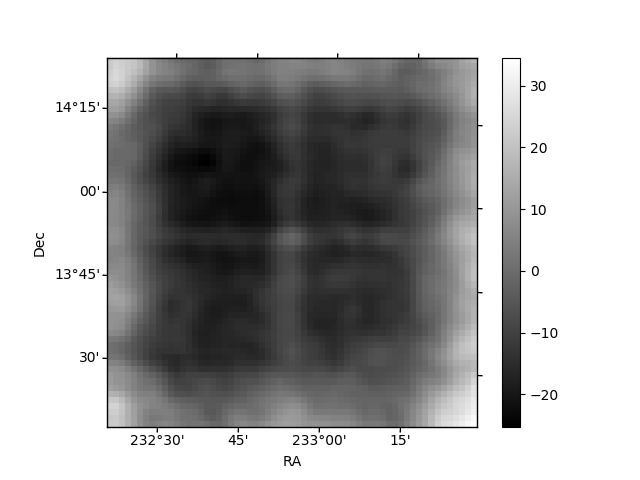
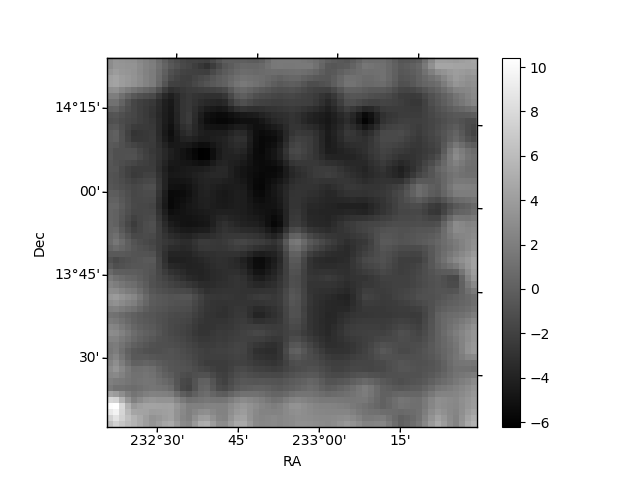
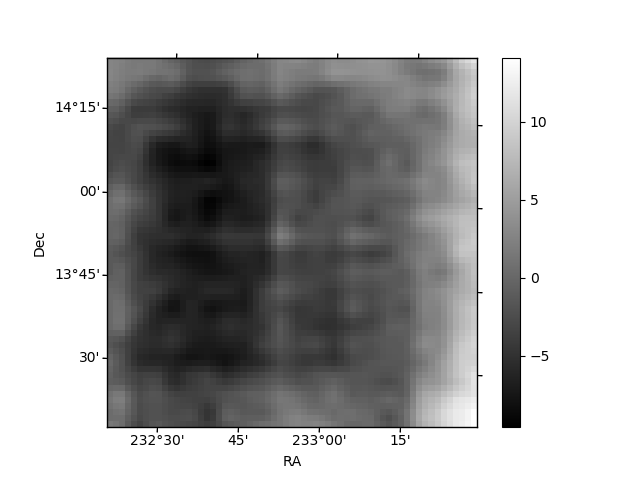
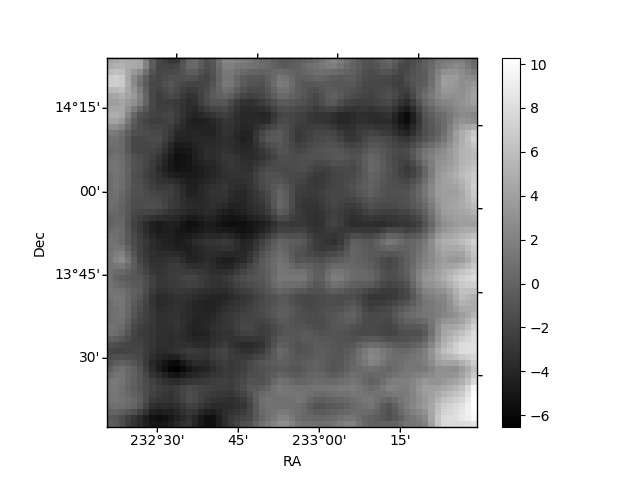
Histogram calculated using DETX and DETY for each event in the final _common_clean file
| Quadrant A | 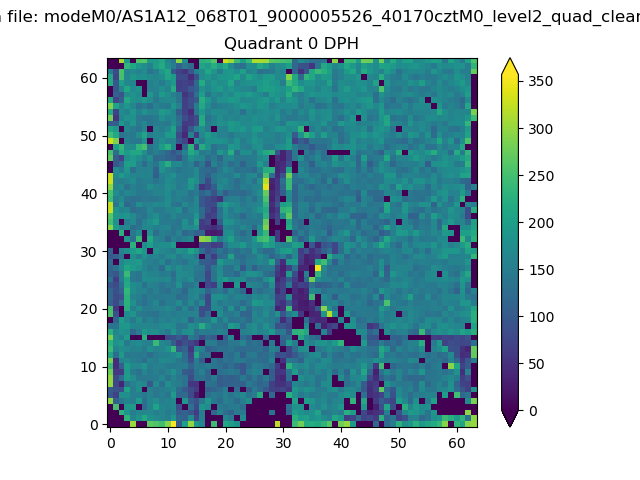 |
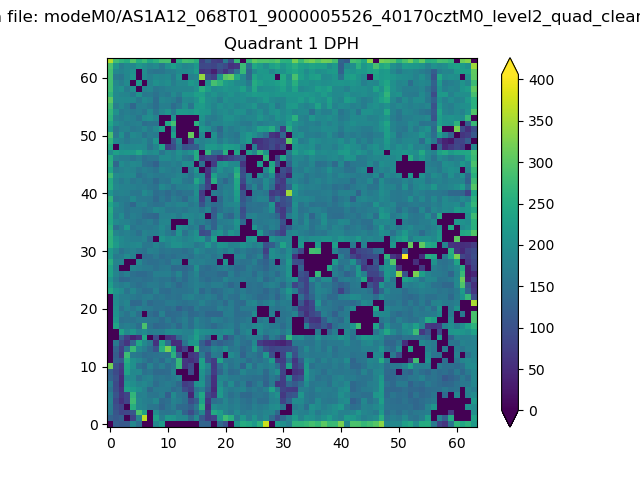 |
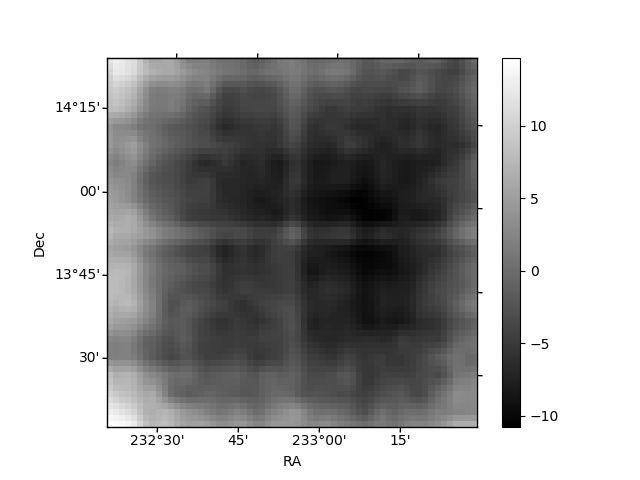
Quadrant B |
|---|---|---|---|
| Quadrant D | 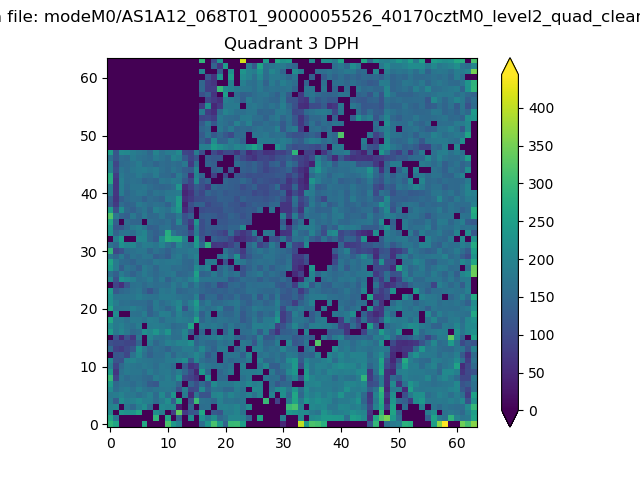 |
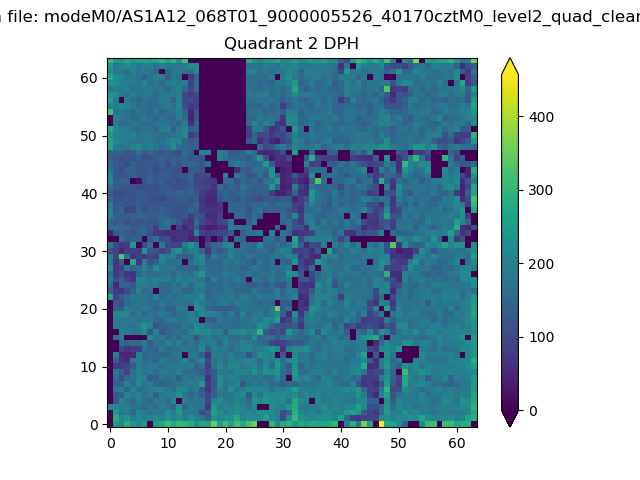 |
Quadrant C |
| Plot type | Count rate plots | Images |
|---|---|---|
| Comparison with Poisson distribution Blue bars denote a histogram of data divided into 1 sec bins. Red curve is a Poisson curve with rate = median count rate of data. |
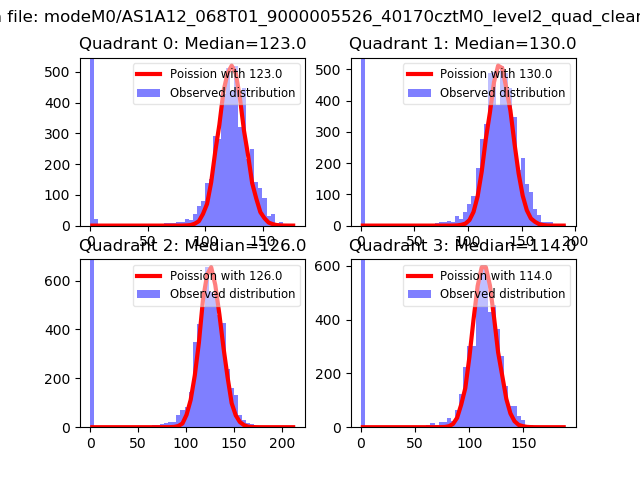 |
 |
| Quadrant-wise count rates Data is divided into 100 sec bins |
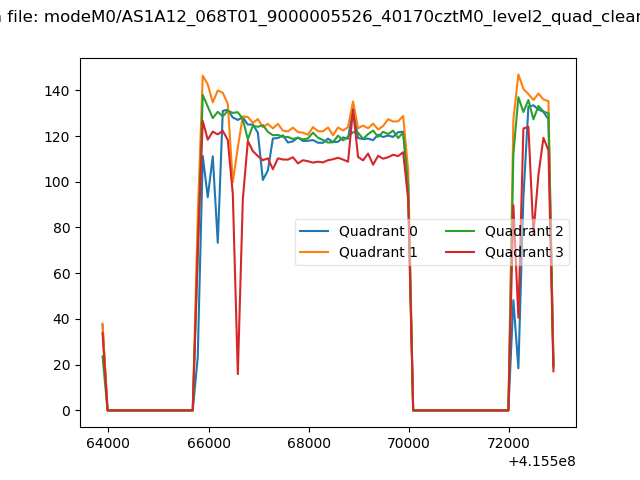 |
|
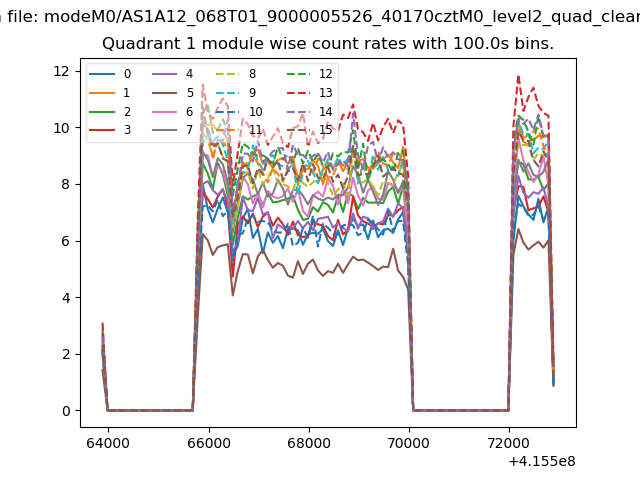
| Module-wise count rates for Quadrant A Data is divided into 100 sec bins |
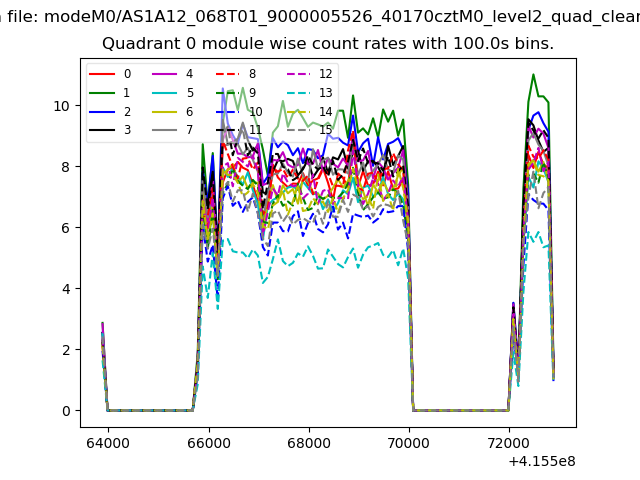 |
 |
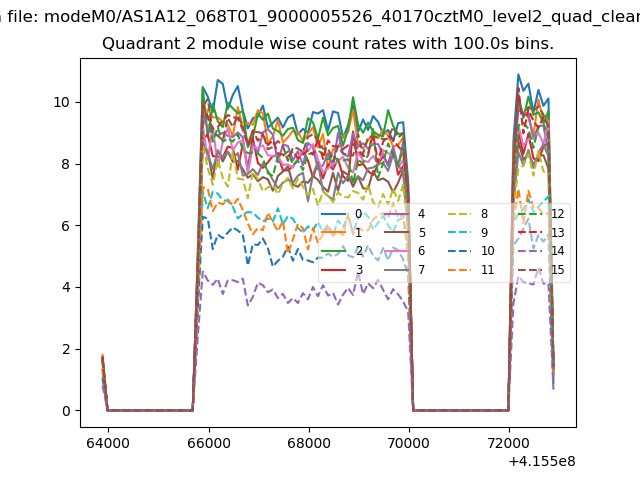
| Module-wise count rates for Quadrant B Data is divided into 100 sec bins |
 |
 |
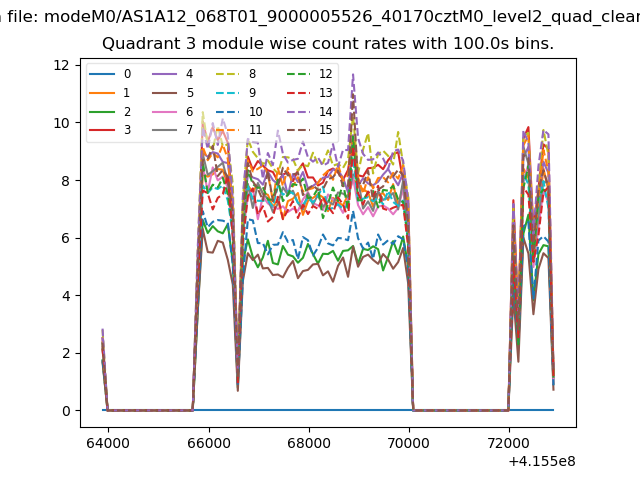
| Module-wise count rates for Quadrant C Data is divided into 100 sec bins |
 |
 |
| Module-wise count rates for Quadrant D Data is divided into 100 sec bins |
 |
 |
| Parameter | Plot |
|---|---|
| CZT HV Monitor | 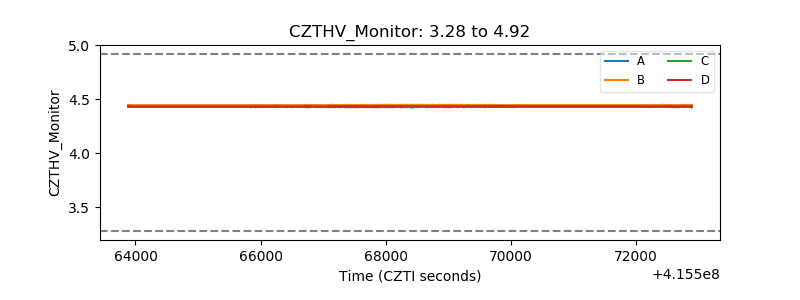 |
| D_VDD | 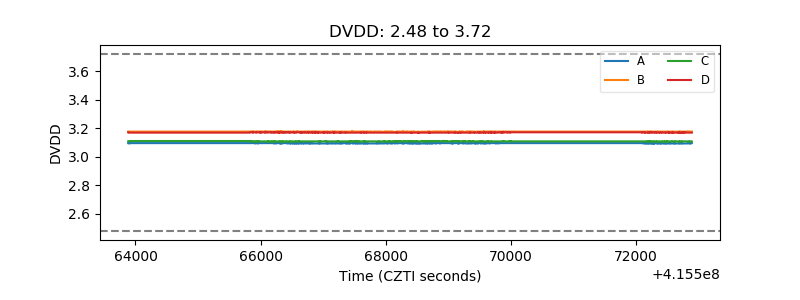 |
| Temperature 1 | 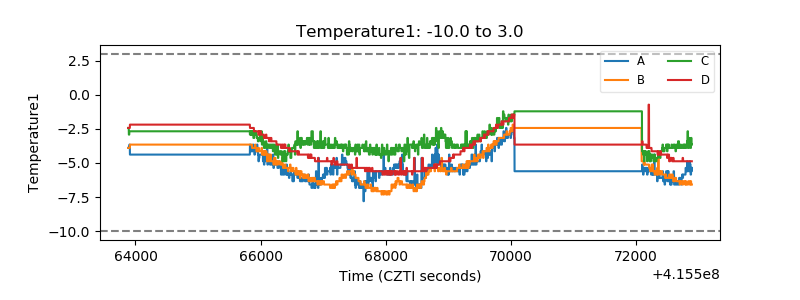 |
| Veto HV Monitor |  |
| Veto LLD | 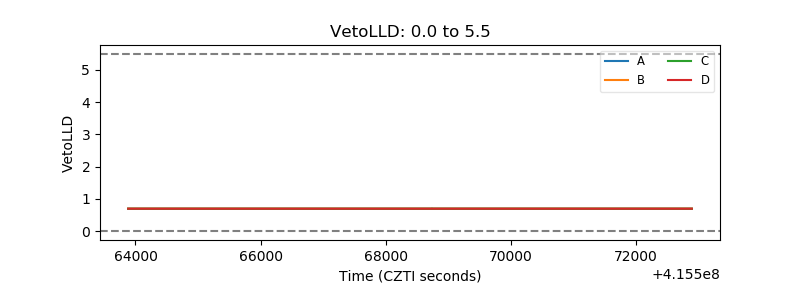 |
| Alpha Counter | 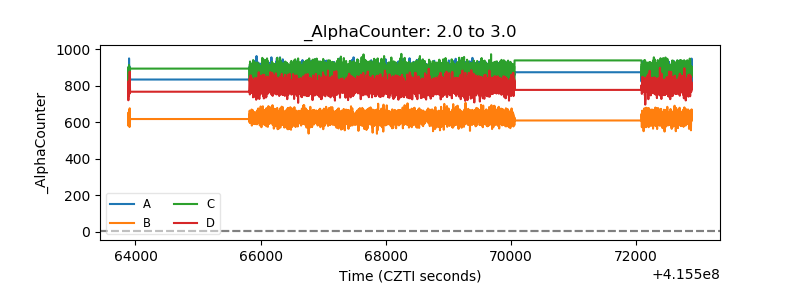 |
| _CPM_Rate | 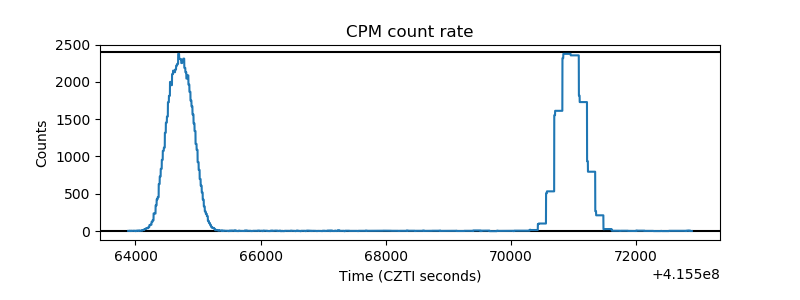 |
| CZT Counter | 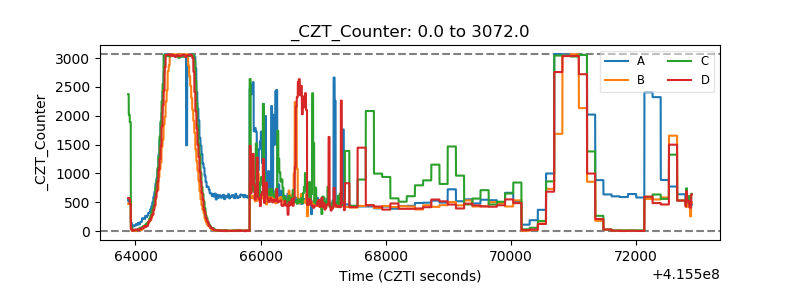 |
| +2.5 Volts monitor | 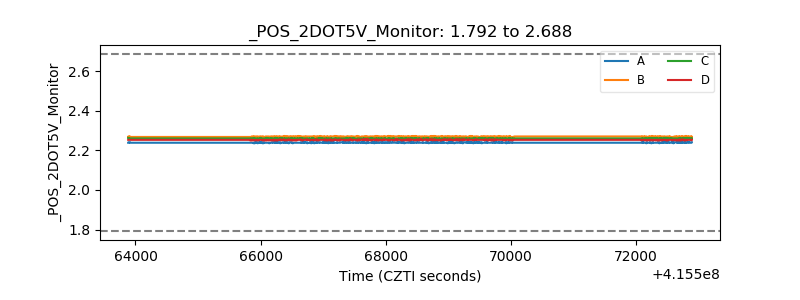 |
| +5 Volts monitor | 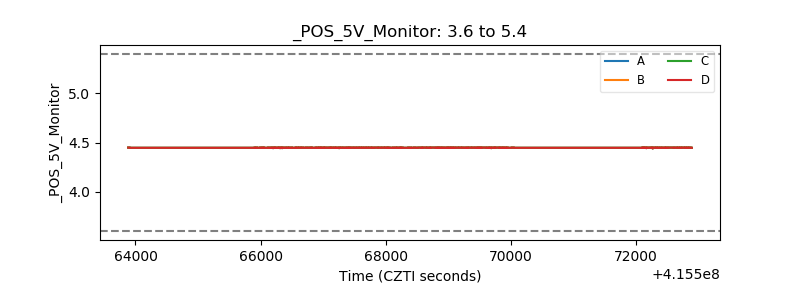 |
| _ROLL_ROT | 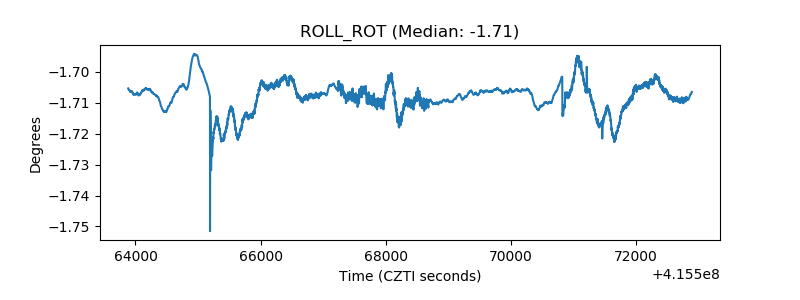 |
| _Roll_DEC | 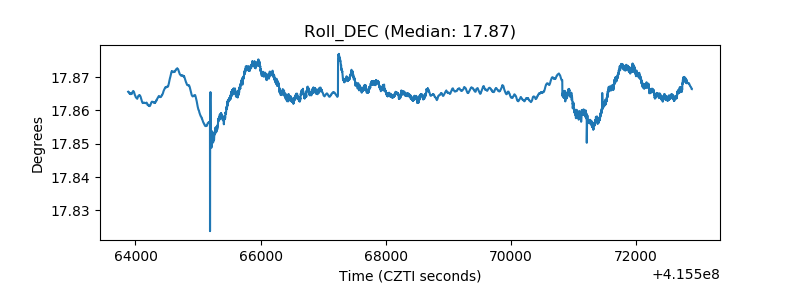 |
| _Roll_RA | 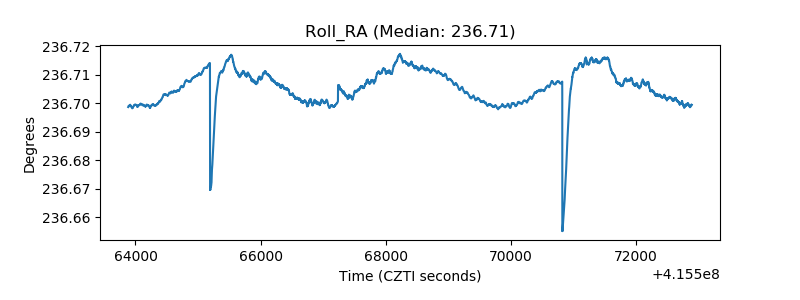 |
| Veto Counter | 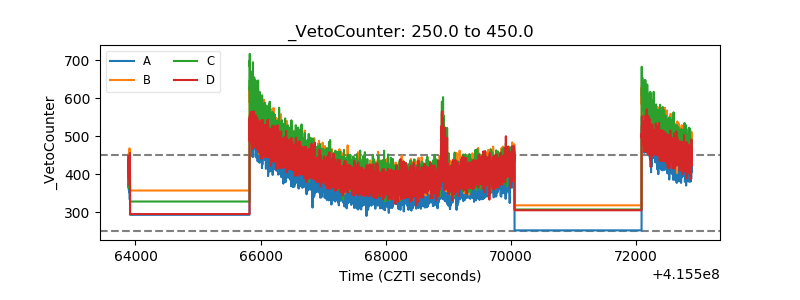 |