| Param | Original file | Final file |
|---|---|---|
| Filename | modeM0/AS1A12_068T01_9000005526_40171cztM0_level2.fits | modeM0/AS1A12_068T01_9000005526_40171cztM0_level2_quad_clean.evt |
| Size (bytes) | 365,820,480 | 73,730,880 |
| Size | 348.9 MB | 70.3 MB |
| Events in quadrant A | 2,721,601 | 498,927 |
| Events in quadrant B | 2,515,638 | 536,180 |
| Events in quadrant C | 5,332,598 | 439,256 |
| Events in quadrant D | 2,638,415 | 457,426 |
| Mode SS | |||
|---|---|---|---|
| Quadrant | BADHDUFLAG | Total packets | Discarded packets |
| A | 0 | 88 | 0 |
| B | 0 | 88 | 0 |
| C | 0 | 88 | 0 |
| D | 0 | 88 | 0 |
| Mode M9 | |||
|---|---|---|---|
| Quadrant | BADHDUFLAG | Total packets | Discarded packets |
| A | 0 | 36 | 0 |
| B | 0 | 36 | 0 |
| C | 0 | 36 | 0 |
| D | 0 | 37 | 0 |
| Mode M0 | |||
|---|---|---|---|
| Quadrant | BADHDUFLAG | Total packets | Discarded packets |
| A | 0 | 10678 | 2 |
| B | 0 | 10294 | 2 |
| C | 0 | 18768 | 2 |
| D | 0 | 10813 | 2 |
| Quadrant | Total seconds | Saturated seconds | Saturation percentage |
|---|---|---|---|
| A | 4273 | 201 | 4.703955% |
| B | 4273 | 154 | 3.604025% |
| C | 4273 | 909 | 21.273110% |
| D | 4273 | 220 | 5.148608% |
Noise dominated data is calculated using 1-second bins in cleaned event files. If a bin has >2000 counts, and if more than 50% of those come from <1% of pixels, then it is considered to be noise-dominated and hence unusable.
| Quadrant | # 1 sec bins | Bins with >0 counts | Bins with >2000 counts | High rate bins dominated by noise | Noise dominated (total time) | Noise dominated (detector-on time) | Marked lightcurve |
|---|---|---|---|---|---|---|---|
| A | 6395 | 4274 | 176 | 176 | 2.75% | 4.12% | 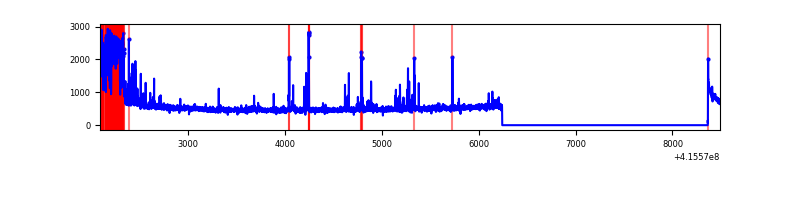 |
| B | 6395 | 4274 | 134 | 134 | 2.10% | 3.14% | 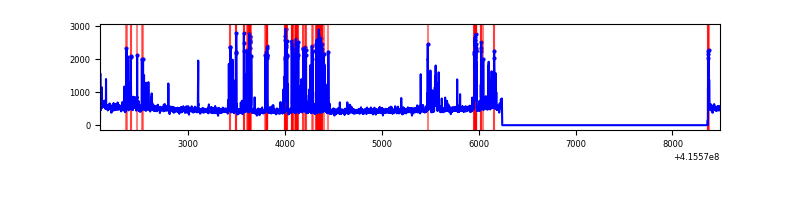 |
| C | 6395 | 4274 | 988 | 988 | 15.45% | 23.12% | 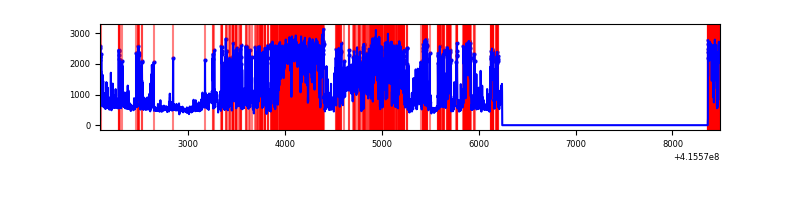 |
| D | 6395 | 4274 | 227 | 227 | 3.55% | 5.31% | 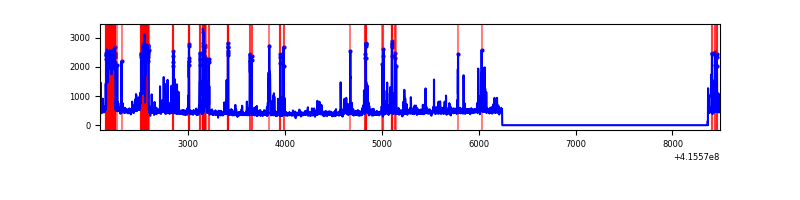 |
Top three noisy pixels from each quadrant. If the there are fewer than three noisy pixels in the level2.evt file, extra rows are filled as -1
| Pixel properties | Quadrant properties | ||||||
|---|---|---|---|---|---|---|---|
| Quadrant | DetID | PixID | Counts | Sigma | Mean | Median | Sigma |
| A | 13 | 248 | 487675 | 4973.03 | 478 | 470 | 98.0 |
| A | 10 | 83 | 326171 | 3324.52 | 478 | 470 | 98.0 |
| A | 7 | 3 | 45140 | 455.96 | 478 | 470 | 98.0 |
| B | 5 | 172 | 564484 | 6004.77 | 487 | 476 | 93.9 |
| B | 0 | 245 | 25606 | 267.55 | 487 | 476 | 93.9 |
| B | 12 | 111 | 11580 | 118.22 | 487 | 476 | 93.9 |
| C | 9 | 187 | 3362538 | 31893.83 | 451 | 455 | 105.4 |
| C | 15 | 214 | 162757 | 1539.65 | 451 | 455 | 105.4 |
| C | 0 | 10 | 32564 | 304.6 | 451 | 455 | 105.4 |
| D | 13 | 249 | 507054 | 4307.58 | 476 | 462 | 117.6 |
| D | 12 | 227 | 112798 | 955.2 | 476 | 462 | 117.6 |
| D | 9 | 19 | 84269 | 712.62 | 476 | 462 | 117.6 |
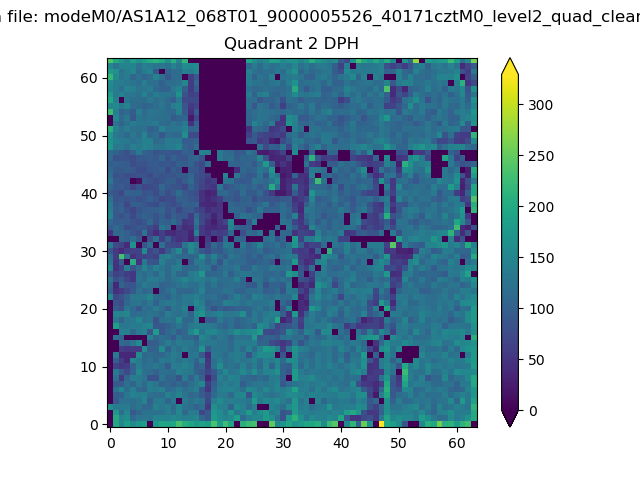
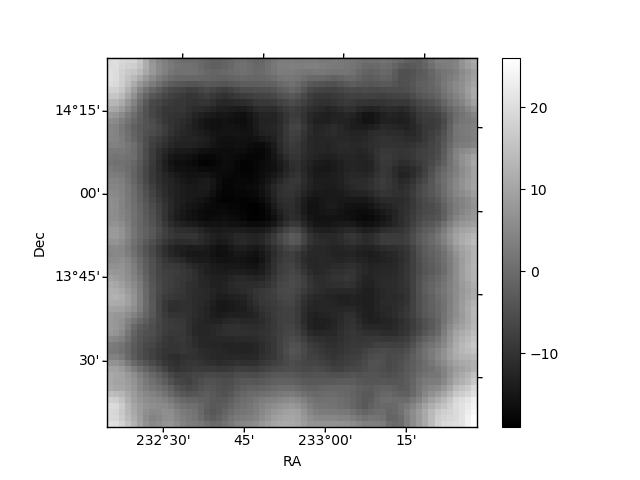
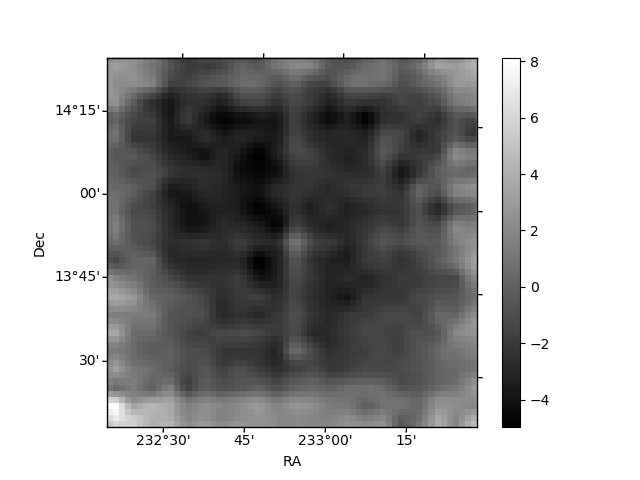
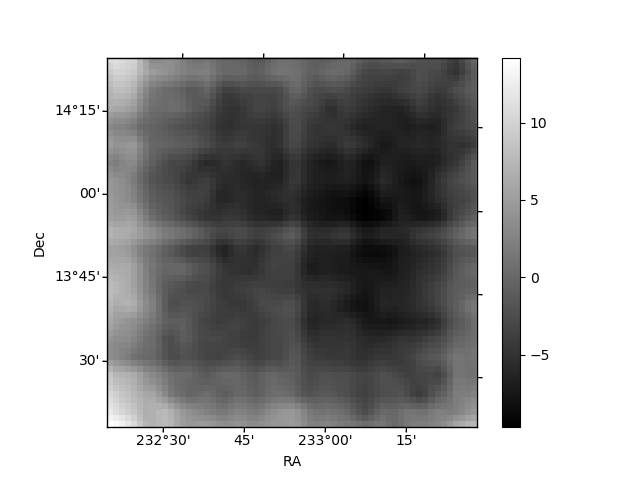
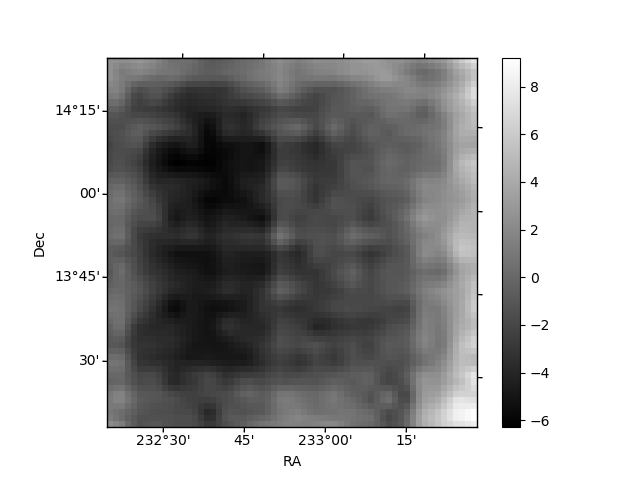
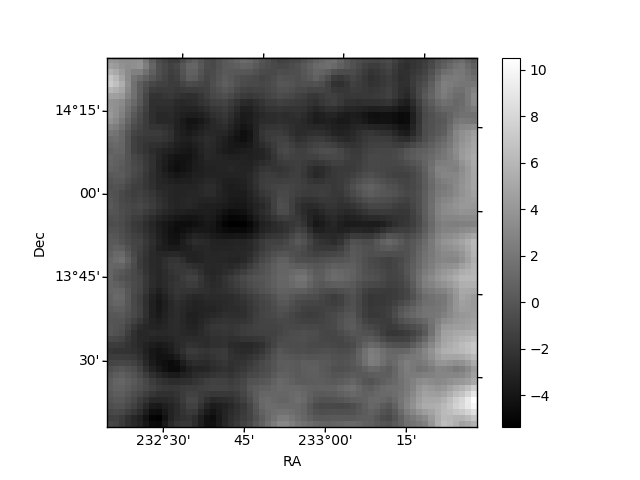
Histogram calculated using DETX and DETY for each event in the final _common_clean file
| Quadrant A | 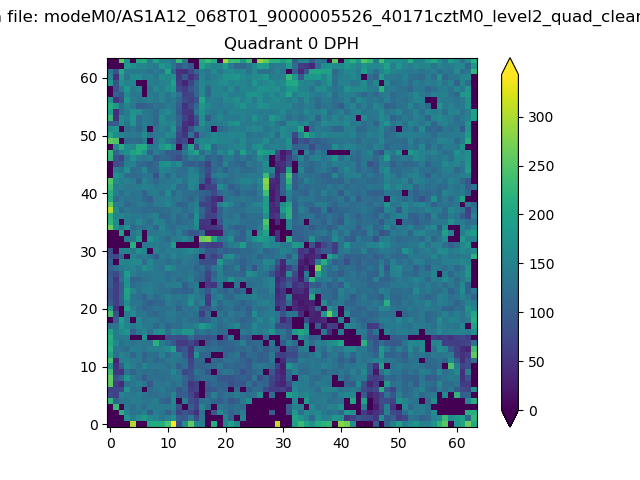 |
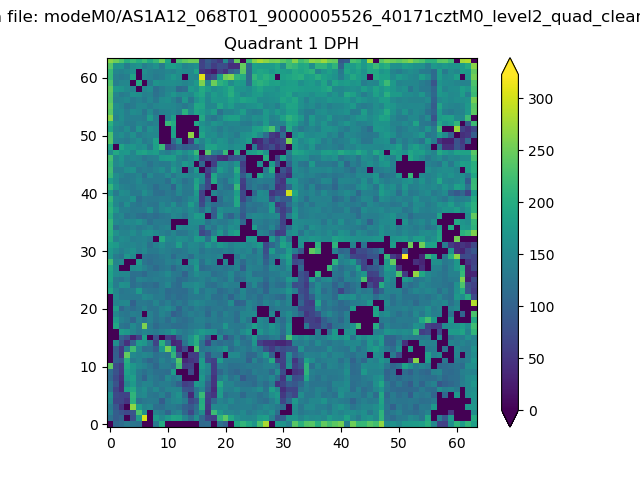 |
Quadrant B |
|---|---|---|---|
| Quadrant D | 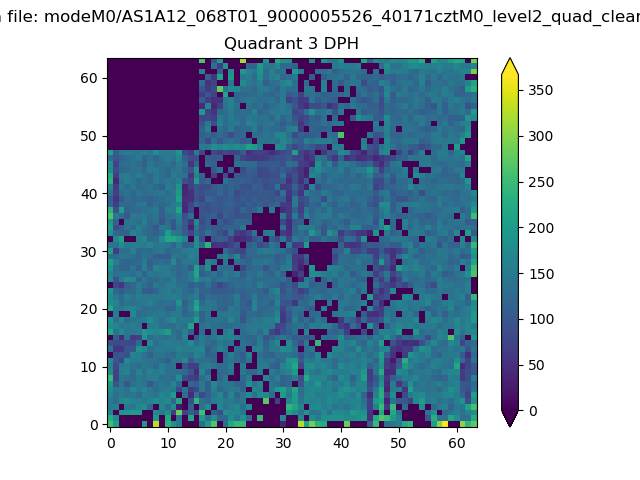 |
 |
Quadrant C |
| Plot type | Count rate plots | Images |
|---|---|---|
| Comparison with Poisson distribution Blue bars denote a histogram of data divided into 1 sec bins. Red curve is a Poisson curve with rate = median count rate of data. |
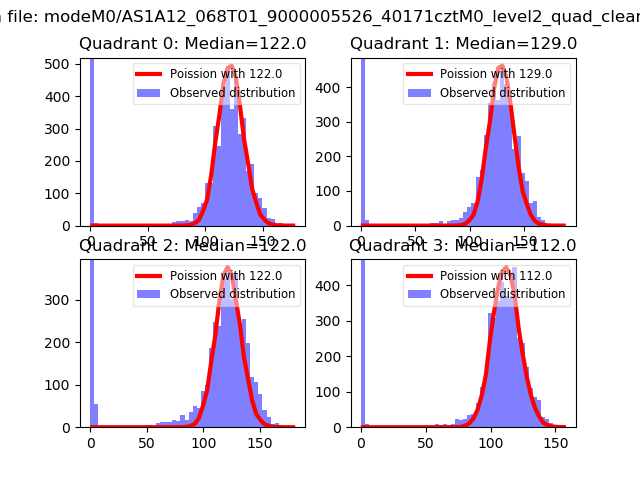 |
 |
| Quadrant-wise count rates Data is divided into 100 sec bins |
 |
|
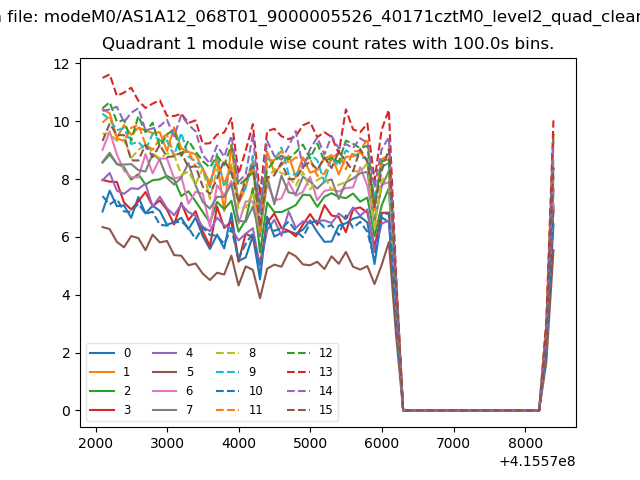
| Module-wise count rates for Quadrant A Data is divided into 100 sec bins |
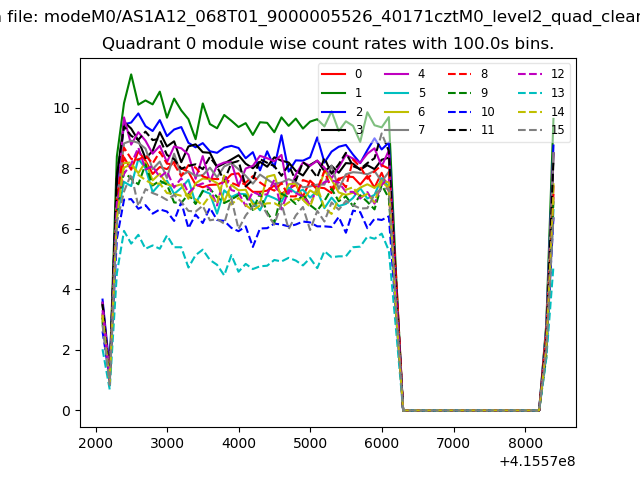 |
 |
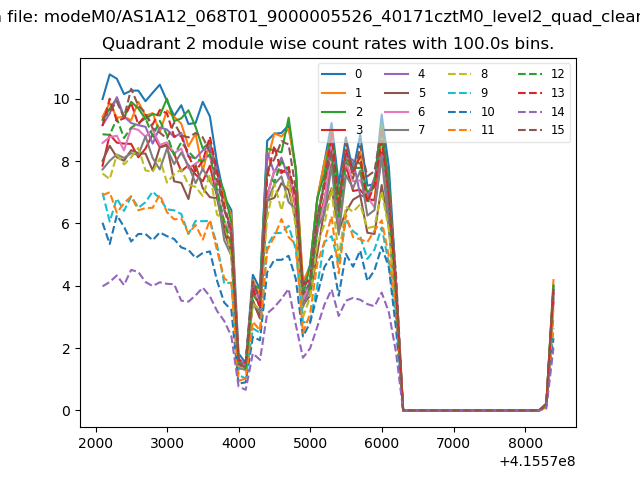
| Module-wise count rates for Quadrant B Data is divided into 100 sec bins |
 |
 |
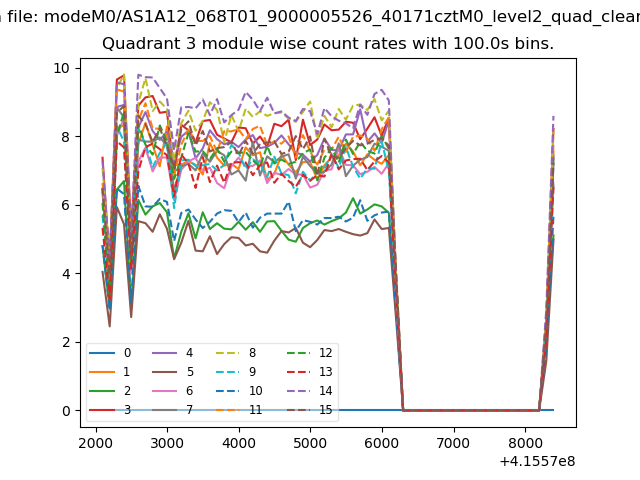
| Module-wise count rates for Quadrant C Data is divided into 100 sec bins |
 |
 |
| Module-wise count rates for Quadrant D Data is divided into 100 sec bins |
 |
 |
| Parameter | Plot |
|---|---|
| CZT HV Monitor | 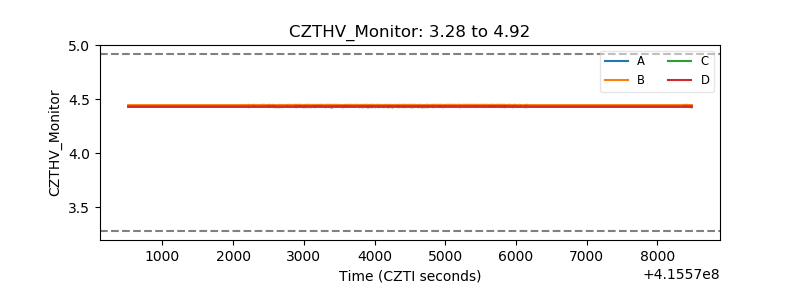 |
| D_VDD | 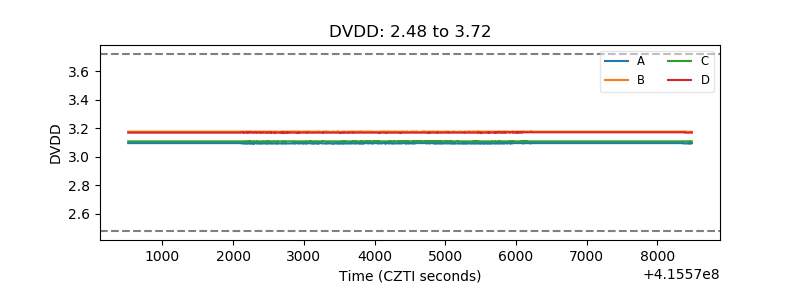 |
| Temperature 1 | 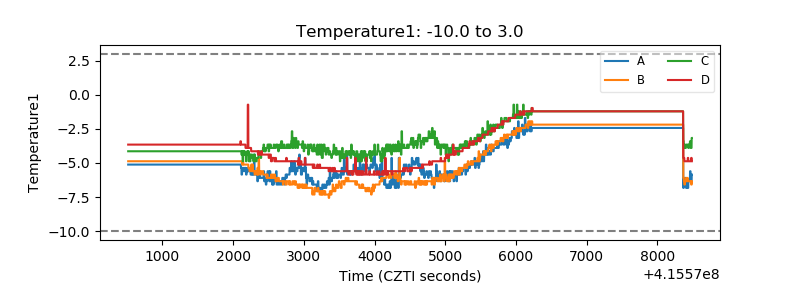 |
| Veto HV Monitor | 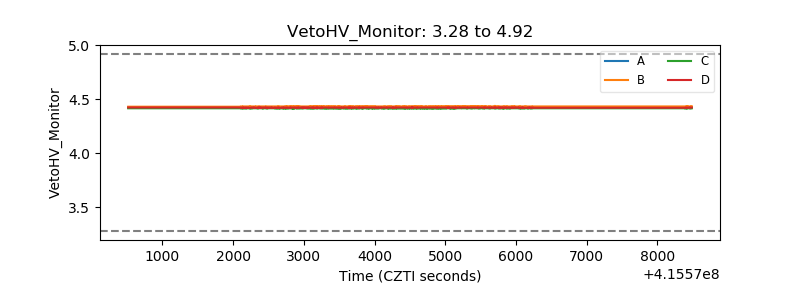 |
| Veto LLD | 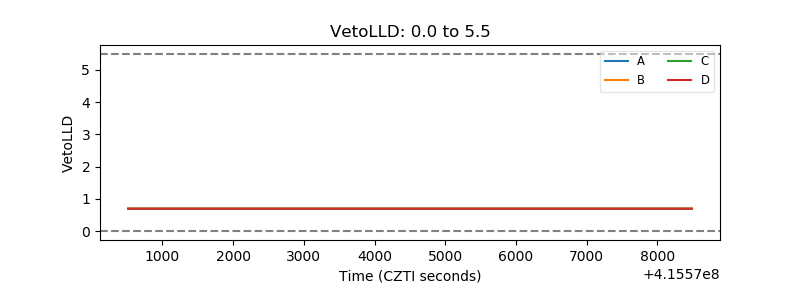 |
| Alpha Counter | 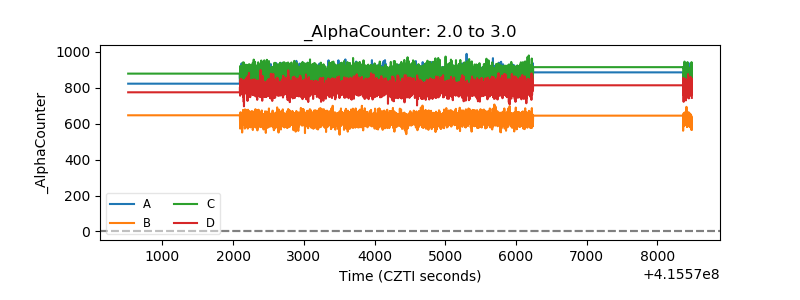 |
| _CPM_Rate | 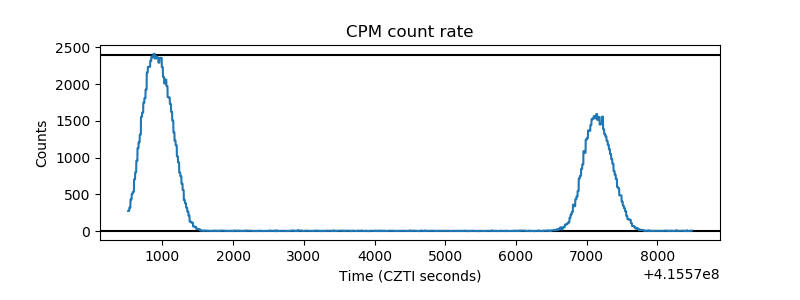 |
| CZT Counter | 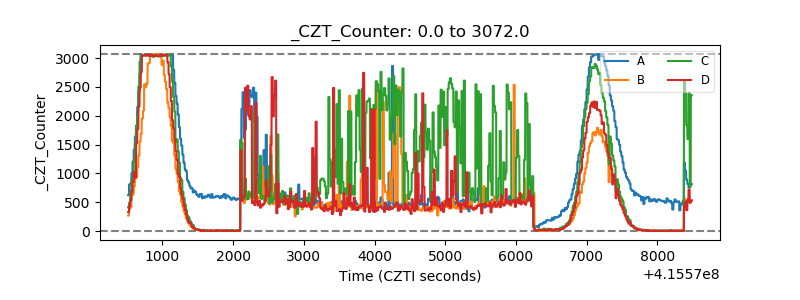 |
| +2.5 Volts monitor | 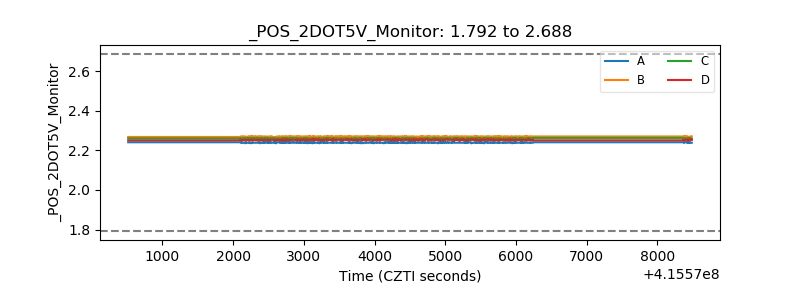 |
| +5 Volts monitor | 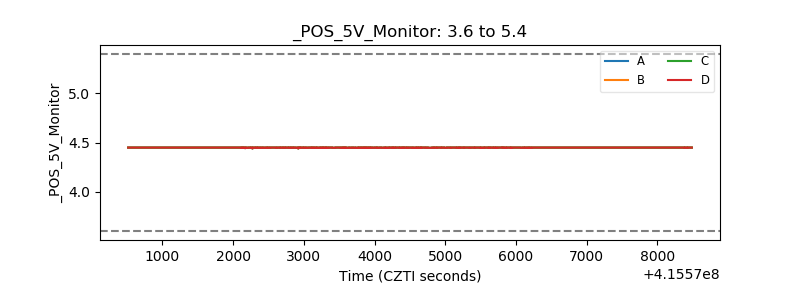 |
| _ROLL_ROT | 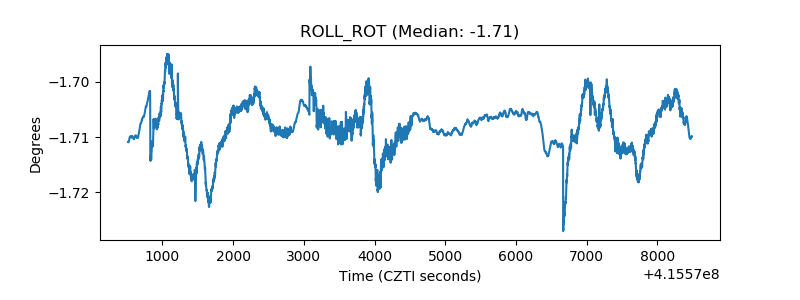 |
| _Roll_DEC | 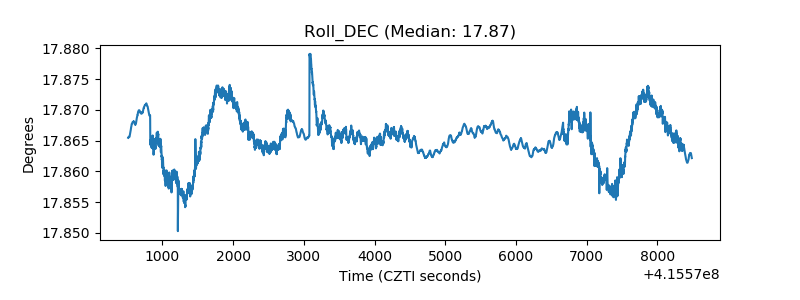 |
| _Roll_RA | 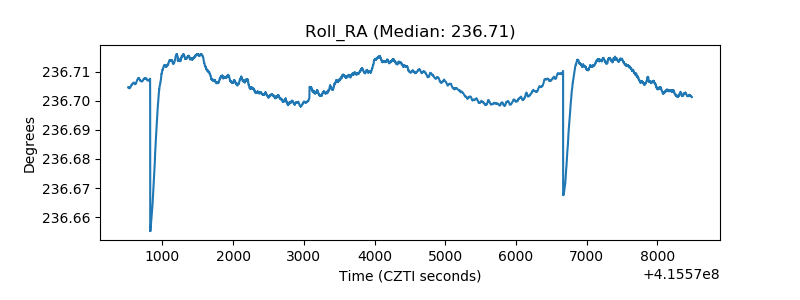 |
| Veto Counter | 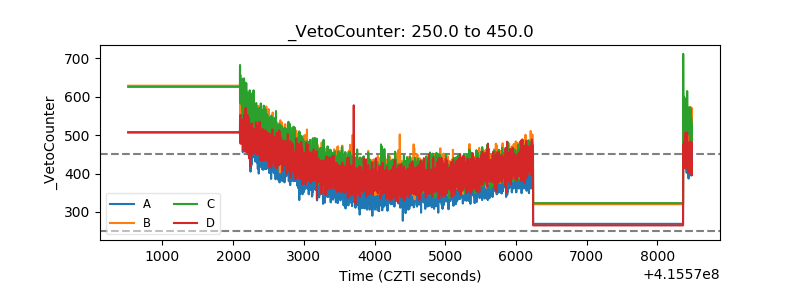 |