| Param | Original file | Final file |
|---|---|---|
| Filename | modeM0/AS1A12_068T01_9000005526_40172cztM0_level2.fits | modeM0/AS1A12_068T01_9000005526_40172cztM0_level2_quad_clean.evt |
| Size (bytes) | 14,878,080 | 1,212,480 |
| Size | 14.2 MB | 1.2 MB |
| Events in quadrant A | 115,195 | 6,333 |
| Events in quadrant B | 73,100 | 7,555 |
| Events in quadrant C | 258,280 | 595 |
| Events in quadrant D | 90,729 | 5,466 |
| Mode SS | |||
|---|---|---|---|
| Quadrant | BADHDUFLAG | Total packets | Discarded packets |
| A | 0 | 2 | 0 |
| B | 0 | 2 | 0 |
| C | 0 | 2 | 0 |
| D | 0 | 2 | 0 |
| Mode M9 | |||
|---|---|---|---|
| Quadrant | BADHDUFLAG | Total packets | Discarded packets |
| A | 0 | 12 | 0 |
| B | 0 | 12 | 0 |
| C | 0 | 12 | 0 |
| D | 0 | 13 | 0 |
| Mode M0 | |||
|---|---|---|---|
| Quadrant | BADHDUFLAG | Total packets | Discarded packets |
| A | 0 | 431 | 1 |
| B | 0 | 283 | 1 |
| C | 0 | 854 | 1 |
| D | 0 | 348 | 1 |
| Quadrant | Total seconds | Saturated seconds | Saturation percentage |
|---|---|---|---|
| A | 125 | 3 | 2.400000% |
| B | 125 | 6 | 4.800000% |
| C | 125 | 90 | 72.000000% |
| D | 125 | 8 | 6.400000% |
Noise dominated data is calculated using 1-second bins in cleaned event files. If a bin has >2000 counts, and if more than 50% of those come from <1% of pixels, then it is considered to be noise-dominated and hence unusable.
| Quadrant | # 1 sec bins | Bins with >0 counts | Bins with >2000 counts | High rate bins dominated by noise | Noise dominated (total time) | Noise dominated (detector-on time) | Marked lightcurve |
|---|---|---|---|---|---|---|---|
| A | 125 | 125 | 1 | 1 | 0.80% | 0.80% | 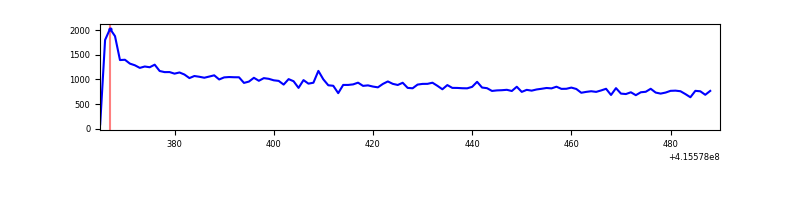 |
| B | 125 | 125 | 4 | 4 | 3.20% | 3.20% | 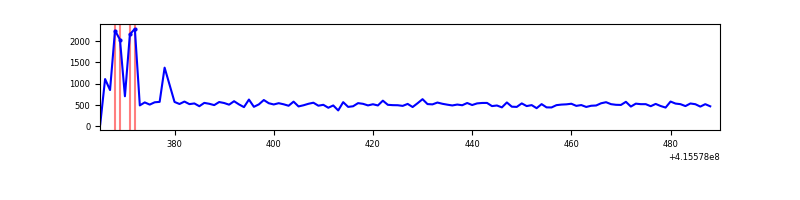 |
| C | 125 | 125 | 88 | 88 | 70.40% | 70.40% | 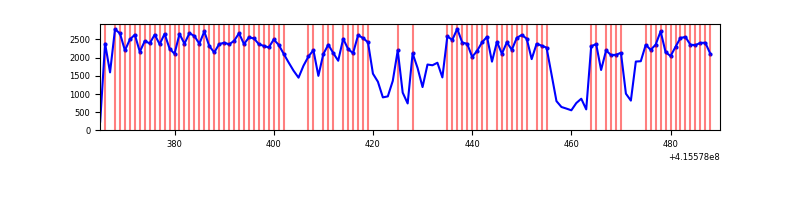 |
| D | 125 | 125 | 7 | 7 | 5.60% | 5.60% | 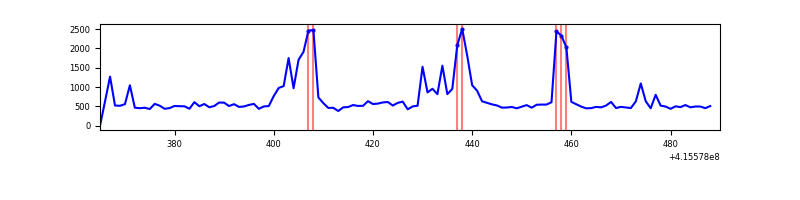 |
Top three noisy pixels from each quadrant. If the there are fewer than three noisy pixels in the level2.evt file, extra rows are filled as -1
| Pixel properties | Quadrant properties | ||||||
|---|---|---|---|---|---|---|---|
| Quadrant | DetID | PixID | Counts | Sigma | Mean | Median | Sigma |
| A | 10 | 83 | 53593 | 10705.91 | 15 | 14 | 5.0 |
| A | 10 | 67 | 1362 | 269.35 | 15 | 14 | 5.0 |
| A | 2 | 79 | 514 | 99.91 | 15 | 14 | 5.0 |
| B | 5 | 172 | 10682 | 2149.69 | 15 | 15 | 5.0 |
| B | 4 | 171 | 704 | 138.85 | 15 | 15 | 5.0 |
| B | 0 | 245 | 454 | 88.47 | 15 | 15 | 5.0 |
| C | 9 | 187 | 194942 | 49204.15 | 10 | 10 | 4.0 |
| C | 0 | 10 | 15412 | 3887.73 | 10 | 10 | 4.0 |
| C | 15 | 214 | 4773 | 1202.26 | 10 | 10 | 4.0 |
| D | 13 | 249 | 22806 | 4319.24 | 14 | 14 | 5.3 |
| D | 12 | 227 | 7260 | 1373.17 | 14 | 14 | 5.3 |
| D | 3 | 238 | 1782 | 335.05 | 14 | 14 | 5.3 |
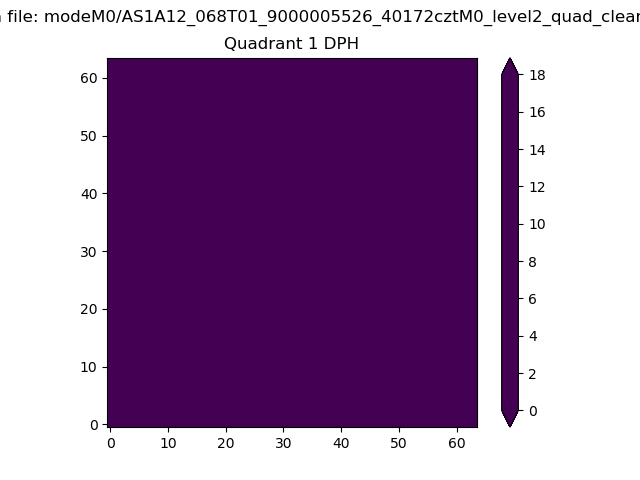
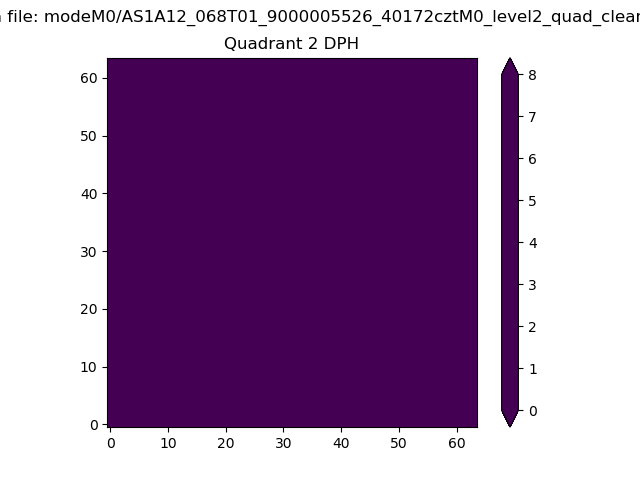
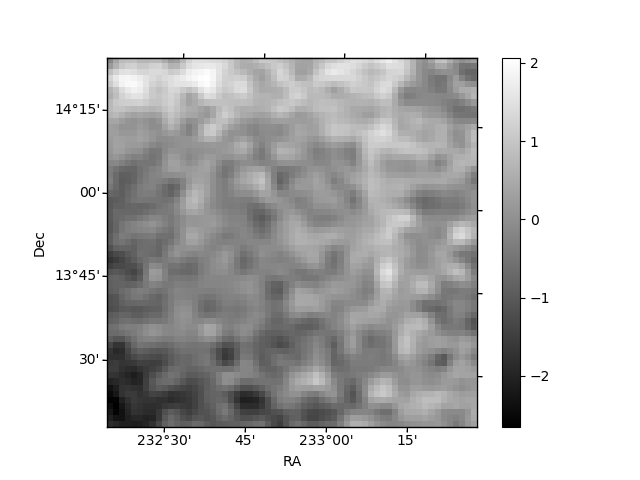
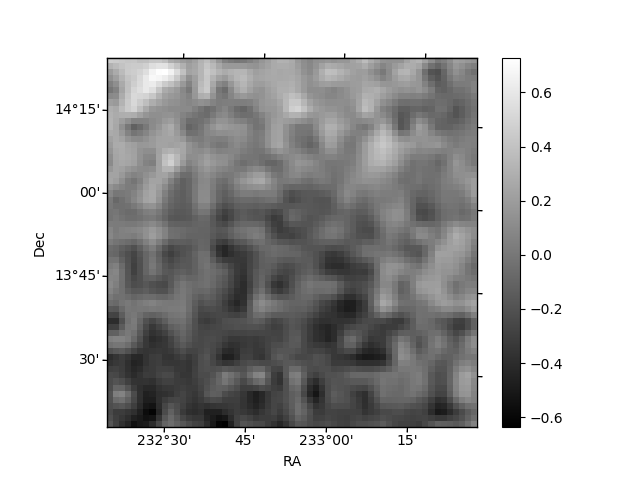
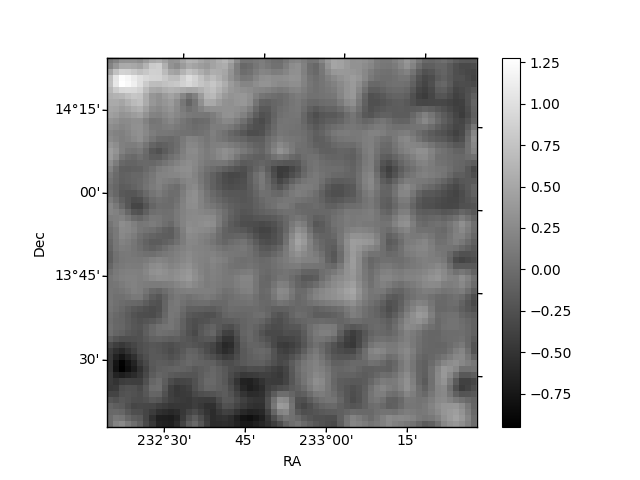
Histogram calculated using DETX and DETY for each event in the final _common_clean file
| Quadrant A |  |
 |
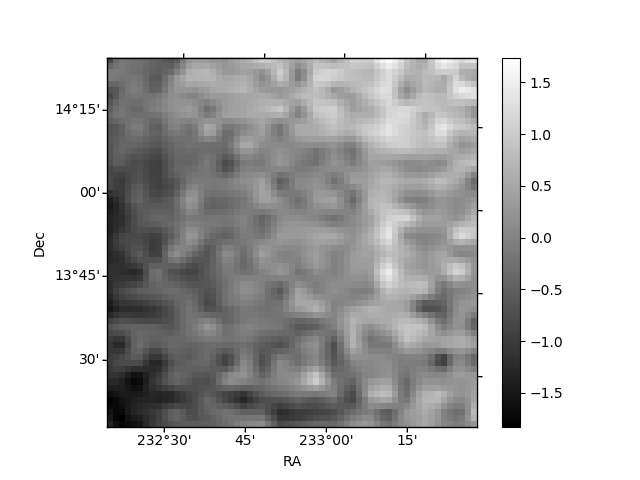
Quadrant B |
|---|---|---|---|
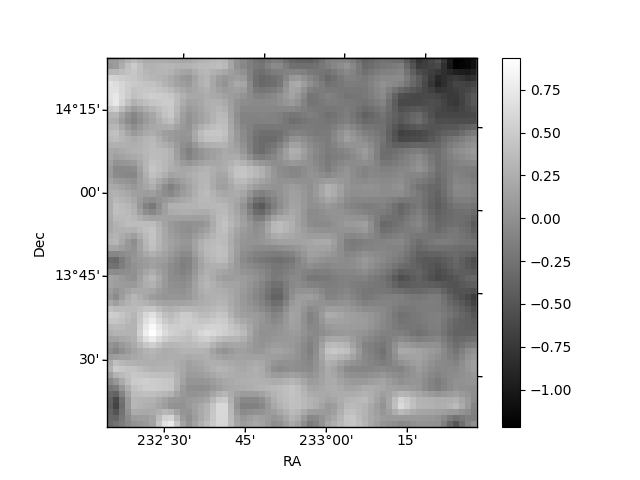
| Quadrant D | 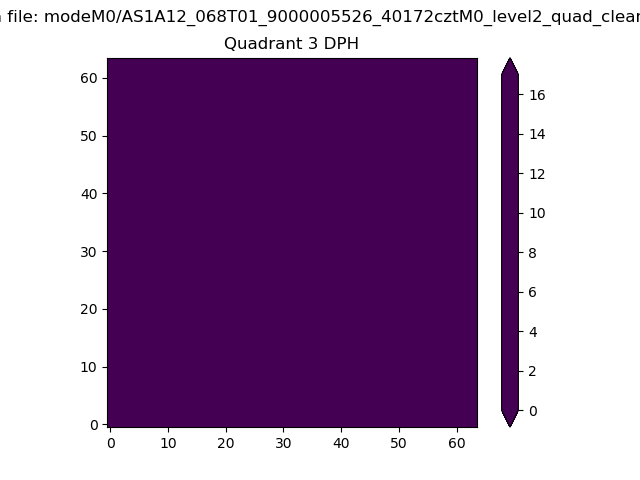 |
 |
Quadrant C |
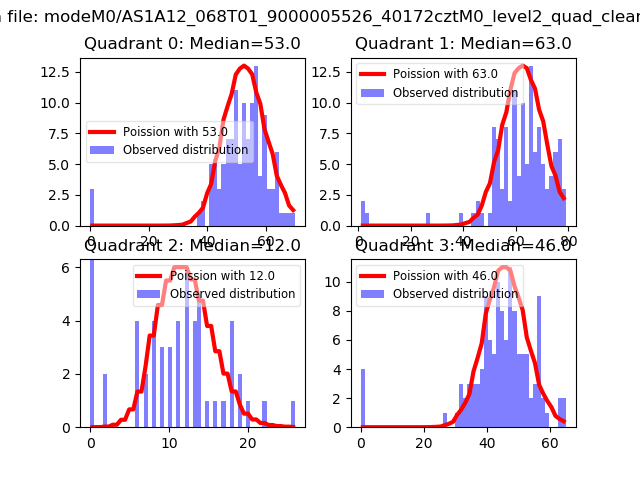
| Plot type | Count rate plots | Images |
|---|---|---|
| Comparison with Poisson distribution Blue bars denote a histogram of data divided into 1 sec bins. Red curve is a Poisson curve with rate = median count rate of data. |
 |
 |
| Quadrant-wise count rates Data is divided into 100 sec bins |
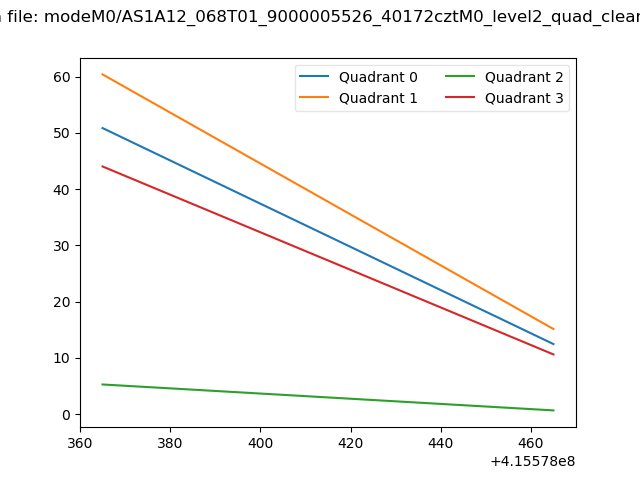 |
|
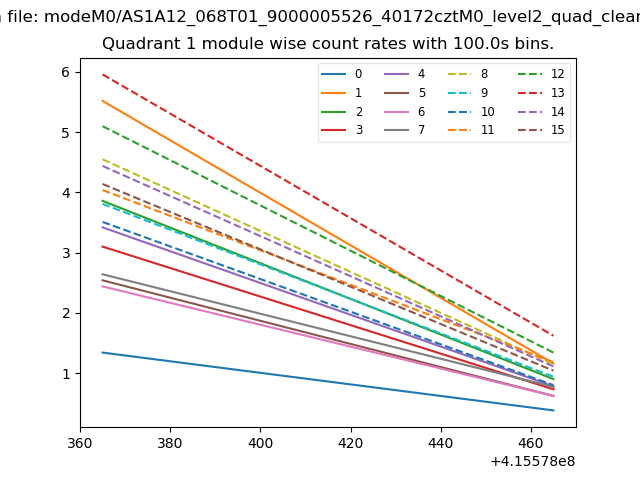
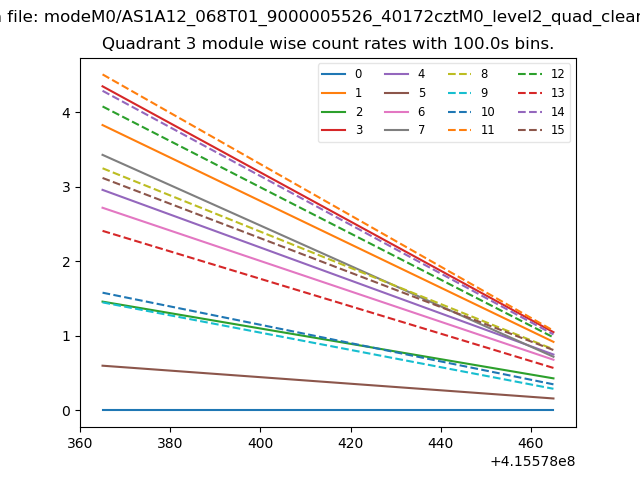
| Module-wise count rates for Quadrant A Data is divided into 100 sec bins |
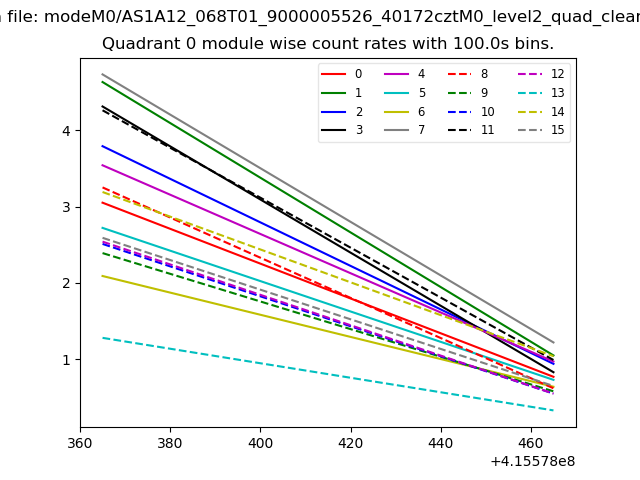 |
 |
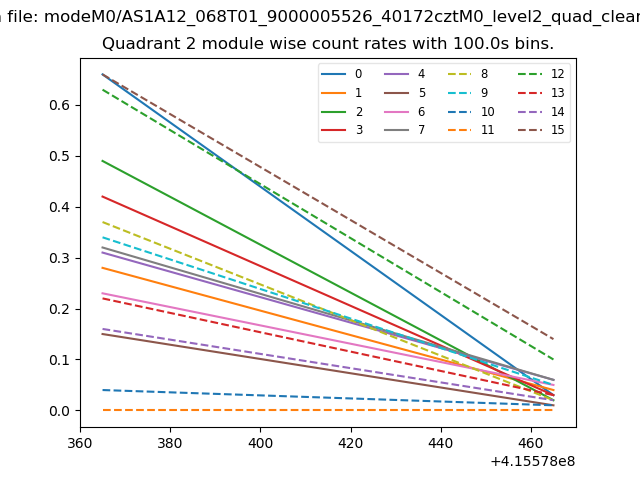
| Module-wise count rates for Quadrant B Data is divided into 100 sec bins |
 |
 |
| Module-wise count rates for Quadrant C Data is divided into 100 sec bins |
 |
 |
| Module-wise count rates for Quadrant D Data is divided into 100 sec bins |
 |
 |
| Parameter | Plot |
|---|---|
| CZT HV Monitor | 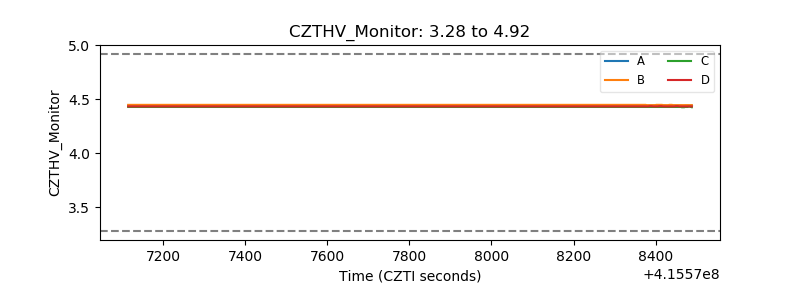 |
| D_VDD | 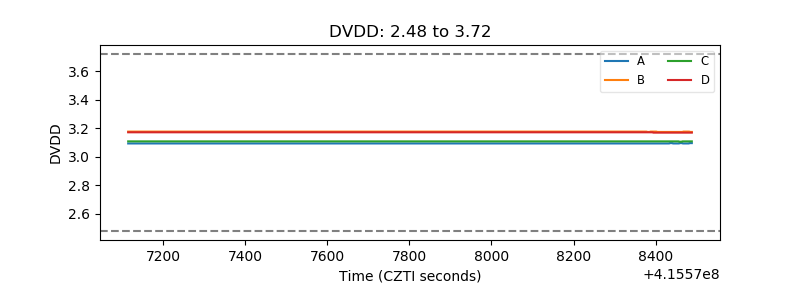 |
| Temperature 1 | 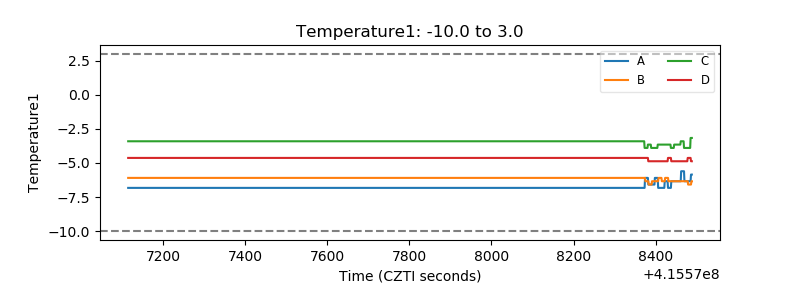 |
| Veto HV Monitor |  |
| Veto LLD | 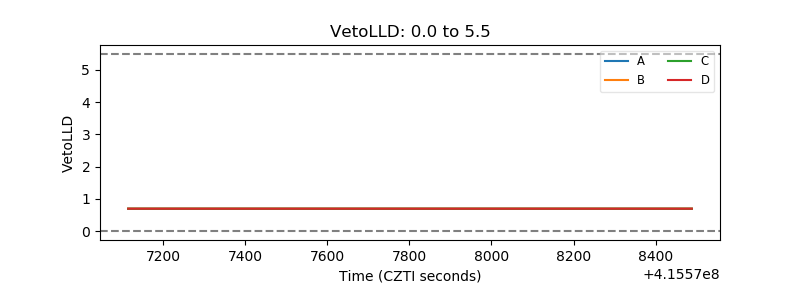 |
| Alpha Counter | 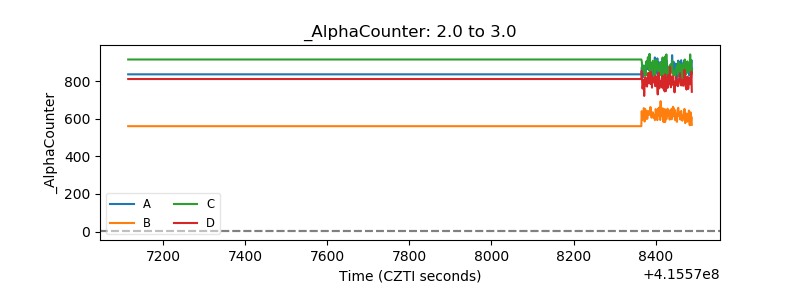 |
| _CPM_Rate | 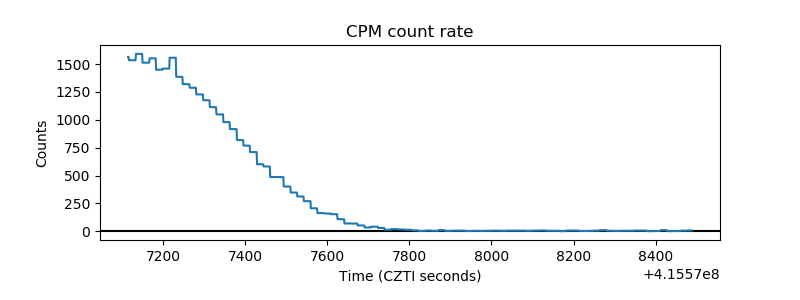 |
| CZT Counter | 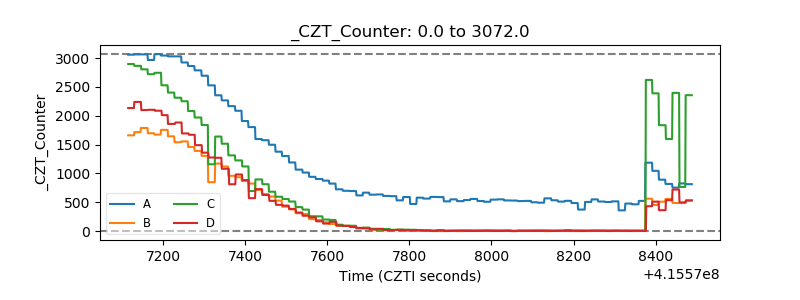 |
| +2.5 Volts monitor | 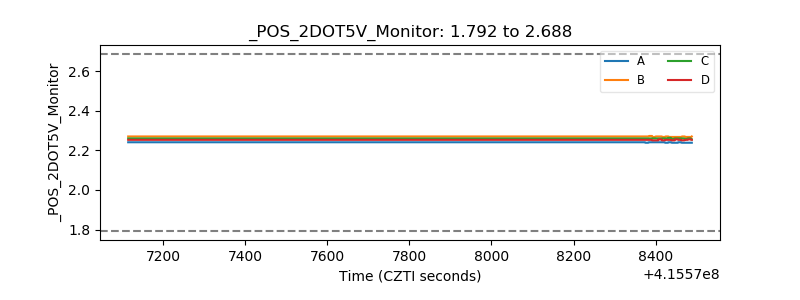 |
| +5 Volts monitor | 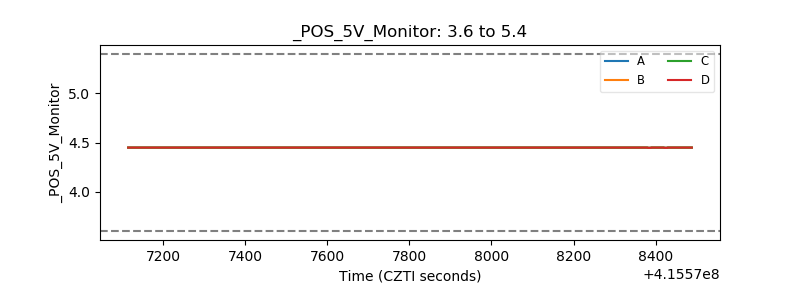 |
| _ROLL_ROT | 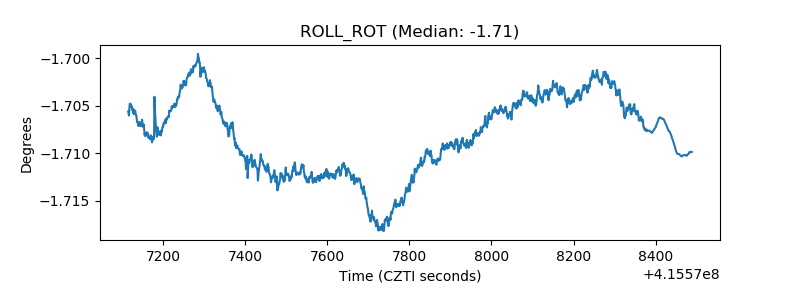 |
| _Roll_DEC | 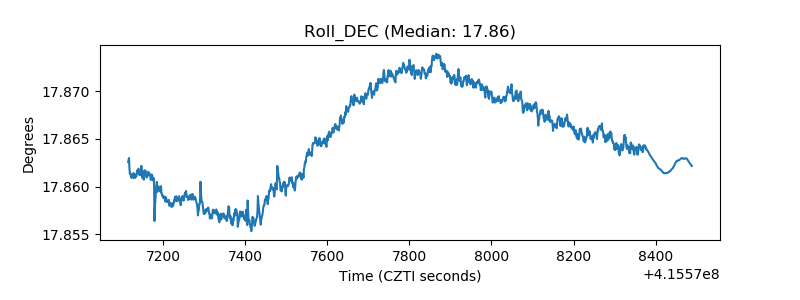 |
| _Roll_RA | 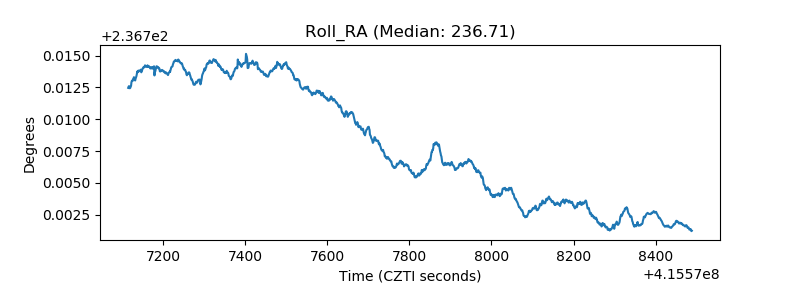 |
| Veto Counter | 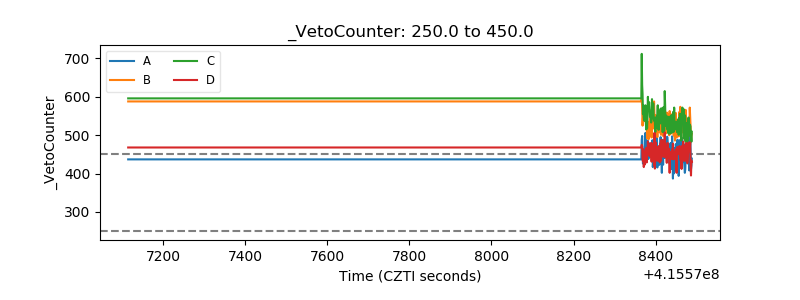 |