| Param | Original file | Final file |
|---|---|---|
| Filename | modeM0/AS1A12_053T01_9000005530cztM0_level2.fits | modeM0/AS1A12_053T01_9000005530cztM0_level2_quad_clean.evt |
| Size (bytes) | 600,828,480 | 664,058,880 |
| Size | 573.0 MB | 633.3 MB |
| Events in quadrant A | 3,597,684 | 4,073,368 |
| Events in quadrant B | 3,485,620 | 4,142,891 |
| Events in quadrant C | 3,569,090 | 3,992,506 |
| Events in quadrant D | 2,950,456 | 3,312,530 |
| Mode M0 | |||
|---|---|---|---|
| Quadrant | BADHDUFLAG | Total packets | Discarded packets |
| A | 0 | 154266 | 0 |
| B | 0 | 144925 | 0 |
| C | 0 | 146138 | 0 |
| D | 0 | 198847 | 0 |
| Mode SS | |||
|---|---|---|---|
| Quadrant | BADHDUFLAG | Total packets | Discarded packets |
| A | 0 | 1364 | 0 |
| B | 0 | 1364 | 0 |
| C | 0 | 1364 | 0 |
| D | 0 | 1364 | 0 |
| Mode M9 | |||
|---|---|---|---|
| Quadrant | BADHDUFLAG | Total packets | Discarded packets |
| A | 0 | 241 | 0 |
| B | 0 | 241 | 0 |
| C | 0 | 241 | 0 |
| D | 0 | 241 | 0 |
| Quadrant | Total seconds | Saturated seconds | Saturation percentage |
|---|---|---|---|
| A | 66949 | 1104 | 1.649016% |
| B | 66949 | 596 | 0.890230% |
| C | 66949 | 318 | 0.474988% |
| D | 66949 | 5627 | 8.404905% |
Noise dominated data is calculated using 1-second bins in cleaned event files. If a bin has >2000 counts, and if more than 50% of those come from <1% of pixels, then it is considered to be noise-dominated and hence unusable.
| Quadrant | # 1 sec bins | Bins with >0 counts | Bins with >2000 counts | High rate bins dominated by noise | Noise dominated (total time) | Noise dominated (detector-on time) | Marked lightcurve |
|---|---|---|---|---|---|---|---|
| A | 90876 | 66946 | 0 | 0 | 0.00% | 0.00% | 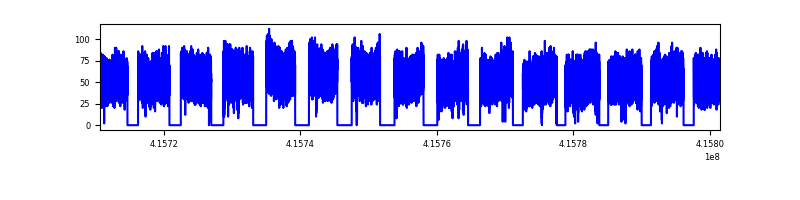 |
| B | 90876 | 66938 | 0 | 0 | 0.00% | 0.00% |  |
| C | 90876 | 66949 | 0 | 0 | 0.00% | 0.00% | 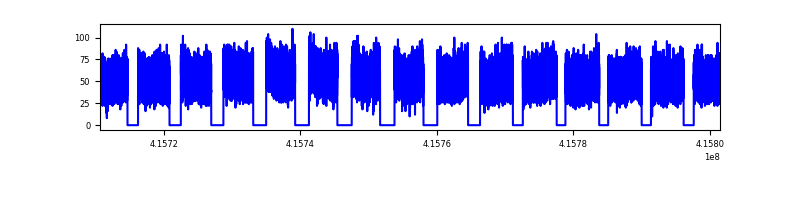 |
| D | 90876 | 66414 | 0 | 0 | 0.00% | 0.00% |  |
Top three noisy pixels from each quadrant. If the there are fewer than three noisy pixels in the level2.evt file, extra rows are filled as -1
| Pixel properties | Quadrant properties | ||||||
|---|---|---|---|---|---|---|---|
| Quadrant | DetID | PixID | Counts | Sigma | Mean | Median | Sigma |
| A | 9 | 19 | 2980 | 9.05 | 937 | 878 | 232.4 |
| A | 7 | 110 | 2918 | 8.78 | 937 | 878 | 232.4 |
| A | 0 | 29 | 2897 | 8.69 | 937 | 878 | 232.4 |
| B | 2 | 9 | 2934 | 11.36 | 922 | 878 | 181.0 |
| B | 3 | 80 | 2643 | 9.75 | 922 | 878 | 181.0 |
| B | 5 | 128 | 2411 | 8.47 | 922 | 878 | 181.0 |
| C | 1 | 81 | 2974 | 8.59 | 942 | 881 | 243.6 |
| C | 1 | 80 | 2963 | 8.55 | 942 | 881 | 243.6 |
| C | 3 | 202 | 2869 | 8.16 | 942 | 881 | 243.6 |
| D | 7 | 3 | 2187 | 6.27 | 843 | 768 | 226.4 |
| D | 4 | 160 | 2108 | 5.92 | 843 | 768 | 226.4 |
| D | 6 | 67 | 2090 | 5.84 | 843 | 768 | 226.4 |
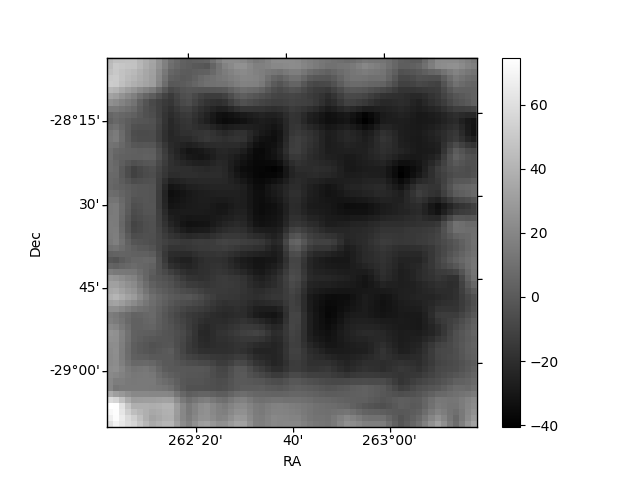
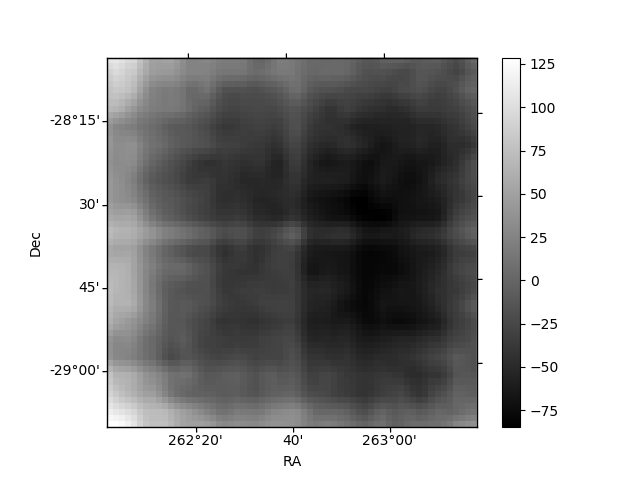
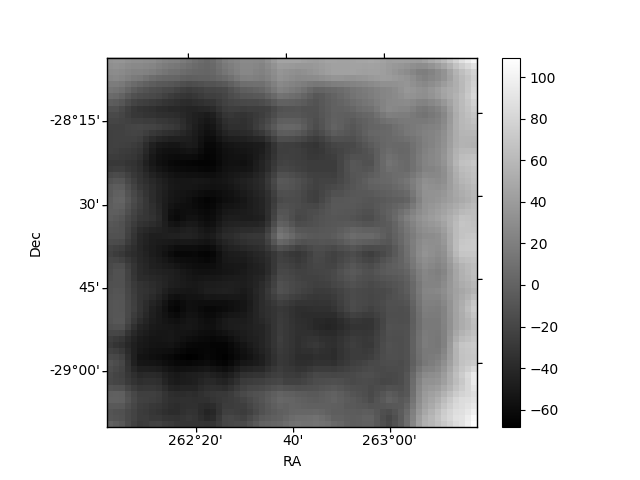
Histogram calculated using DETX and DETY for each event in the final _common_clean file
| Quadrant A | 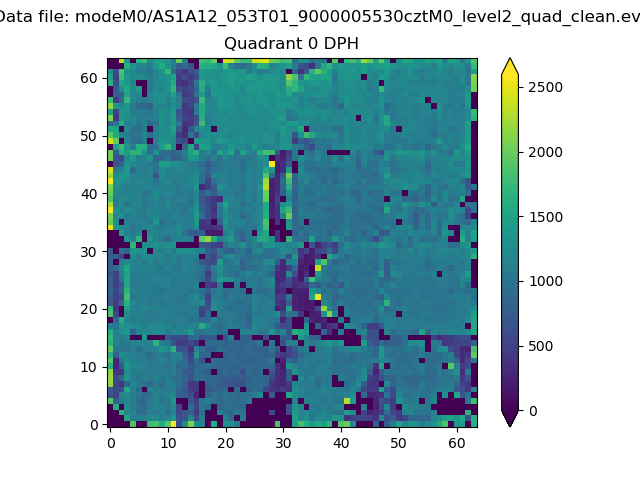 |
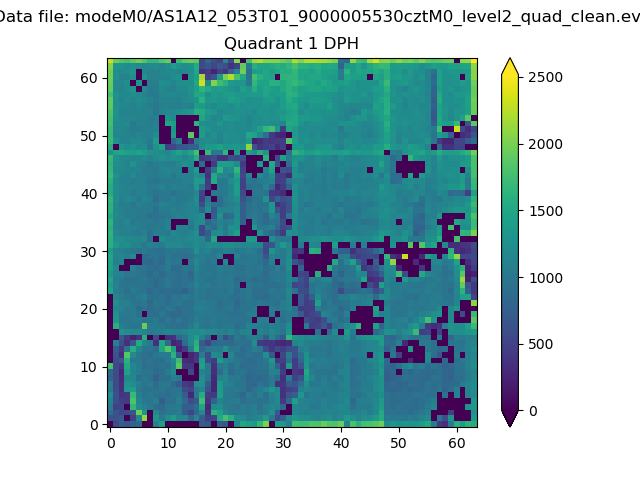 |
Quadrant B |
|---|---|---|---|
| Quadrant D |  |
 |
Quadrant C |
| Plot type | Count rate plots | Images |
|---|---|---|
| Comparison with Poisson distribution Blue bars denote a histogram of data divided into 1 sec bins. Red curve is a Poisson curve with rate = median count rate of data. |
 |
 |
| Quadrant-wise count rates Data is divided into 100 sec bins |
 |
|
| Module-wise count rates for Quadrant A Data is divided into 100 sec bins |
 |
 |
| Module-wise count rates for Quadrant B Data is divided into 100 sec bins |
 |
 |
| Module-wise count rates for Quadrant C Data is divided into 100 sec bins |
 |
 |
| Module-wise count rates for Quadrant D Data is divided into 100 sec bins |
 |
 |
| Parameter | Plot |
|---|---|
| CZT HV Monitor | 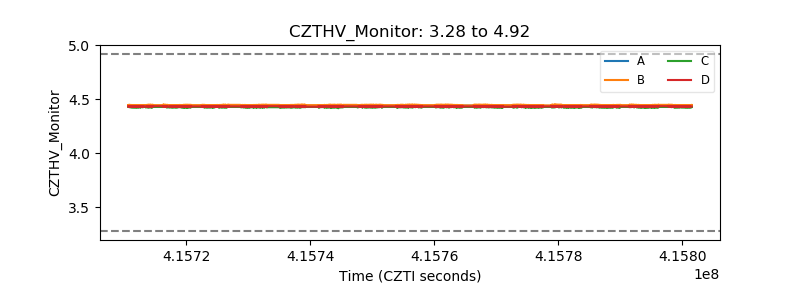 |
| D_VDD | 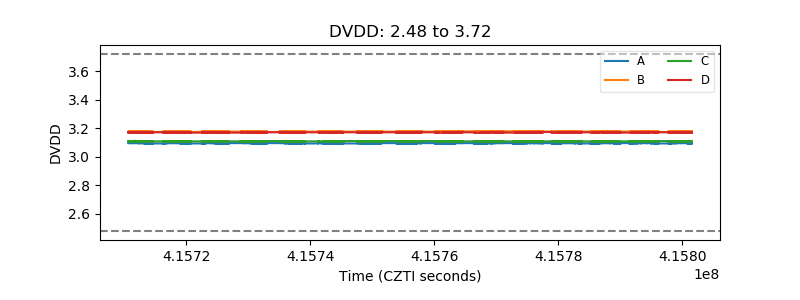 |
| Temperature 1 |  |
| Veto HV Monitor |  |
| Veto LLD |  |
| Alpha Counter | 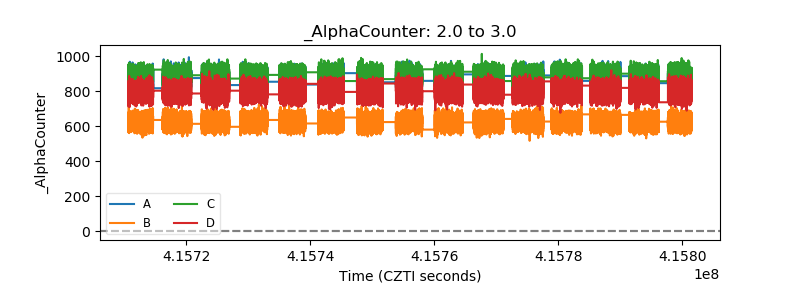 |
| _CPM_Rate | 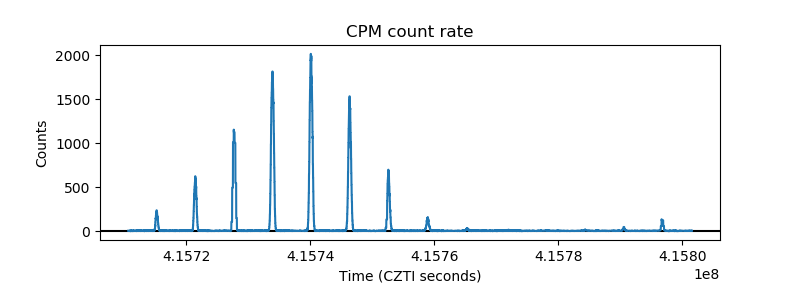 |
| CZT Counter |  |
| +2.5 Volts monitor |  |
| +5 Volts monitor | 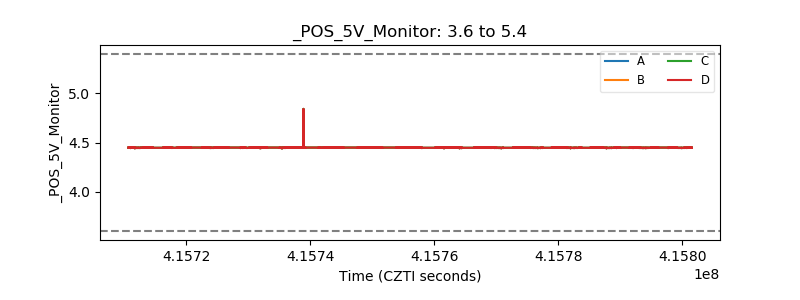 |
| _ROLL_ROT | 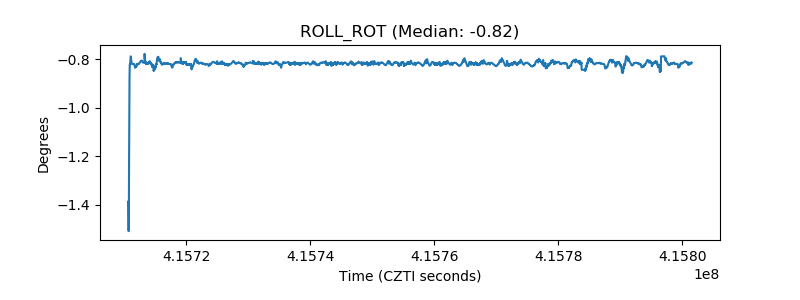 |
| _Roll_DEC | 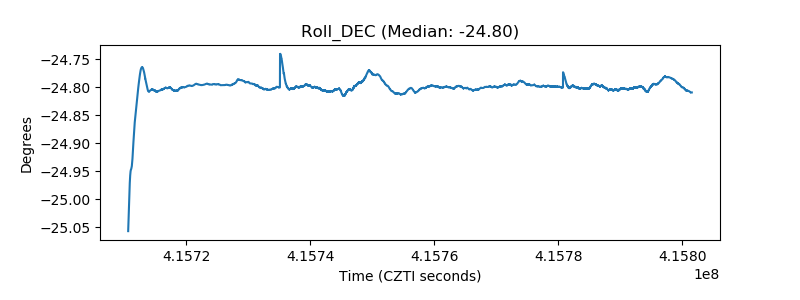 |
| _Roll_RA | 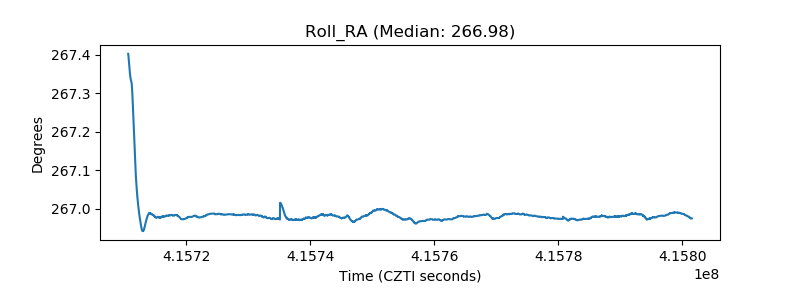 |
| Veto Counter |  |