| Param | Original file | Final file |
|---|---|---|
| Filename | modeM0/AS1A12_053T01_9000005530_40194cztM0_level2.fits | modeM0/AS1A12_053T01_9000005530_40194cztM0_level2_quad_clean.evt |
| Size (bytes) | 124,122,240 | 25,153,920 |
| Size | 118.4 MB | 24.0 MB |
| Events in quadrant A | 829,238 | 164,424 |
| Events in quadrant B | 906,772 | 169,467 |
| Events in quadrant C | 1,410,004 | 161,010 |
| Events in quadrant D | 1,320,175 | 147,716 |
| Mode M0 | |||
|---|---|---|---|
| Quadrant | BADHDUFLAG | Total packets | Discarded packets |
| A | 0 | 3396 | 1 |
| B | 0 | 3795 | 0 |
| C | 0 | 5283 | 0 |
| D | 0 | 5070 | 0 |
| Mode SS | |||
|---|---|---|---|
| Quadrant | BADHDUFLAG | Total packets | Discarded packets |
| A | 0 | 32 | 0 |
| B | 0 | 32 | 0 |
| C | 0 | 32 | 0 |
| D | 0 | 32 | 0 |
| Quadrant | Total seconds | Saturated seconds | Saturation percentage |
|---|---|---|---|
| A | 1619 | 6 | 0.370599% |
| B | 1619 | 16 | 0.988264% |
| C | 1619 | 91 | 5.620754% |
| D | 1619 | 88 | 5.435454% |
Noise dominated data is calculated using 1-second bins in cleaned event files. If a bin has >2000 counts, and if more than 50% of those come from <1% of pixels, then it is considered to be noise-dominated and hence unusable.
| Quadrant | # 1 sec bins | Bins with >0 counts | Bins with >2000 counts | High rate bins dominated by noise | Noise dominated (total time) | Noise dominated (detector-on time) | Marked lightcurve |
|---|---|---|---|---|---|---|---|
| A | 1619 | 1619 | 3 | 3 | 0.19% | 0.19% | 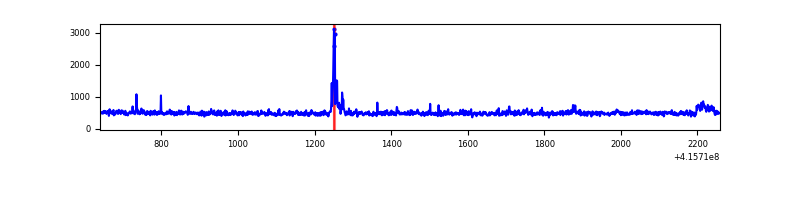 |
| B | 1619 | 1619 | 8 | 8 | 0.49% | 0.49% | 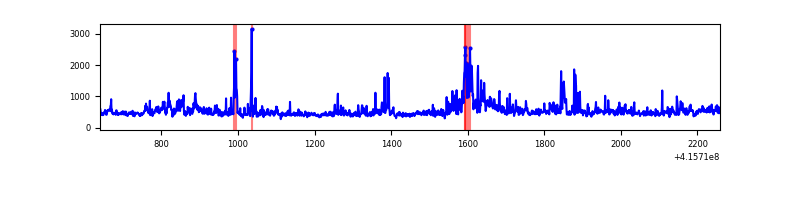 |
| C | 1619 | 1619 | 104 | 104 | 6.42% | 6.42% | 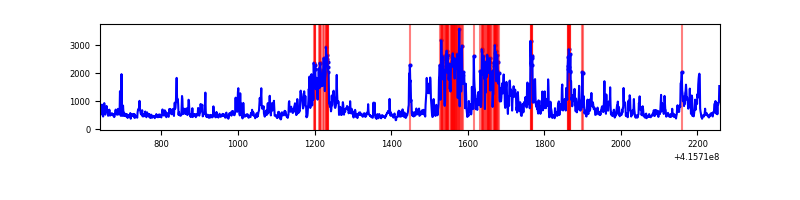 |
| D | 1619 | 1619 | 69 | 69 | 4.26% | 4.26% | 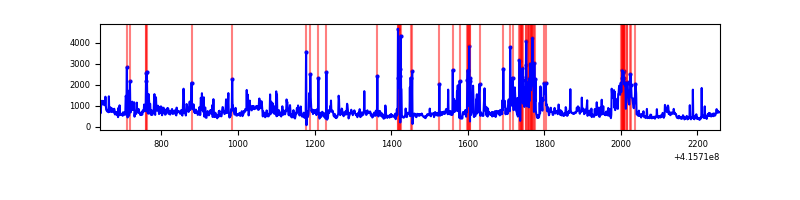 |
Top three noisy pixels from each quadrant. If the there are fewer than three noisy pixels in the level2.evt file, extra rows are filled as -1
| Pixel properties | Quadrant properties | ||||||
|---|---|---|---|---|---|---|---|
| Quadrant | DetID | PixID | Counts | Sigma | Mean | Median | Sigma |
| A | 10 | 83 | 112914 | 3066.99 | 171 | 167 | 36.8 |
| A | 13 | 248 | 24588 | 664.31 | 171 | 167 | 36.8 |
| A | 2 | 79 | 13732 | 369.0 | 171 | 167 | 36.8 |
| B | 12 | 18 | 58469 | 1707.84 | 169 | 166 | 34.1 |
| B | 0 | 230 | 45542 | 1329.18 | 169 | 166 | 34.1 |
| B | 5 | 255 | 41799 | 1219.53 | 169 | 166 | 34.1 |
| C | 4 | 254 | 673705 | 17030.92 | 163 | 163 | 39.5 |
| C | 15 | 214 | 65869 | 1661.42 | 163 | 163 | 39.5 |
| C | 14 | 254 | 25257 | 634.52 | 163 | 163 | 39.5 |
| D | 12 | 227 | 511106 | 12026.32 | 165 | 160 | 42.5 |
| D | 6 | 239 | 90740 | 2132.01 | 165 | 160 | 42.5 |
| D | 13 | 249 | 32825 | 768.85 | 165 | 160 | 42.5 |
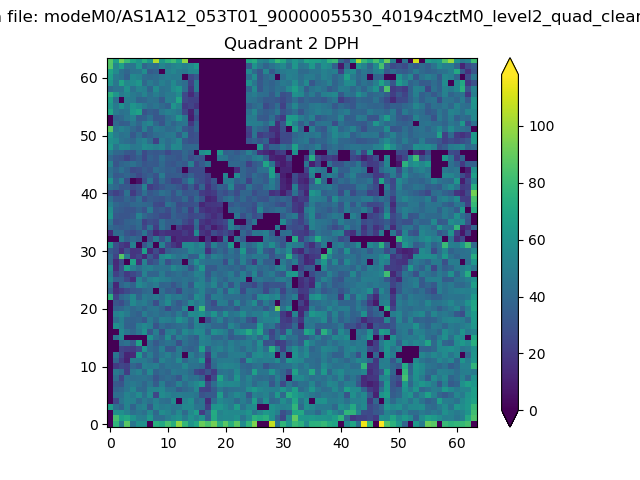
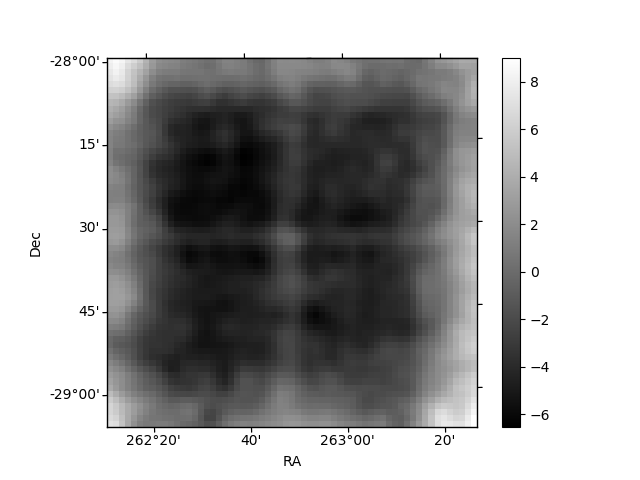
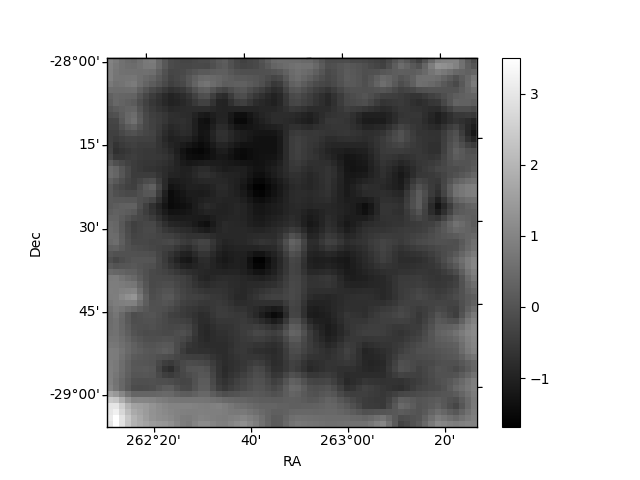
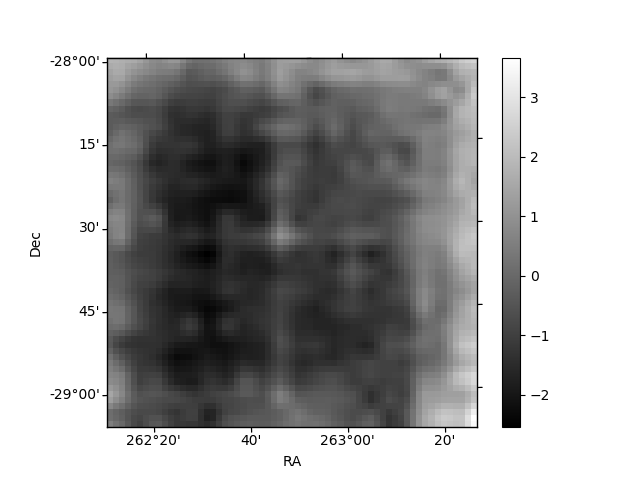
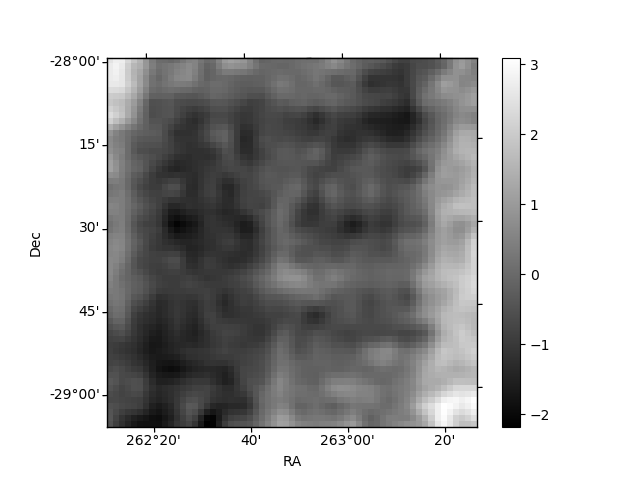
Histogram calculated using DETX and DETY for each event in the final _common_clean file
| Quadrant A | 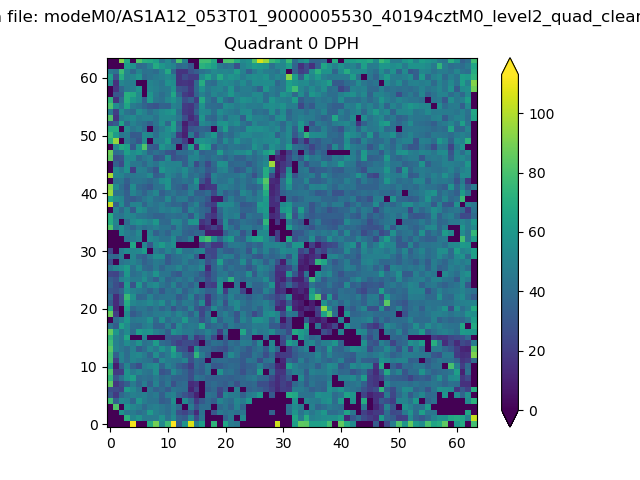 |
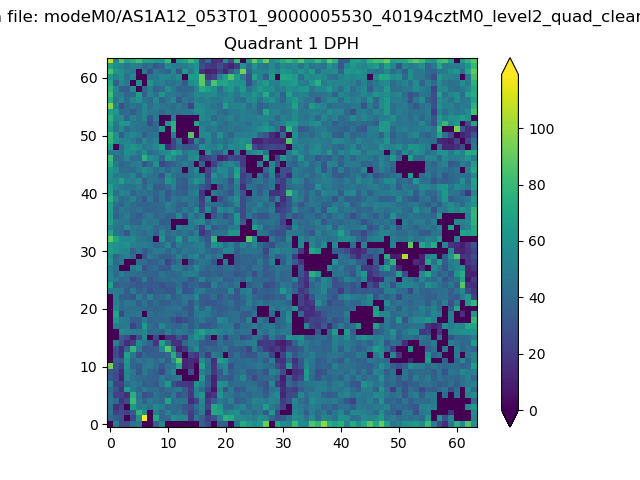 |
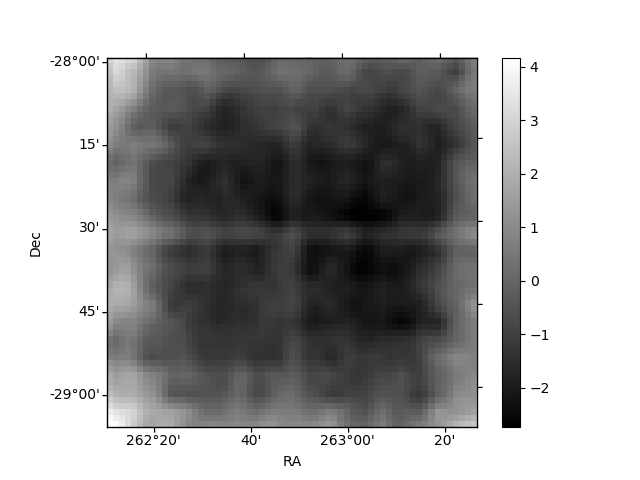
Quadrant B |
|---|---|---|---|
| Quadrant D | 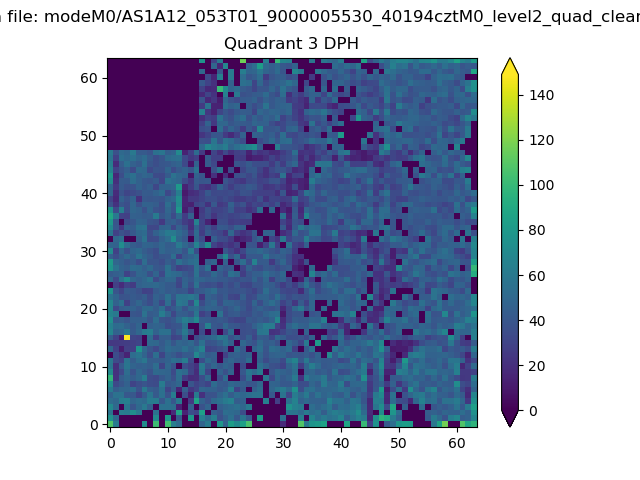 |
 |
Quadrant C |
| Plot type | Count rate plots | Images |
|---|---|---|
| Comparison with Poisson distribution Blue bars denote a histogram of data divided into 1 sec bins. Red curve is a Poisson curve with rate = median count rate of data. |
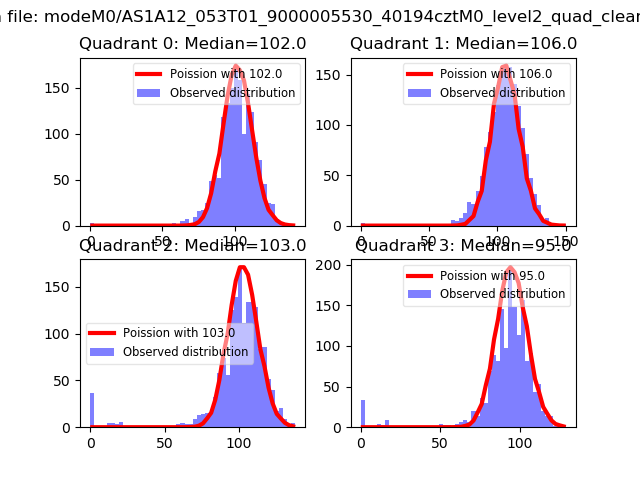 |
 |
| Quadrant-wise count rates Data is divided into 100 sec bins |
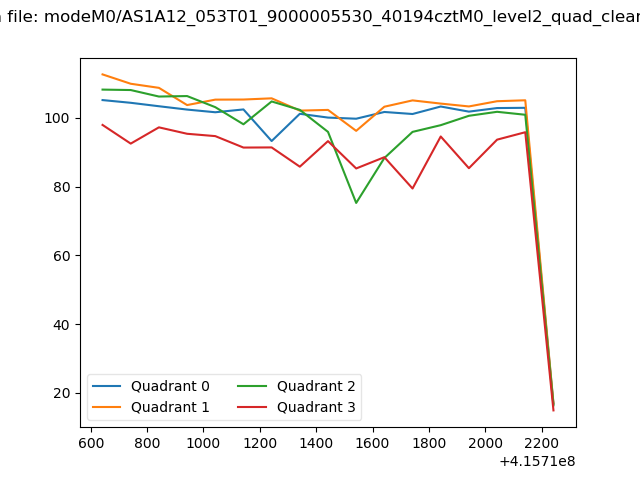 |
|
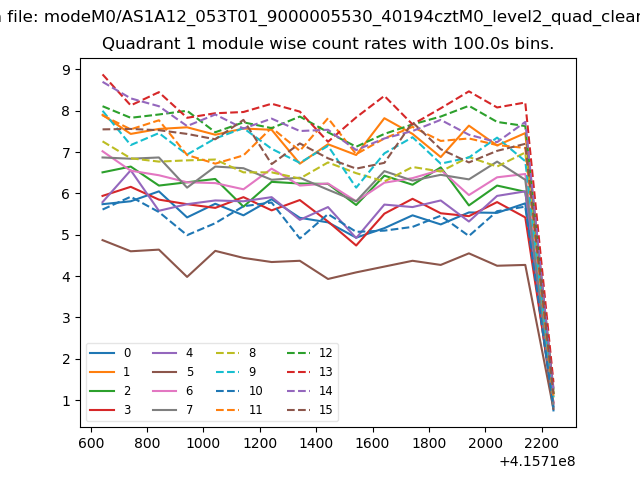
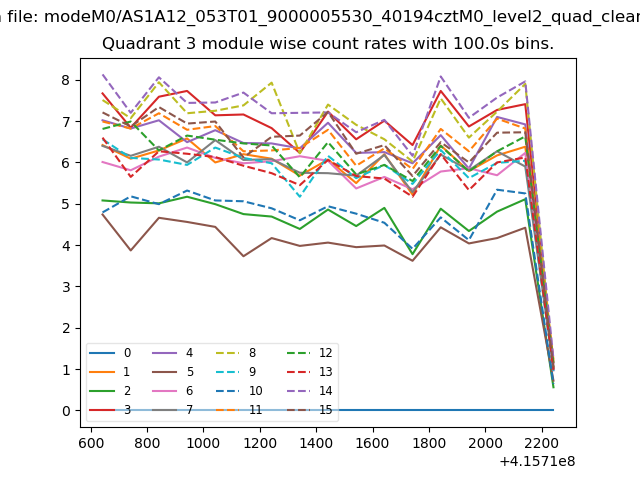
| Module-wise count rates for Quadrant A Data is divided into 100 sec bins |
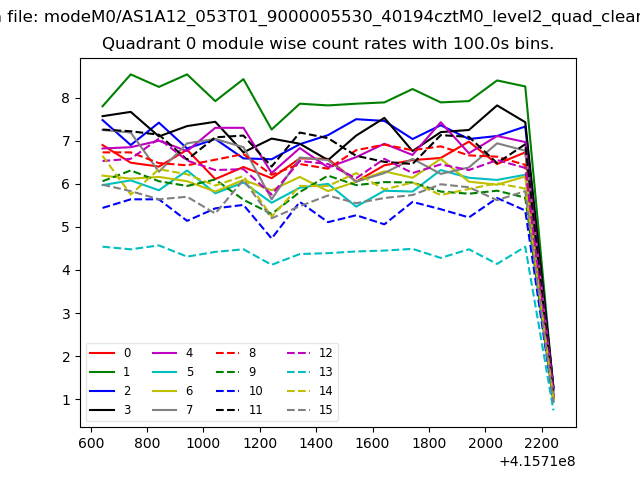 |
 |
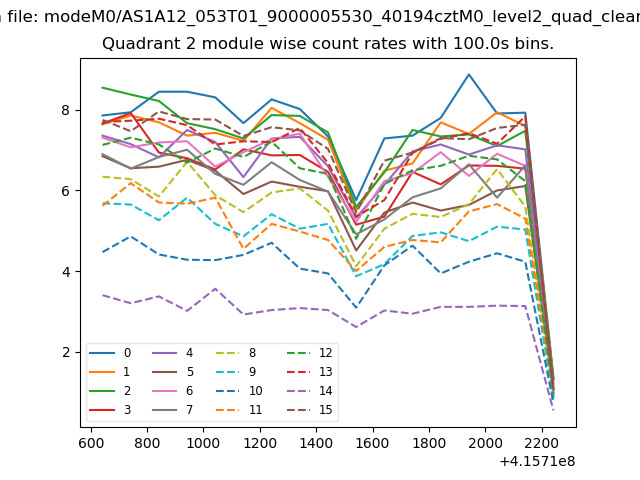
| Module-wise count rates for Quadrant B Data is divided into 100 sec bins |
 |
 |
| Module-wise count rates for Quadrant C Data is divided into 100 sec bins |
 |
 |
| Module-wise count rates for Quadrant D Data is divided into 100 sec bins |
 |
 |
| Parameter | Plot |
|---|---|
| CZT HV Monitor |  |
| D_VDD | 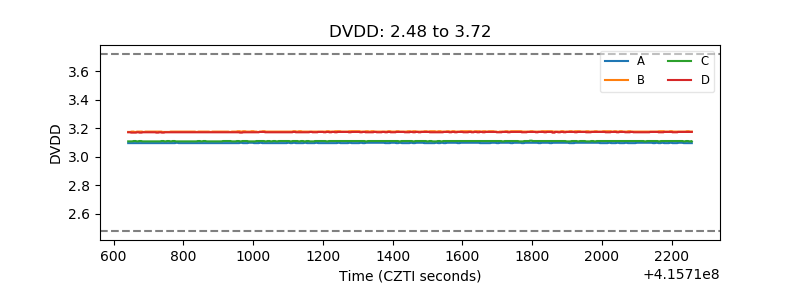 |
| Temperature 1 | 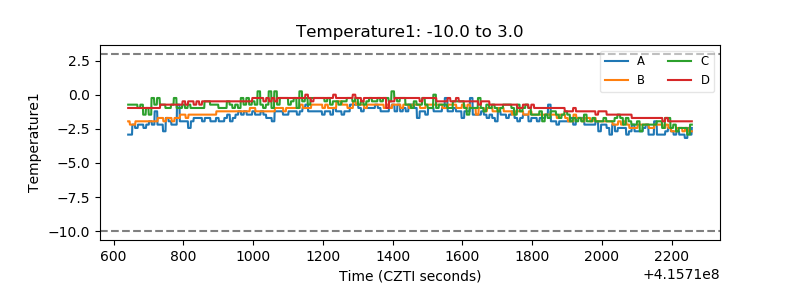 |
| Veto HV Monitor | 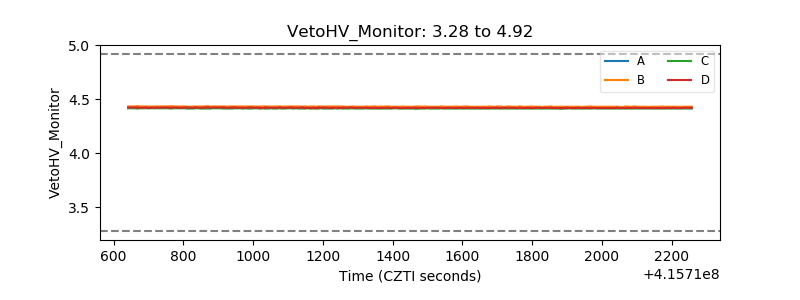 |
| Veto LLD | 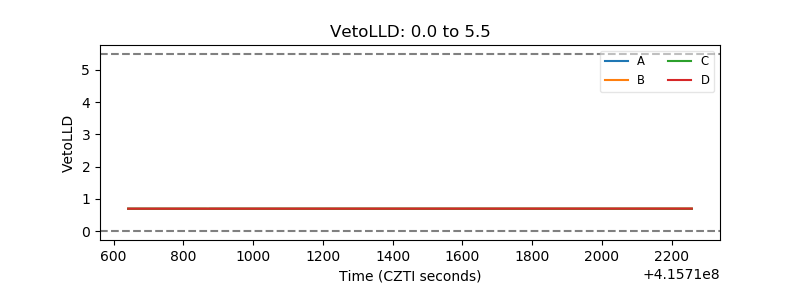 |
| Alpha Counter | 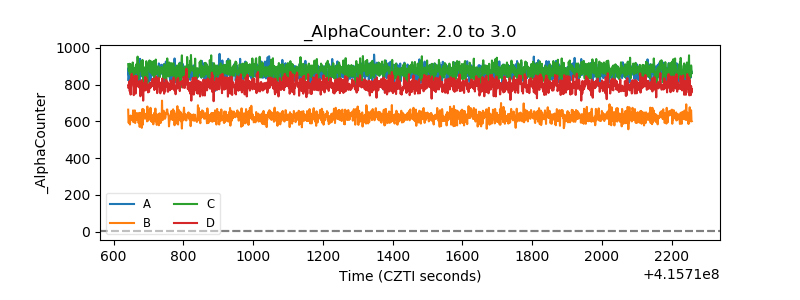 |
| _CPM_Rate | 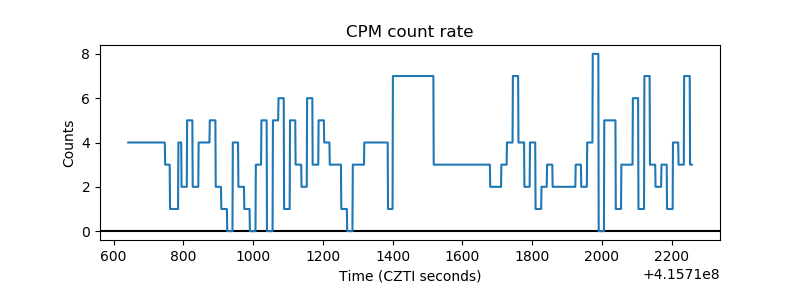 |
| CZT Counter | 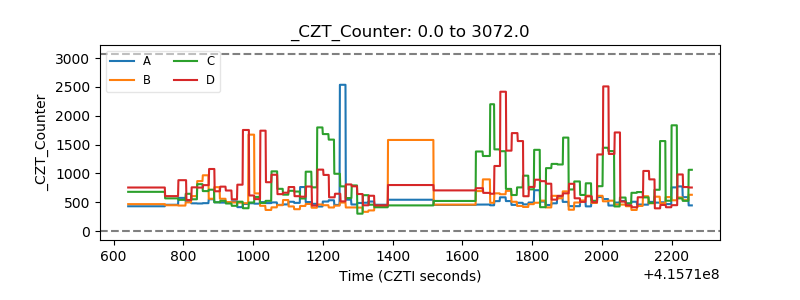 |
| +2.5 Volts monitor | 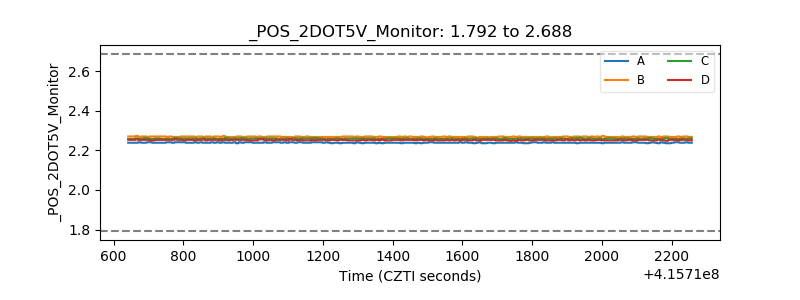 |
| +5 Volts monitor | 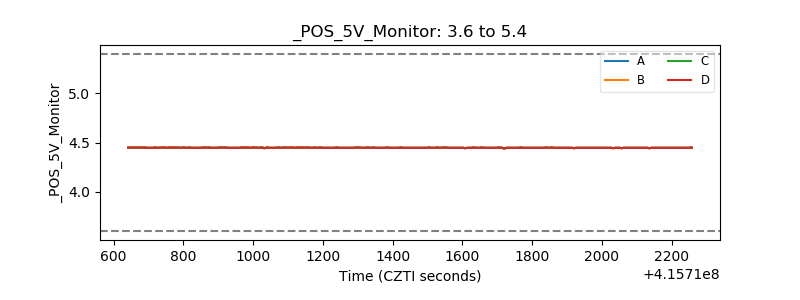 |
| _ROLL_ROT | 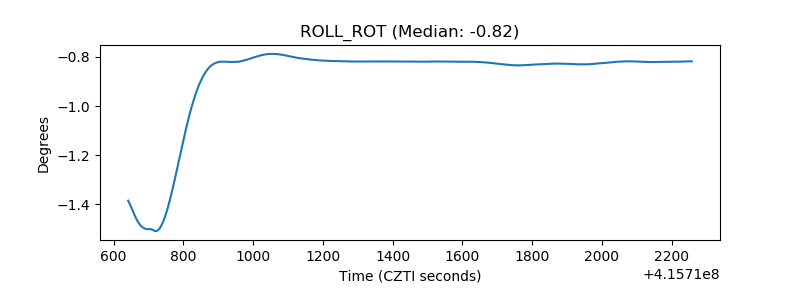 |
| _Roll_DEC | 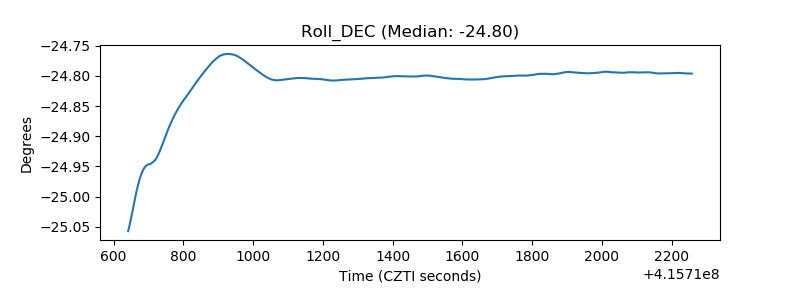 |
| _Roll_RA | 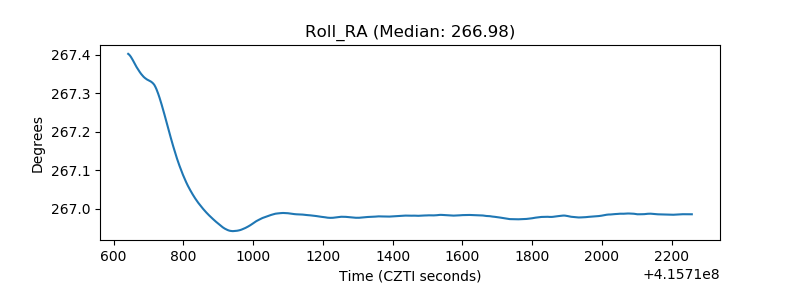 |
| Veto Counter | 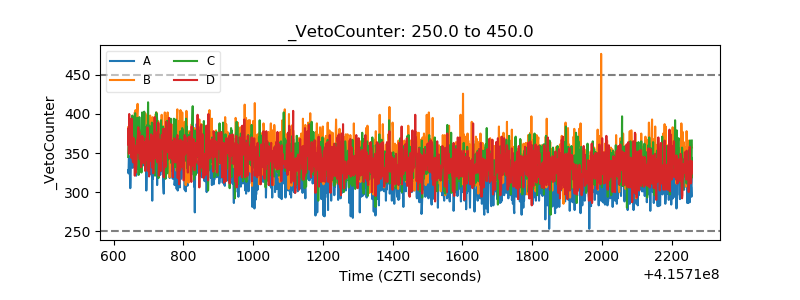 |