| Param | Original file | Final file |
|---|---|---|
| Filename | modeM0/AS1A12_053T01_9000005530_40195cztM0_level2.fits | modeM0/AS1A12_053T01_9000005530_40195cztM0_level2_quad_clean.evt |
| Size (bytes) | 558,440,640 | 141,327,360 |
| Size | 532.6 MB | 134.8 MB |
| Events in quadrant A | 4,626,502 | 943,301 |
| Events in quadrant B | 4,165,302 | 964,566 |
| Events in quadrant C | 5,078,150 | 932,521 |
| Events in quadrant D | 6,138,408 | 844,972 |
| Mode M0 | |||
|---|---|---|---|
| Quadrant | BADHDUFLAG | Total packets | Discarded packets |
| A | 0 | 18731 | 3 |
| B | 0 | 18027 | 2 |
| C | 0 | 20381 | 2 |
| D | 0 | 24161 | 2 |
| Mode SS | |||
|---|---|---|---|
| Quadrant | BADHDUFLAG | Total packets | Discarded packets |
| A | 0 | 174 | 0 |
| B | 0 | 174 | 0 |
| C | 0 | 174 | 0 |
| D | 0 | 174 | 0 |
| Mode M9 | |||
|---|---|---|---|
| Quadrant | BADHDUFLAG | Total packets | Discarded packets |
| A | 0 | 33 | 0 |
| B | 0 | 33 | 0 |
| C | 0 | 33 | 0 |
| D | 0 | 33 | 0 |
| Quadrant | Total seconds | Saturated seconds | Saturation percentage |
|---|---|---|---|
| A | 8554 | 48 | 0.561141% |
| B | 8554 | 49 | 0.572831% |
| C | 8554 | 45 | 0.526070% |
| D | 8554 | 259 | 3.027823% |
Noise dominated data is calculated using 1-second bins in cleaned event files. If a bin has >2000 counts, and if more than 50% of those come from <1% of pixels, then it is considered to be noise-dominated and hence unusable.
| Quadrant | # 1 sec bins | Bins with >0 counts | Bins with >2000 counts | High rate bins dominated by noise | Noise dominated (total time) | Noise dominated (detector-on time) | Marked lightcurve |
|---|---|---|---|---|---|---|---|
| A | 11779 | 8556 | 33 | 33 | 0.28% | 0.39% | 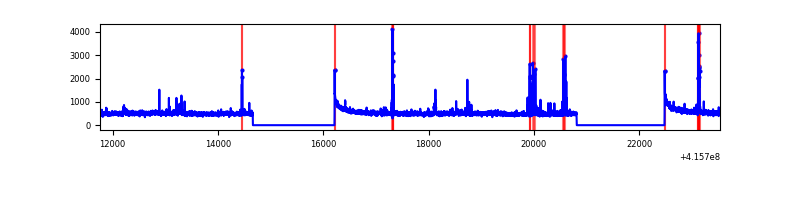 |
| B | 11779 | 8556 | 29 | 29 | 0.25% | 0.34% | 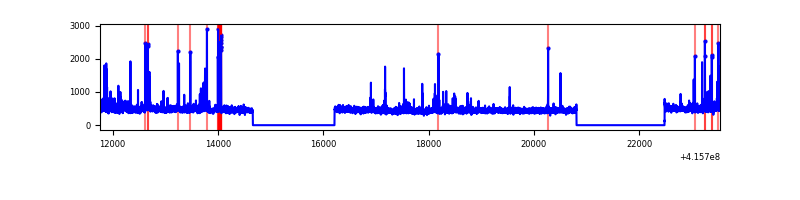 |
| C | 11779 | 8556 | 38 | 38 | 0.32% | 0.44% | 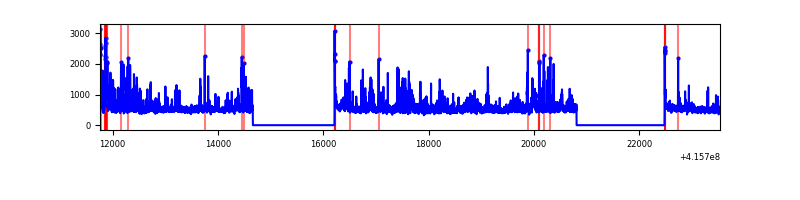 |
| D | 11779 | 8556 | 234 | 234 | 1.99% | 2.73% | 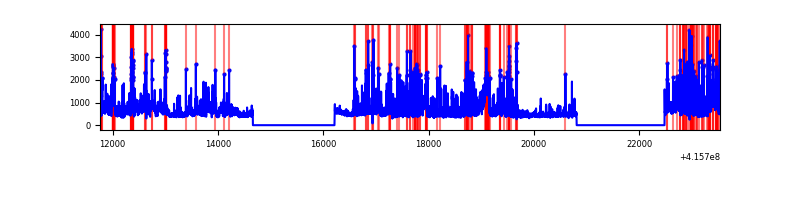 |
Top three noisy pixels from each quadrant. If the there are fewer than three noisy pixels in the level2.evt file, extra rows are filled as -1
| Pixel properties | Quadrant properties | ||||||
|---|---|---|---|---|---|---|---|
| Quadrant | DetID | PixID | Counts | Sigma | Mean | Median | Sigma |
| A | 10 | 83 | 705114 | 3645.15 | 948 | 928 | 193.2 |
| A | 13 | 248 | 147640 | 759.44 | 948 | 928 | 193.2 |
| A | 2 | 79 | 51957 | 264.15 | 948 | 928 | 193.2 |
| B | 5 | 255 | 164612 | 890.44 | 952 | 925 | 183.8 |
| B | 0 | 230 | 79008 | 424.76 | 952 | 925 | 183.8 |
| B | 12 | 18 | 42953 | 228.63 | 952 | 925 | 183.8 |
| C | 4 | 254 | 882044 | 4073.24 | 932 | 937 | 216.3 |
| C | 15 | 214 | 356222 | 1642.44 | 932 | 937 | 216.3 |
| C | 14 | 254 | 77625 | 354.52 | 932 | 937 | 216.3 |
| D | 12 | 227 | 1892798 | 8301.57 | 922 | 896 | 227.9 |
| D | 6 | 239 | 243076 | 1062.67 | 922 | 896 | 227.9 |
| D | 13 | 249 | 231960 | 1013.9 | 922 | 896 | 227.9 |
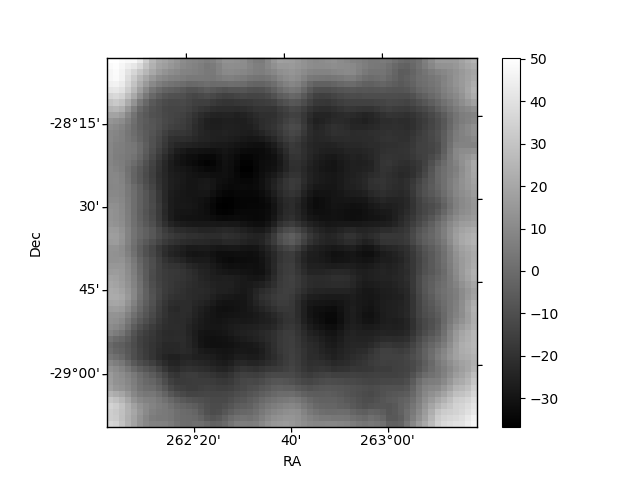
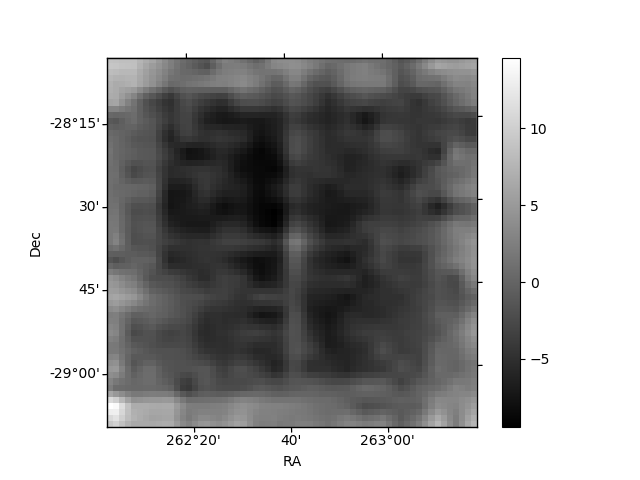
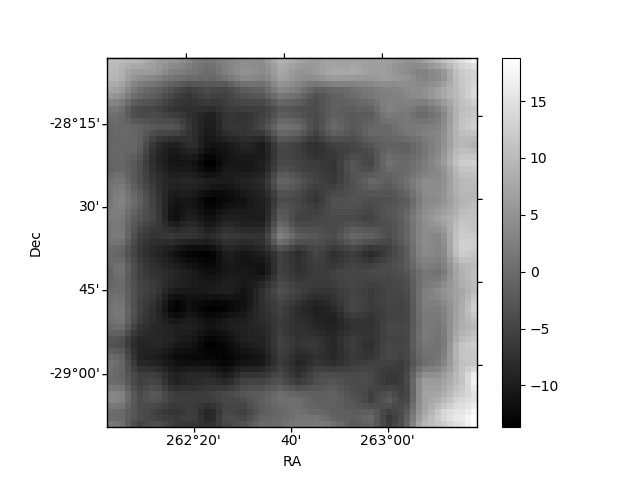
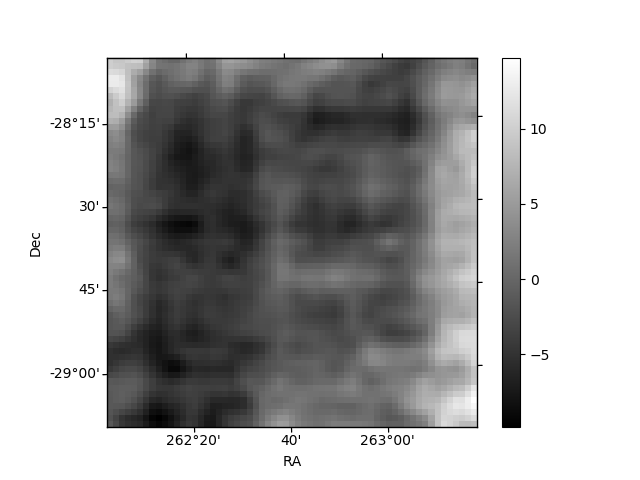
Histogram calculated using DETX and DETY for each event in the final _common_clean file
| Quadrant A | 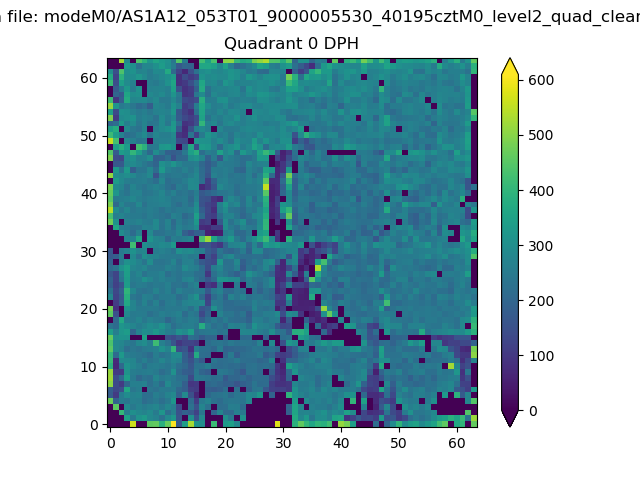 |
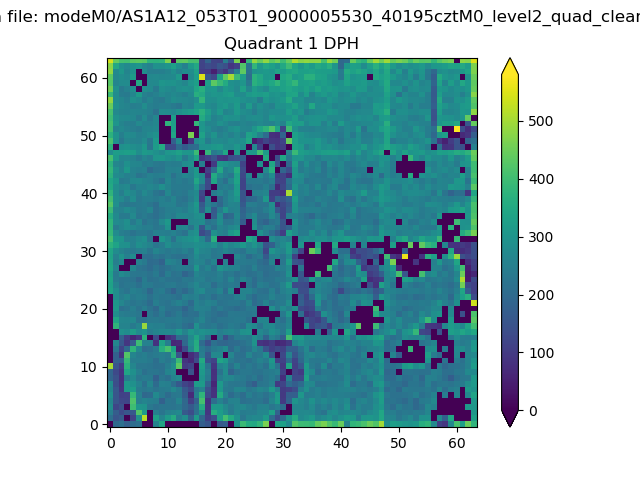 |
Quadrant B |
|---|---|---|---|
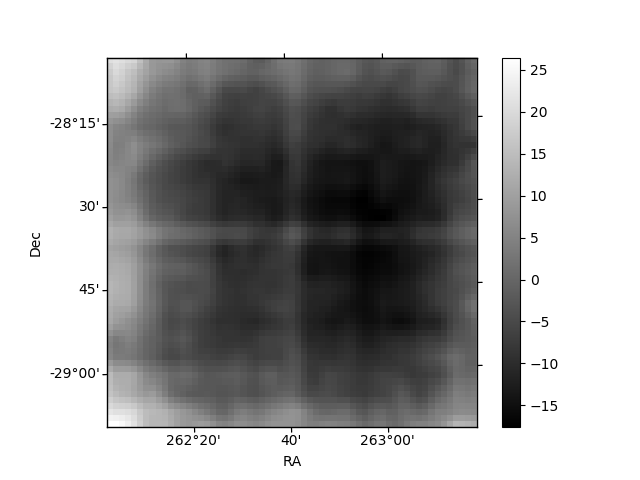
| Quadrant D | 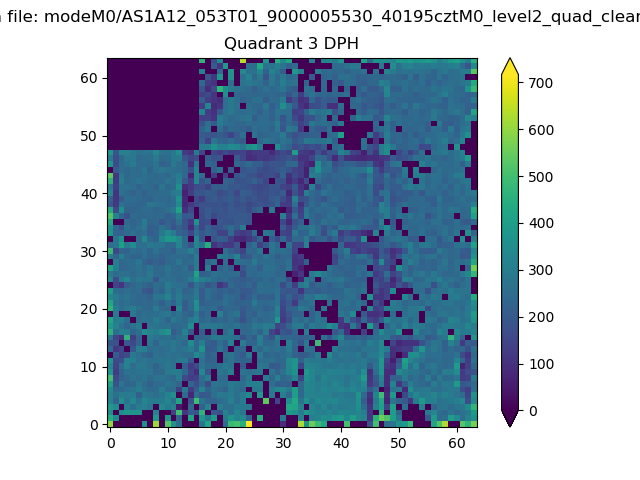 |
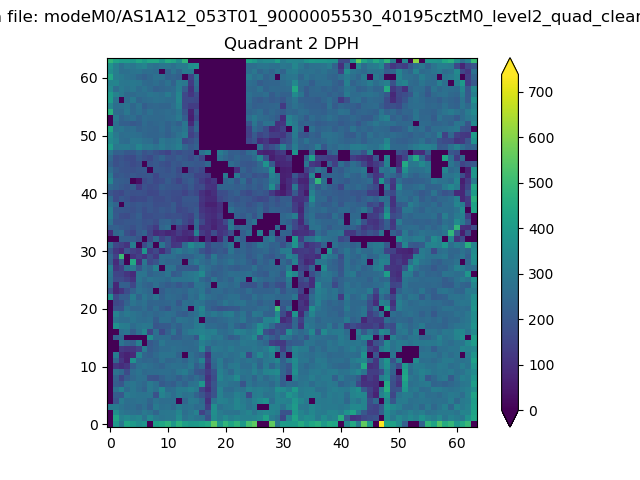 |
Quadrant C |
| Plot type | Count rate plots | Images |
|---|---|---|
| Comparison with Poisson distribution Blue bars denote a histogram of data divided into 1 sec bins. Red curve is a Poisson curve with rate = median count rate of data. |
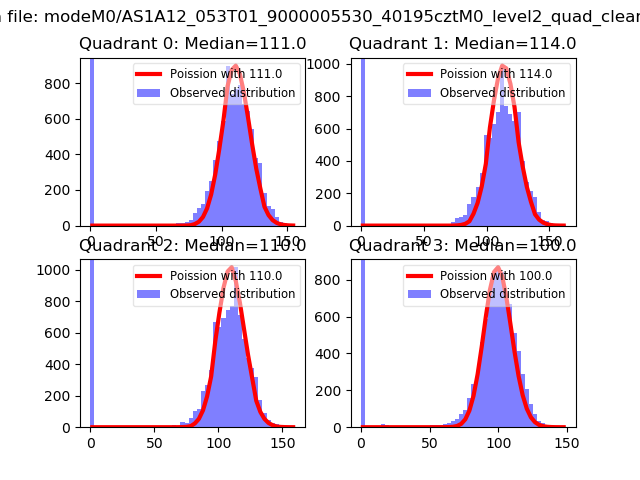 |
 |
| Quadrant-wise count rates Data is divided into 100 sec bins |
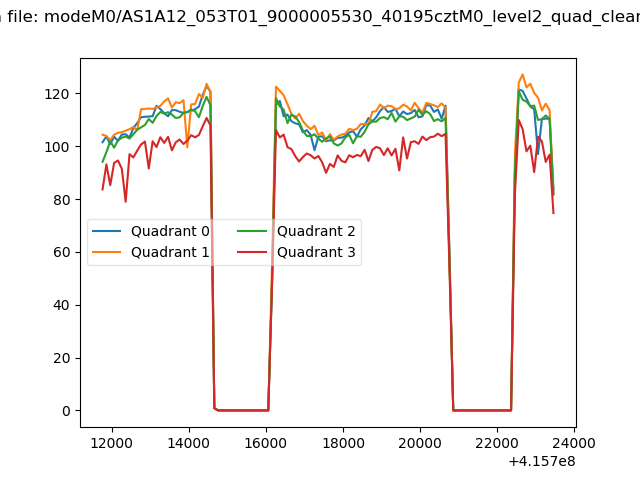 |
|
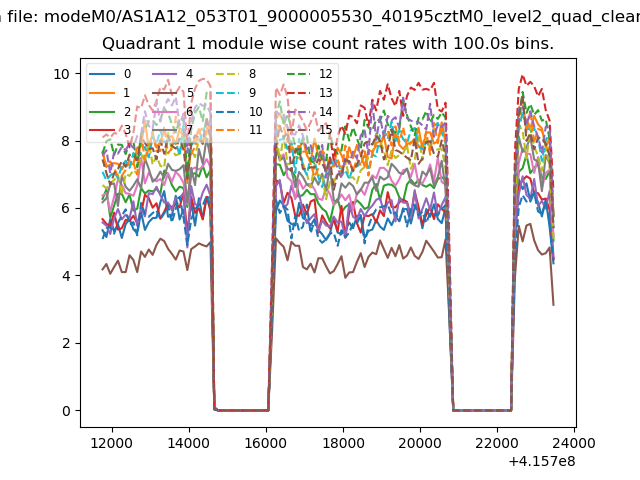
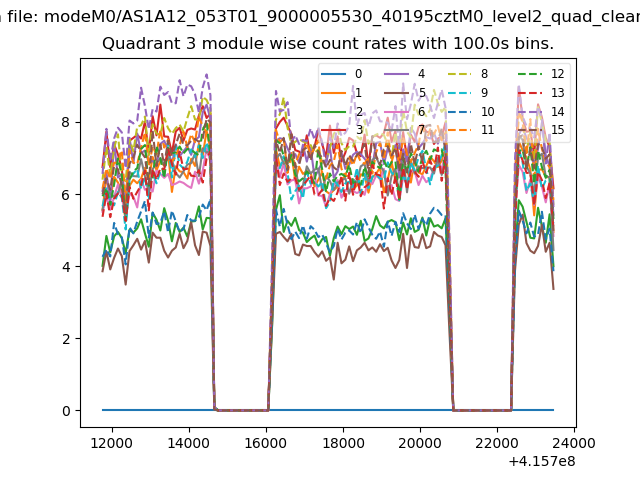
| Module-wise count rates for Quadrant A Data is divided into 100 sec bins |
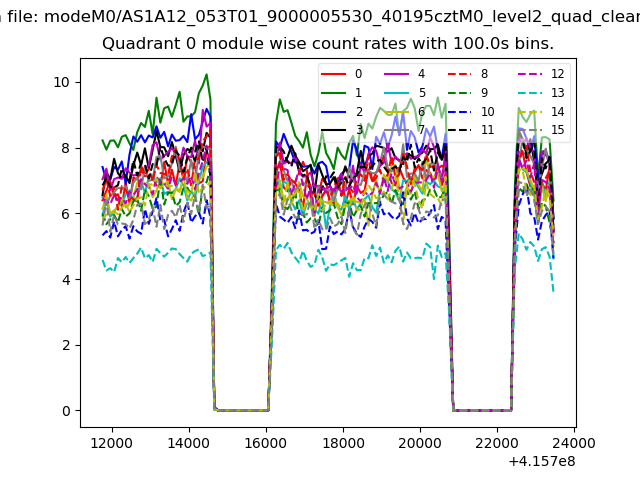 |
 |
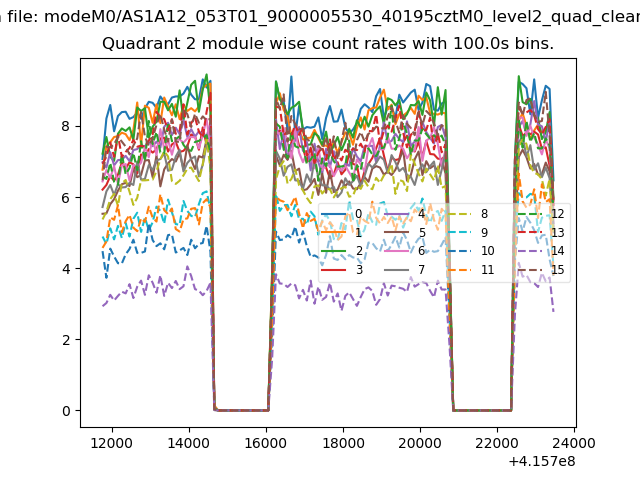
| Module-wise count rates for Quadrant B Data is divided into 100 sec bins |
 |
 |
| Module-wise count rates for Quadrant C Data is divided into 100 sec bins |
 |
 |
| Module-wise count rates for Quadrant D Data is divided into 100 sec bins |
 |
 |
| Parameter | Plot |
|---|---|
| CZT HV Monitor | 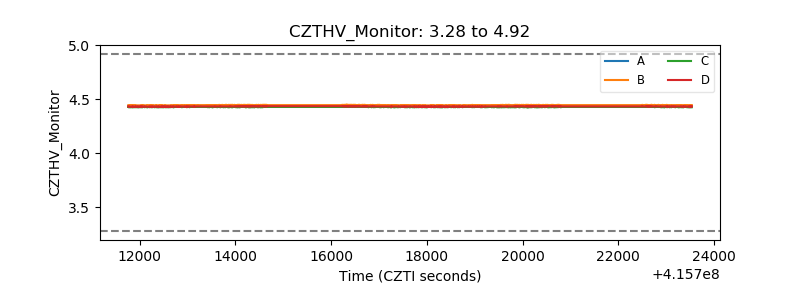 |
| D_VDD | 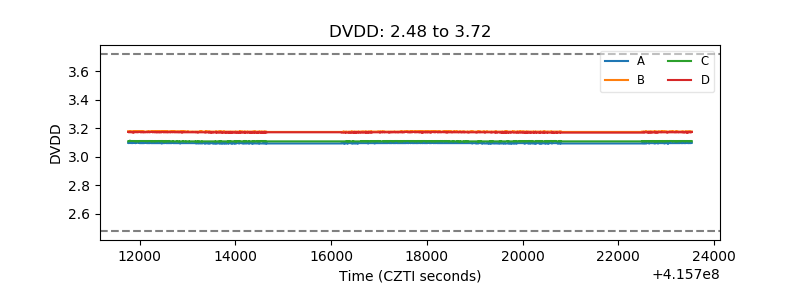 |
| Temperature 1 | 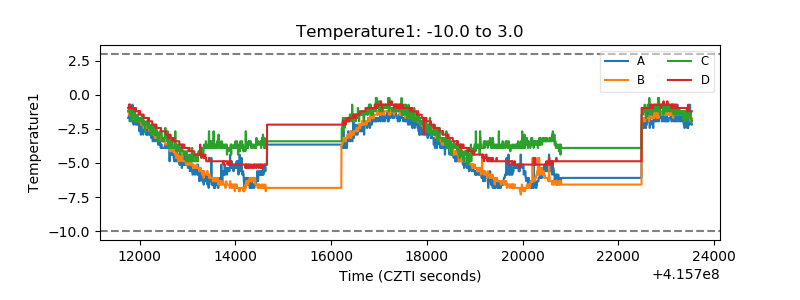 |
| Veto HV Monitor | 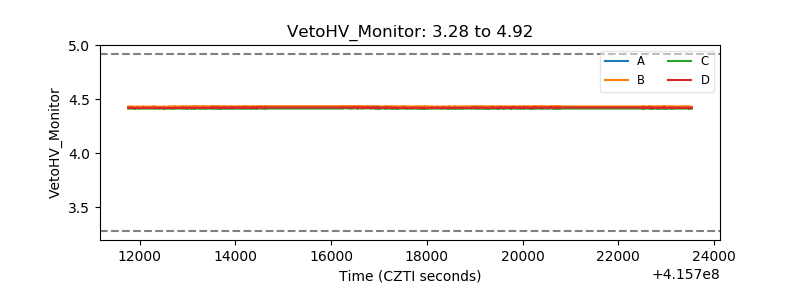 |
| Veto LLD | 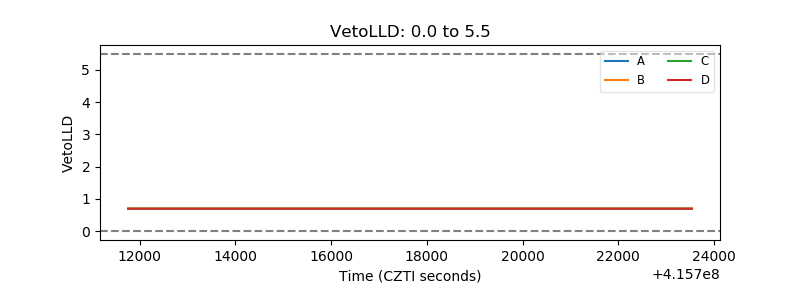 |
| Alpha Counter | 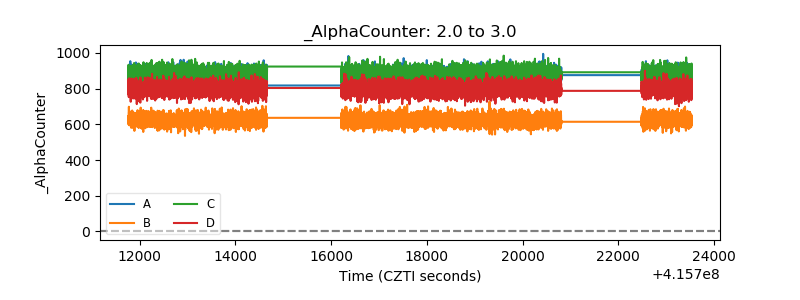 |
| _CPM_Rate | 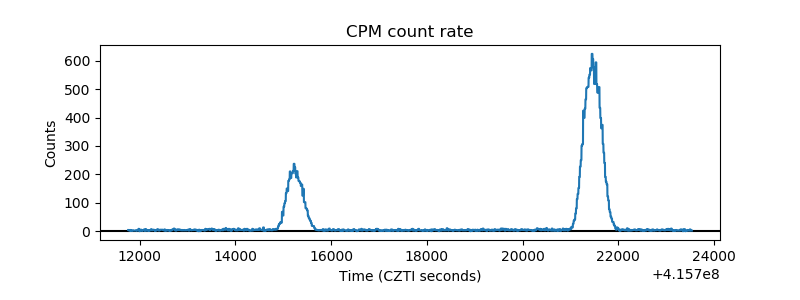 |
| CZT Counter | 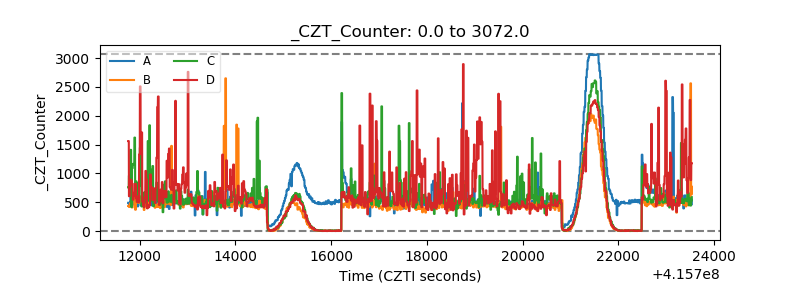 |
| +2.5 Volts monitor | 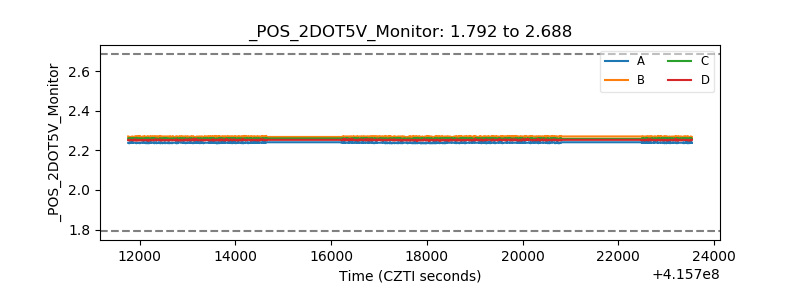 |
| +5 Volts monitor | 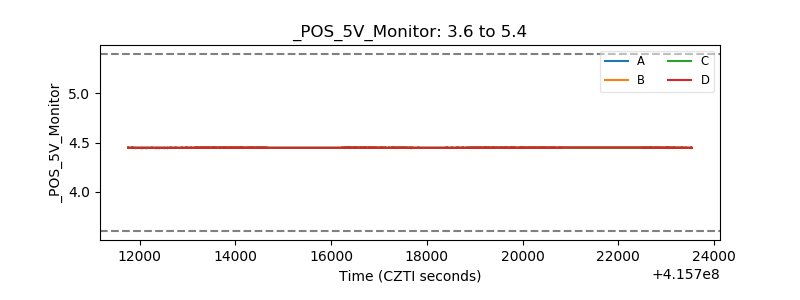 |
| _ROLL_ROT | 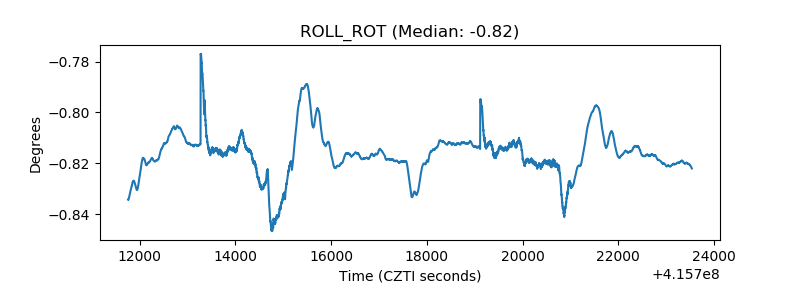 |
| _Roll_DEC | 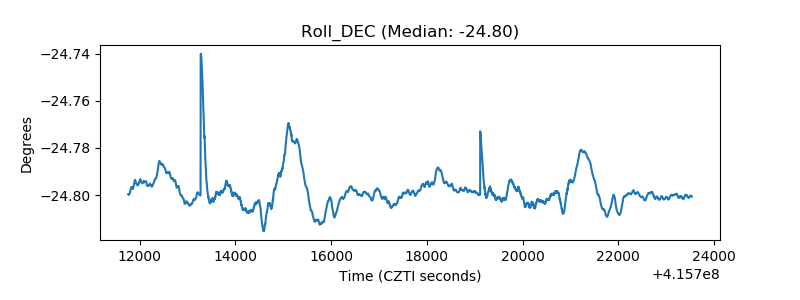 |
| _Roll_RA | 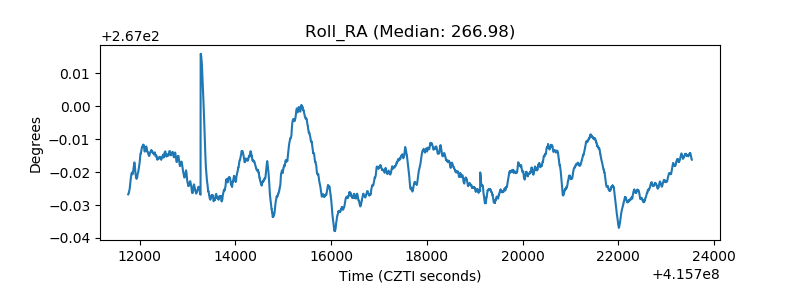 |
| Veto Counter | 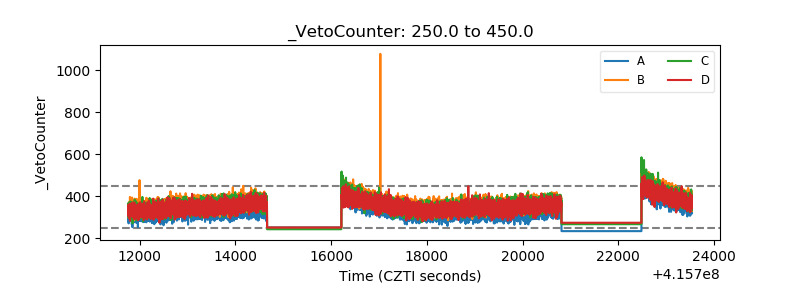 |